
Charts: Trading View
EUR/USD:
Monthly timeframe:
(Technical change on this timeframe is often limited, though serves as guidance to potential longer-term moves)
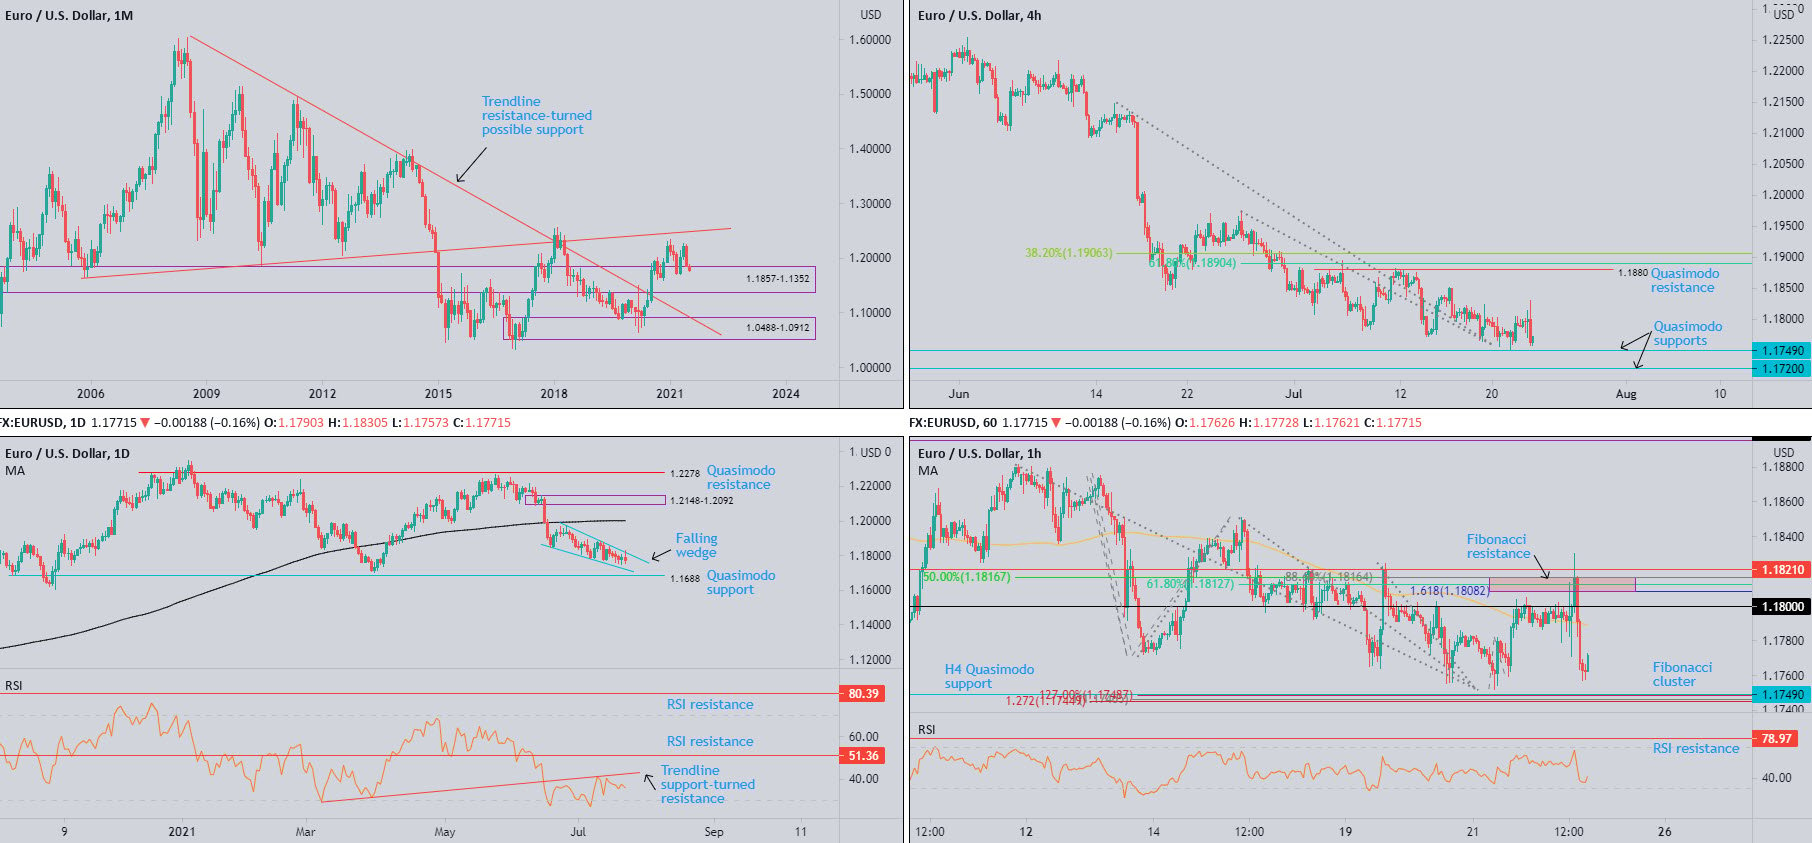
Closing the book on the month of June had EUR/USD—in the shape of a near-full-bodied bearish candle—touch gloves with familiar support at $1.1857-1.1352 and erase 3.0 percent.
A bullish revival shines light on 2021 peaks at $1.2349; additional enthusiasm welcomes ascending resistance (prior support [$1.1641]).
Month to date, July trades 0.7 percent lower.
Based on trend studies, a primary uptrend has been underway since price broke the $1.1714 high (Aug 2015) in July 2017. Furthermore, price penetrated major trendline resistance, taken from the high $1.6038, in July 2020.
Daily timeframe:
Technical Structure Unchanged from Previous Analysis.
Since mid-June, the daily timeframe has been carving out a falling wedge ($1.1848/$1.1975). In the event price continues to compress within the falling wedge, Quasimodo support at $1.1688 is likely to make an entrance, arranged south of 31st March low at $1.1704 (a place sell-stops will be tripped).
Any upside attempts (a breakout above the current wedge pattern) reignites interest at the 200-day simple moving average, circling $1.2002 (sheltered beneath supply at $1.2148-1.2092).
With regards to trend, we have been somewhat rudderless since the beginning of the year, despite healthy gains in 2020.
Out of the relative strength index (RSI), the indicator occupies space south of trendline support-turned resistance (around 40.00), extended from the low 29.54. Resistance is close by at 51.36, serving reasonably well since November 2020, whereas support is visible in the form of the oversold threshold around 30.00.
H4 timeframe:
Quasimodo support from $1.1749 is a key watch on the H4 scale as price movement threatens to challenge the base today.
South of the aforesaid level, another layer of Quasimodo support resides at $1.1720.
H1 timeframe:
Following an earlier whipsaw above $1.18 into Fibonacci structure between $1.1817 and $1.1808 (red zone)—potential movement to be aware of in Thursday’s technical briefing—price action subsequently forged a volatile $1.18 whipsaw which tested the mettle of resistance at $1.1812.
As you can see, EUR/USD concluded Europe on the back foot, ahead of H4 Quasimodo support mentioned above at $1.1749 and a collection of H1 Fibonacci studies (Fib cluster).
The relative strength index (RSI) aggressively rotated beneath overbought space and finished the session beneath the 50.00 centreline, indicating momentum is to the downside: average losses exceed average gains.
Observed levels:
Immediate support rests at the Quasimodo pattern from $1.1749 on the H4, accompanied by a number of key Fibonacci ratios on the H1. A bounce from this neighbourhood, therefore, should not surprise.
Should sellers overwhelm $1.1749, $1.17 could appeal (H1), a level closely sharing chart space with H4 Quasimodo support from $1.1720.
AUD/USD:
Monthly timeframe:
(Technical change on this timeframe is often limited, though serves as guidance to potential longer-term moves)
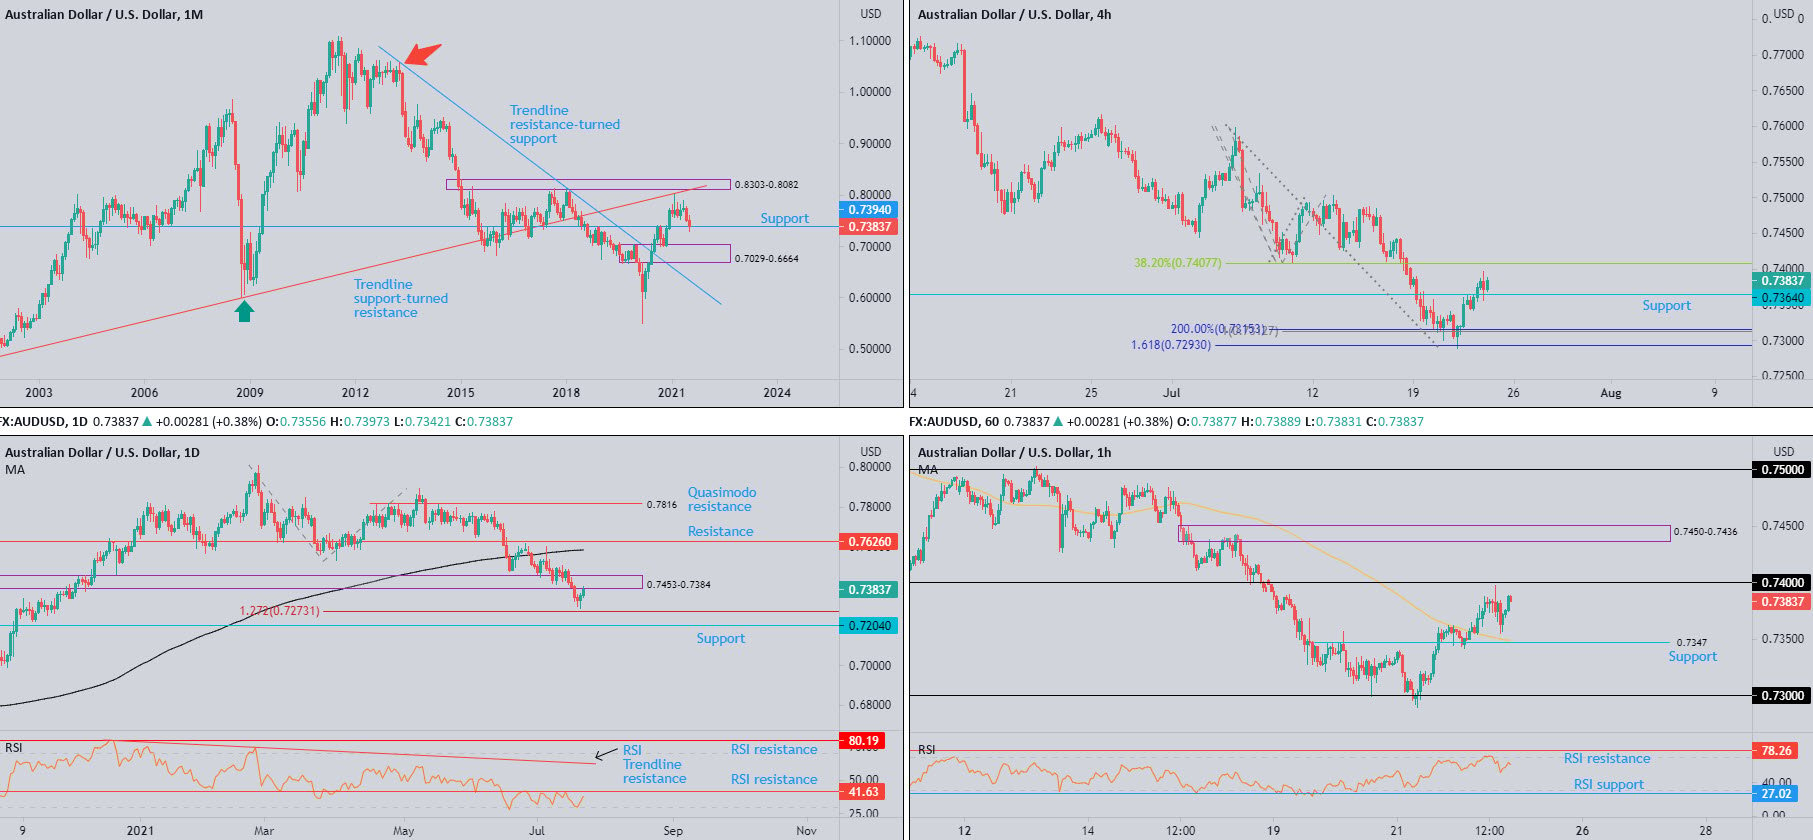
Following June’s 3.0 percent decline, July is attempting to secure position south of support at $0.7394. Additional downside pressure brings demand at $0.7029-0.6664 to light (prior supply).
Month to date, July is down 1.5 percent.
Trend studies (despite the trendline resistance [$1.0582] breach in July 2020) show the primary downtrend (since mid-2011) is in play until breaking $0.8135 (January high 2018).
Daily timeframe:
Wednesday, ahead of a 1.272% Fib projection at $0.7273, chalked up what’s known as a bullish outside reversal formation, a move snapping a four-day losing streak. As you can see, follow-through buying emerged yesterday, shaking hands with resistance at $0.7453-0.7384.
Overrunning current resistance potentially sets the technical stage for a push to the 200-day simple moving average currently seen at $0.7584.
In terms of trend, 2021 remains on the back foot. As for momentum, the relative strength index (RSI) continues to exhibit a narrow consolidation between resistance at 41.63 and the oversold perimeter 30.00.
H4 timeframe:
AUD/USD extending recovery gains on Thursday elevated the currency pair above resistance at $0.7364, a level shortly after welcoming a retest and holding support.
Fibonacci structure between $0.7293 and $0.7315—an area housing a 100% Fib projection at $0.7313, a level harmonic traders will recognise as an AB=CD bullish formation—held firm mid-week. Harmonic AB=CD traders traditionally set take-profit targets at 38.2% and 61.8% Fib retracement levels, derived from legs A-D. 38.2% Fib resistance resides at $0.7408 and may welcome a test today.
H1 timeframe:
The picture from the H1 scale has the unit within a stone’s throw from $0.74. Technicians will acknowledge that although $0.74 attracts limited confluence on the H1, H4 has the 38.2% Fib retracement at $0.7408. With that being said, a whipsaw above the round number into the H4 base could come to fruition.
Out of the relative strength index (RSI), we can see the value hovering south of overbought territory, consequently calling attention to resistance at 78.26.
Observed levels:
A whipsaw above $0.74 into the H4 timeframe’s 38.2% Fib retracement at $0.7408 (an initial take-profit level derived from a H4 AB=CD formation) is a possible scenario on the table today. Not only will the move fill buy-stops north of $0.74 and fuel willing $0.7408 sellers, additional resistance comes in at $0.7453-0.7384 on the daily timeframe.
USD/JPY:
Monthly timeframe:
(Technical change on this timeframe is often limited, though serves as guidance to potential longer-term moves)
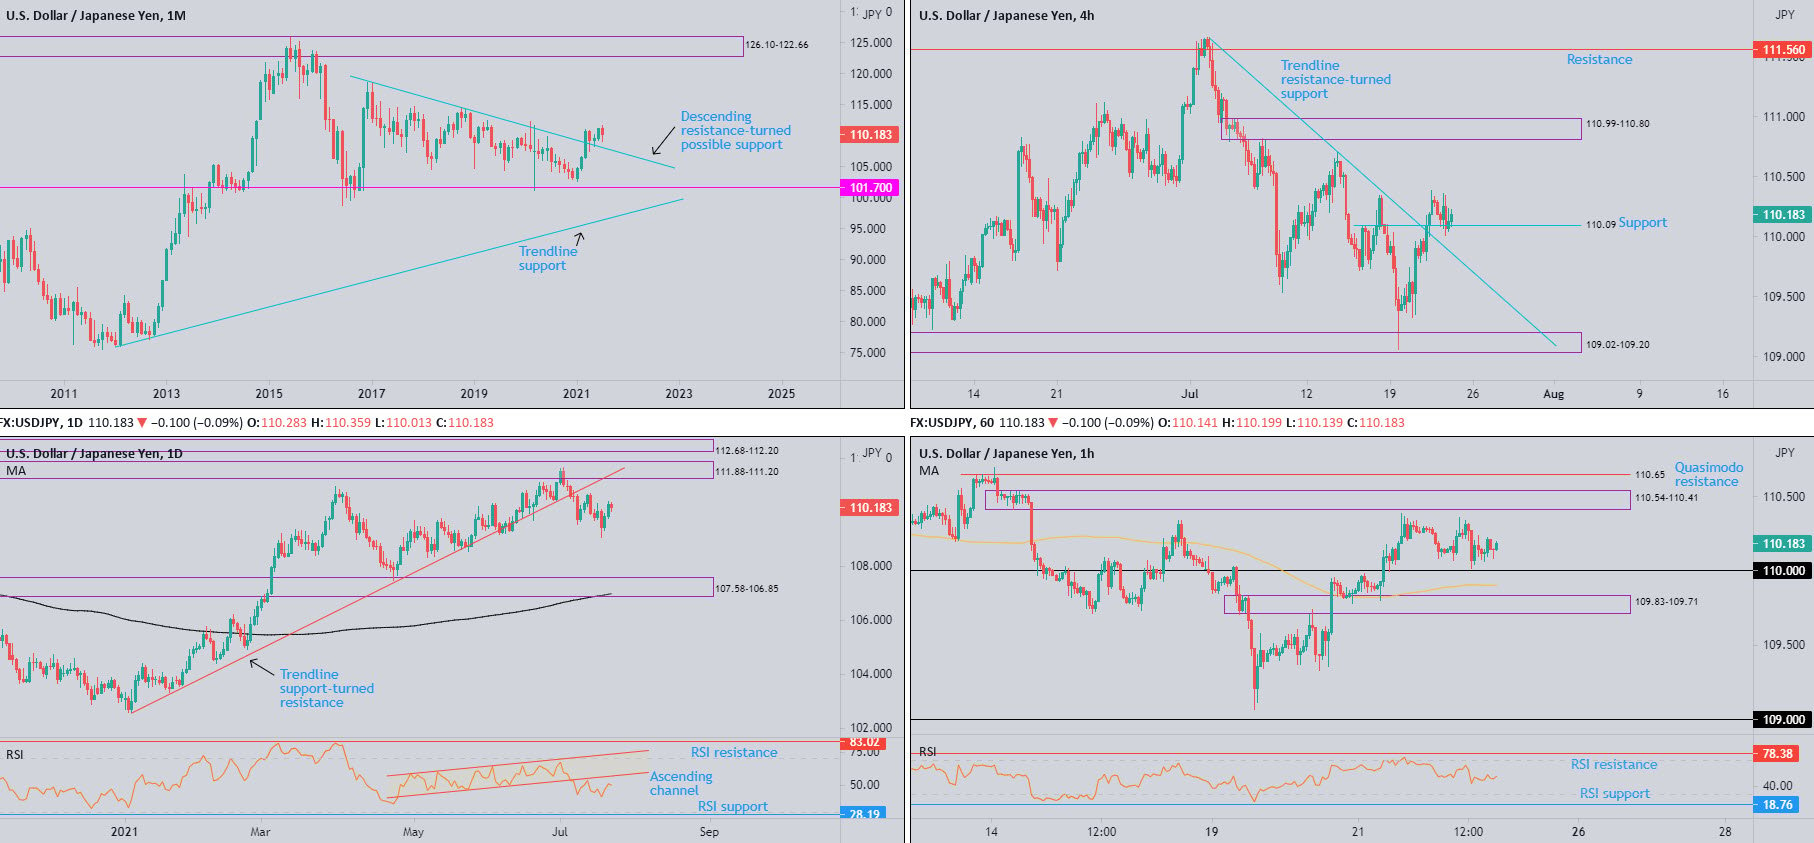
March concluded up by 3.9 percent and cut through descending resistance, etched from the high ¥118.66. Although April finished lower by 1.3 percent and snapped a three-month winning streak, May (+0.2 percent) held the breached descending resistance and echoed support in June, higher by 1.4 percent.
Month to date, however, July trades 0.9 percent in the red and is on track to chalk up a bearish outside reversal.
Daily timeframe:
Technical Structure Unchanged from Previous Analysis.
USD/JPY remains languishing south of trendline support-turned resistance, taken from the low 102.59. This follows the early breach on 7th July.
Having Tuesday and Wednesday forge two consecutive bullish sessions, resistance at ¥111.88-111.20 has been thrown back into the mix. To the downside, supply-turned demand at ¥107.58-106.85 calls for attention as an obvious floor in this market, which happens to align with the 200-day simple moving average at ¥106.99.
Trend studies, despite the trendline support breach early July, reveals the pair has been trending higher since the beginning of the year. With reference to the relative strength index (RSI), attention is on the lower side of a recently breached ascending channel between 58.82 and 47.51, following the indicator recently forming a 41.32 low.
H4 timeframe:
Latest events on the H4 show price marginally withdrew on Thursday and tested Quasimodo resistance-turned support at ¥110.09—organised above trendline resistance-turned support, drawn from the high ¥111.66 (2021 highs).
Pursuing higher prices features supply at ¥110.99-110.80, a base capping upside in early July.
H1 timeframe:
Short-term sentiment is somewhat neutral heading into Friday’s session, wavering between supply at ¥110.54-110.41 and ¥110. Outside of the aforesaid zones, Quasimodo resistance rests at ¥110.65 and supply-turned demand falls in at ¥109.83-109.71. Note also we are comfortable above the 100-period simple moving average around ¥109.90.
In regards to the relative strength index (RSI), the indicator’s value has been circling the 50.00 centreline since US opened its doors yesterday. Oversold support at 18.76 remains on the radar and resistance can be seen at 78.38.
Observed levels:
The test of H4 Quasimodo resistance-turned support at ¥110.09 is likely to interest traders, knowing trendline resistance gave way earlier in the week. What this may also trigger is a test of ¥110 on the H1 to draw in additional buyers (with the possibility of a whipsaw forming to the 100-period simple moving average at ¥109.90 or supply-turned demand at ¥109.83-109.71).
The above takes support from the daily timeframe exhibiting scope to approach resistance at ¥111.88-111.20.
GBP/USD:
Monthly timeframe:
(Technical change on this timeframe is often limited, though serves as guidance to potential longer-term moves)
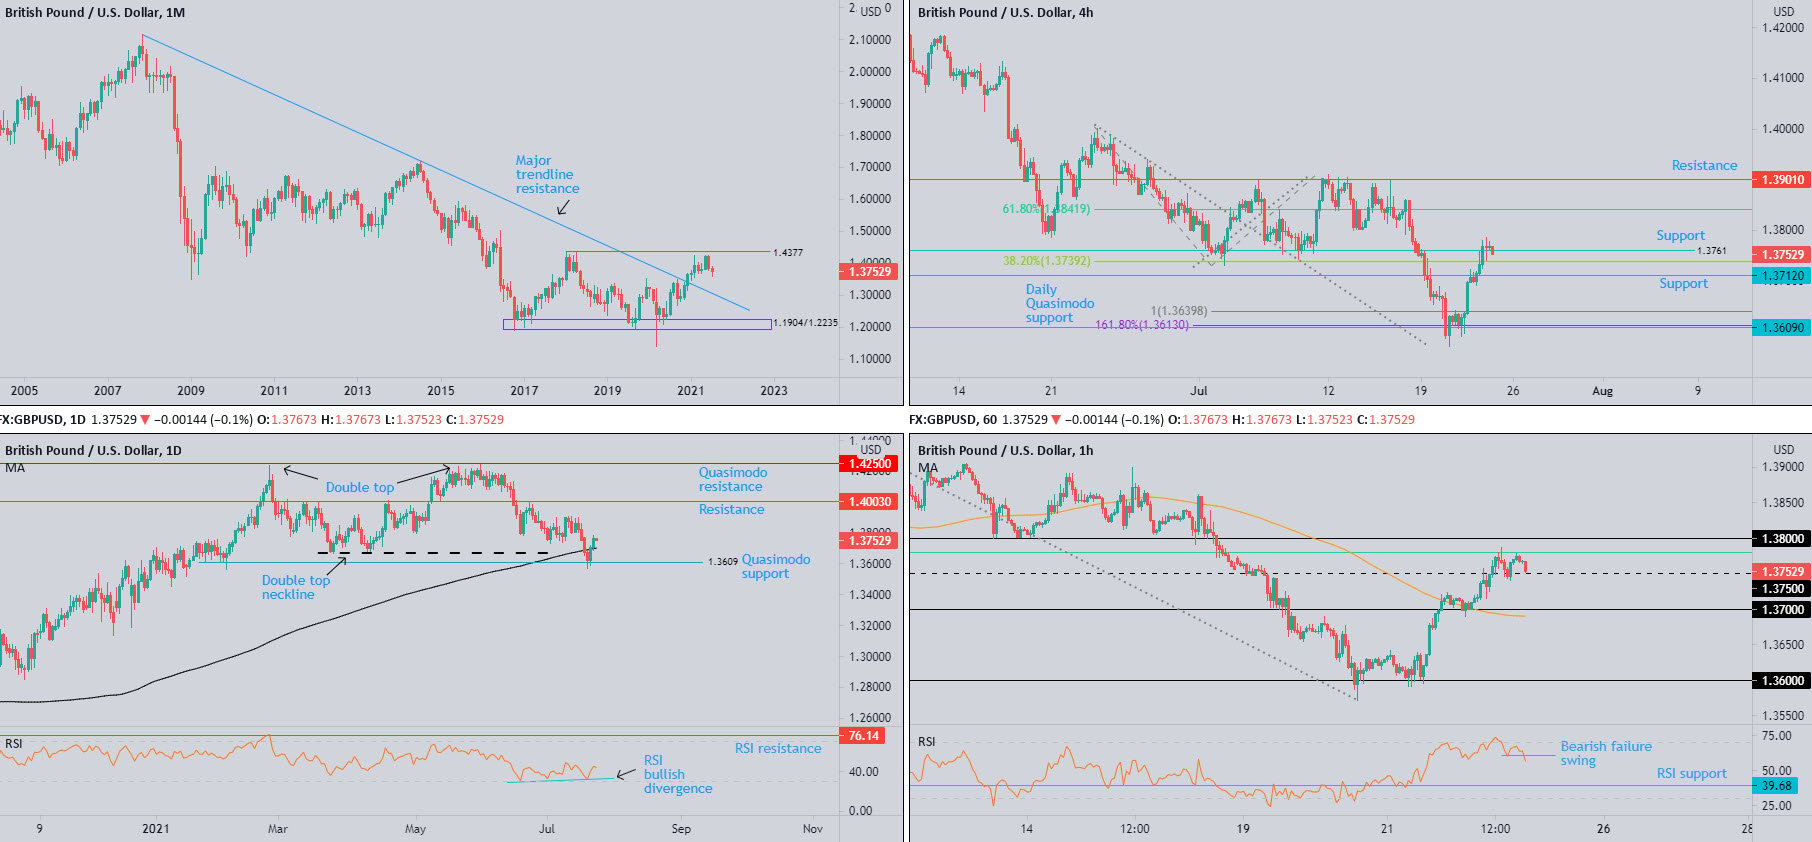
Since February, GBP/USD has echoed an indecisive environment south of $1.4377: April high 2018. This follows December’s (2020) trendline resistance breach, taken from the high $2.1161, possibly serving as support if retested.
Month to date, July trades 0.5 percent lower.
Primary trend structure has faced lower since early 2008, unbroken (as of current price) until $1.4377 gives way.
Daily timeframe:
Technical Structure Unchanged from Previous Analysis.
Quasimodo support at $1.3609 welcoming buyers Wednesday triggered additional bullish flow Thursday and cemented position north of the 200-period simple moving average at $1.3699. Additional interest to the upside shines light on tops around $1.3909, followed by resistance at $1.4003.
Technicians may note the daily scale recently elbowed under a double-top neckline at $1.3670 (double top formed between 24th Feb high at $1.4241 and June 1st high at $1.4250).
Trend on this chart has been somewhat rangebound since late February. As for momentum studies, the relative strength index (RSI) pencilled in bullish divergence, informing traders of strengthening momentum.
H4 timeframe:
Thursday’s almost one-sided advance overthrew a number of key resistances, including the 38.2% Fib retracement value at $1.3739, derived from legs A-D of the AB=CD harmonic formation (100% Fib projection at $1.3640 and 1.618% Fib extension at $1.3613).
With $1.3739 in the rear-view mirror and price attempting to secure support off a recently engulfed resistance at $1.3761, the 61.8% Fib retracement value at $1.1842 is in the line of fire: the second take-profit target out of the AB=CD pattern, followed by obvious resistance at $1.3901.
H1 timeframe:
Early hours Thursday watched short-term flow retest $1.37—accompanied by the 100-period simple moving average—and subsequently challenge the lower side of $1.3750 heading into the London open, which eventually gave way.
US trading retested $1.3750 and held support, following a test of the 61.8% Fib retracement value at $1.3780 (green). $1.38, therefore, demands attention on this timeframe.
In terms of where we stand on the relative strength index (RSI), the value exited overbought amid US hours yesterday and recently shaped a bearish failure swing (blue line at 60.89). Independent of price action, a bearish failure swing warns of a possible change in momentum, which in this case is to the downside.
Observed levels:
With all four charts taken into account, it appears buyers have an edge. Establishing support from $1.3750 on the H1, therefore, could be a scene that materialises, targeting at least $1.38, and possibly the 61.8% Fib retracement value at $1.1842 on the H4 scale.
DISCLAIMER:
The information contained in this material is intended for general advice only. It does not take into account your investment objectives, financial situation or particular needs. FP Markets has made every effort to ensure the accuracy of the information as at the date of publication. FP Markets does not give any warranty or representation as to the material. Examples included in this material are for illustrative purposes only. To the extent permitted by law, FP Markets and its employees shall not be liable for any loss or damage arising in any way (including by way of negligence) from or in connection with any information provided in or omitted from this material. Features of the FP Markets products including applicable fees and charges are outlined in the Product Disclosure Statements available from FP Markets website, www.fpmarkets.com and should be considered before deciding to deal in those products. Derivatives can be risky; losses can exceed your initial payment. FP Markets recommends that you seek independent advice. First Prudential Markets Pty Ltd trading as FP Markets ABN 16 112 600 281, Australian Financial Services License Number 286354.


 Access +10,000 financial
instruments
Access +10,000 financial
instruments