
EUR/USD:
Monthly timeframe:
(Technical change on this timeframe is often limited though serves as guidance to potential longer-term moves)
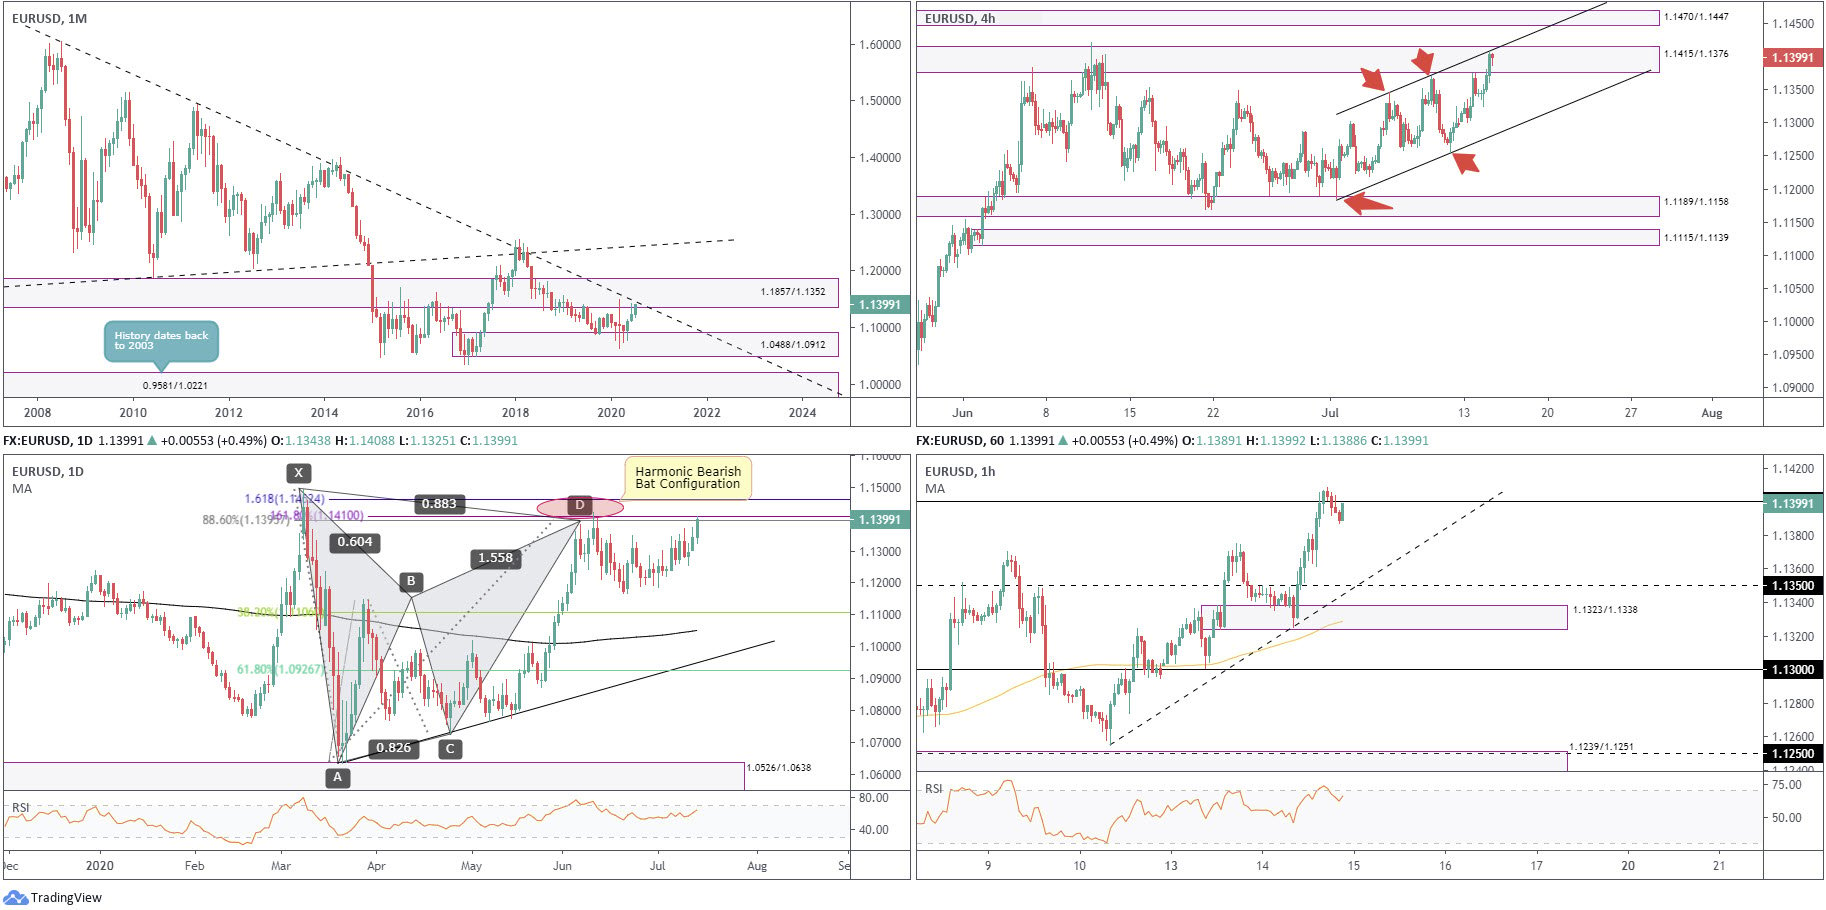
The month of May, as you can see, recovered off worst levels out of demand from 1.0488/1.0912 and closed firm. This prompted an extension in June to highs at 1.1422, adding 1.2%, despite running into opposition at the lower ledge of nearby supply from 1.1857/1.1352 (unites with long-term trendline resistance [1.6038]).
July is currently scouting the lower region of the aforesaid supply, closing in on the mentioned trendline resistance.
With reference to the primary trend, however, the pair has exhibited lower peaks and troughs since 2008.
Daily timeframe:
Partially altered from previous analysis –
The month of June observed EUR/USD address a potential reversal zone (PRZ), derived from a harmonic bearish bat pattern. The base is comprised of an 88.6% Fib level at 1.1395, a 161.8% BC projection at 1.1410 and a 161.8% Fib ext. level at 1.1462 (red oval).
It’s typical, in the case of bearish formations, to see traders sell PRZs and place protective stop-loss orders above the X point (1.1495). Common take-profit targets fall in at the 38.2% and 61.8% Fib levels (of legs A/D) at 1.1106 and 1.0926, respectively.
A mild bid has been observed since June 19 after reaching 1.1168, which, as you can see, recently gathered traction and retested the aforesaid PRZ.
H4 timeframe:
The H4 timeframe currently offers an ascending channel between 1.1185/1.1345, with price crossing paths with the upper limit yesterday as well as aligning supply at 1.1415/1.1376.
Above the current levels, technicians will note additional supply at 1.1470/1.1447.
H1 timeframe:
Euro bulls cheered another positive session Tuesday, elevated on DXY crossing under 96.50.
As you can see, H1 candles welcomed 1.14 into the fight and, having seen H4 candles test channel resistance/supply, shows signs of pressuring price action lower today. The next available support on the H1 falls in at trendline support (1.1254), and 1.1350 support.
Structures of Interest:
Monthly supply at 1.1857/1.1352, neighbouring long-term trendline resistance, the daily PRZ between 1.1462/1.1395 and H4 testing channel resistance/supply, puts forward a strong ceiling in this market.
The above, coupled with H1 closing back under 1.14, could signal a bearish play going forward.
AUD/USD:
Monthly timeframe:
(Technical change on this timeframe is often limited though serves as guidance to potential longer-term moves)
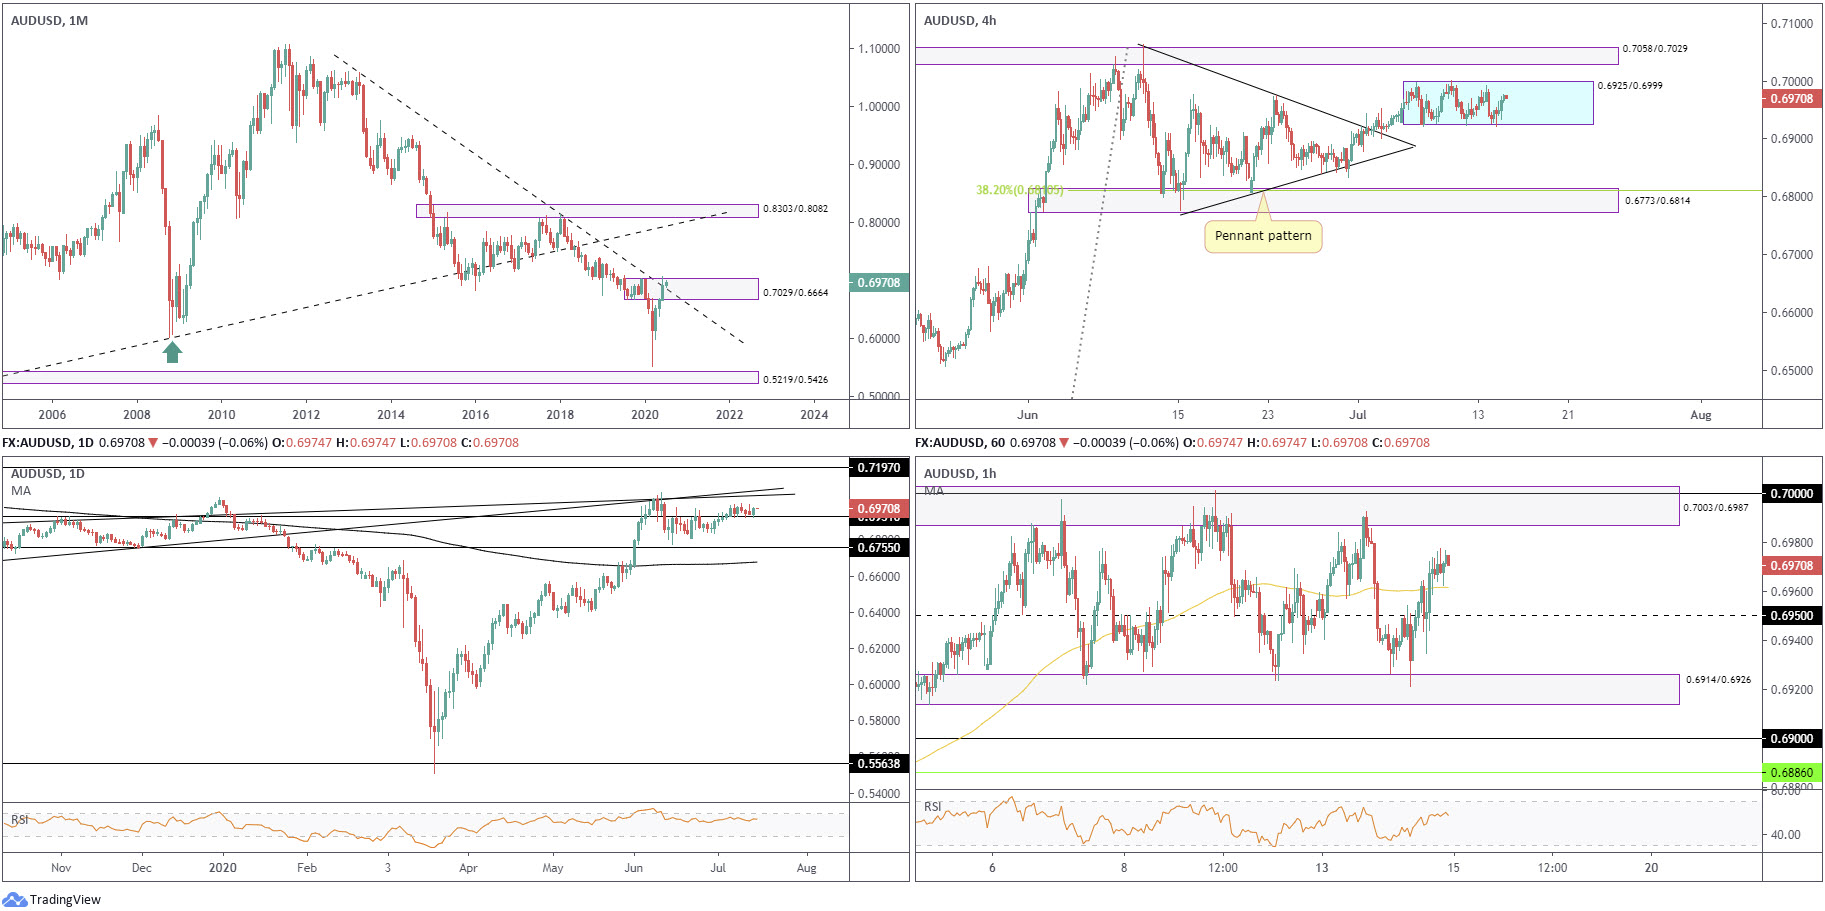
May’s extension, together with June’s follow-through, has supply at 0.7029/0.6664 echoing a vulnerable tone in July, particularly as intersecting long-term trendline resistance (1.0582) demonstrates signs of weakening.
Regarding the market’s primary trend, however, a series of lower lows and lower highs have been present since mid-2011.
Daily timeframe:
Brought forward from previous analysis –
AUD/USD ousted resistance at 0.6931 at the beginning of last week, with the latter now featured as support.
The break to the upside shifts focus towards two nearby trendline resistances (prior supports – 0.6744/0.6671); a violation here unmasks another resistance at 0.7197.
With respect to support under 0.6931, 0.6755 is on the radar, as well as the 200-day simple moving average, currently circulating the 0.6677 region.
H4 timeframe:
Brought forward from previous analysis –
Formed from June 10 to July 1, H4 established a (bullish) pennant pattern between 0.7064/0.6776, considered a continuation pattern among chart pattern enthusiasts. The breakout witnessed at the beginning of July unearthed a buy signal, though heading into mid-month price has entered a ranging phase (blue) between 0.6925/0.6999.
If we remain above 0.6931 on the daily timeframe, breaking above the aforesaid range is a possibility, bound for nearby supply at 0.7058/0.7029.
H1 timeframe:
Partially altered from previous analysis –
The H4 range underlined above at 0.6925/0.6999 is contained by supply at 0.7003/0.6987 (and 0.70), and demand from 0.6914/0.6926.
As such, these areas will continue to offer reversal trades as long as the aforesaid H4 range remains intact.
Structures of Interest:
Monthly price appears to be squeezing sellers out of the market, and daily buyers are seen holding things around support at 0.6931.
All the while daily price respects 0.6931, the lower edge of the current H4 range will continue to hold at 0.6925, bolstered by H1 demand at 0.6914/0.6926.
Ultimately, analysis indicates a break to the upside will eventually emerge, therefore longs out of H1 demand may interest some traders. H1 supply, although the area has held on numerous occasions, is positioned against higher timeframe direction which is likely to be a red flag for most price action traders.
USD/JPY:
Monthly timeframe:
(Technical change on this timeframe is often limited though serves as guidance to potential longer-term moves)
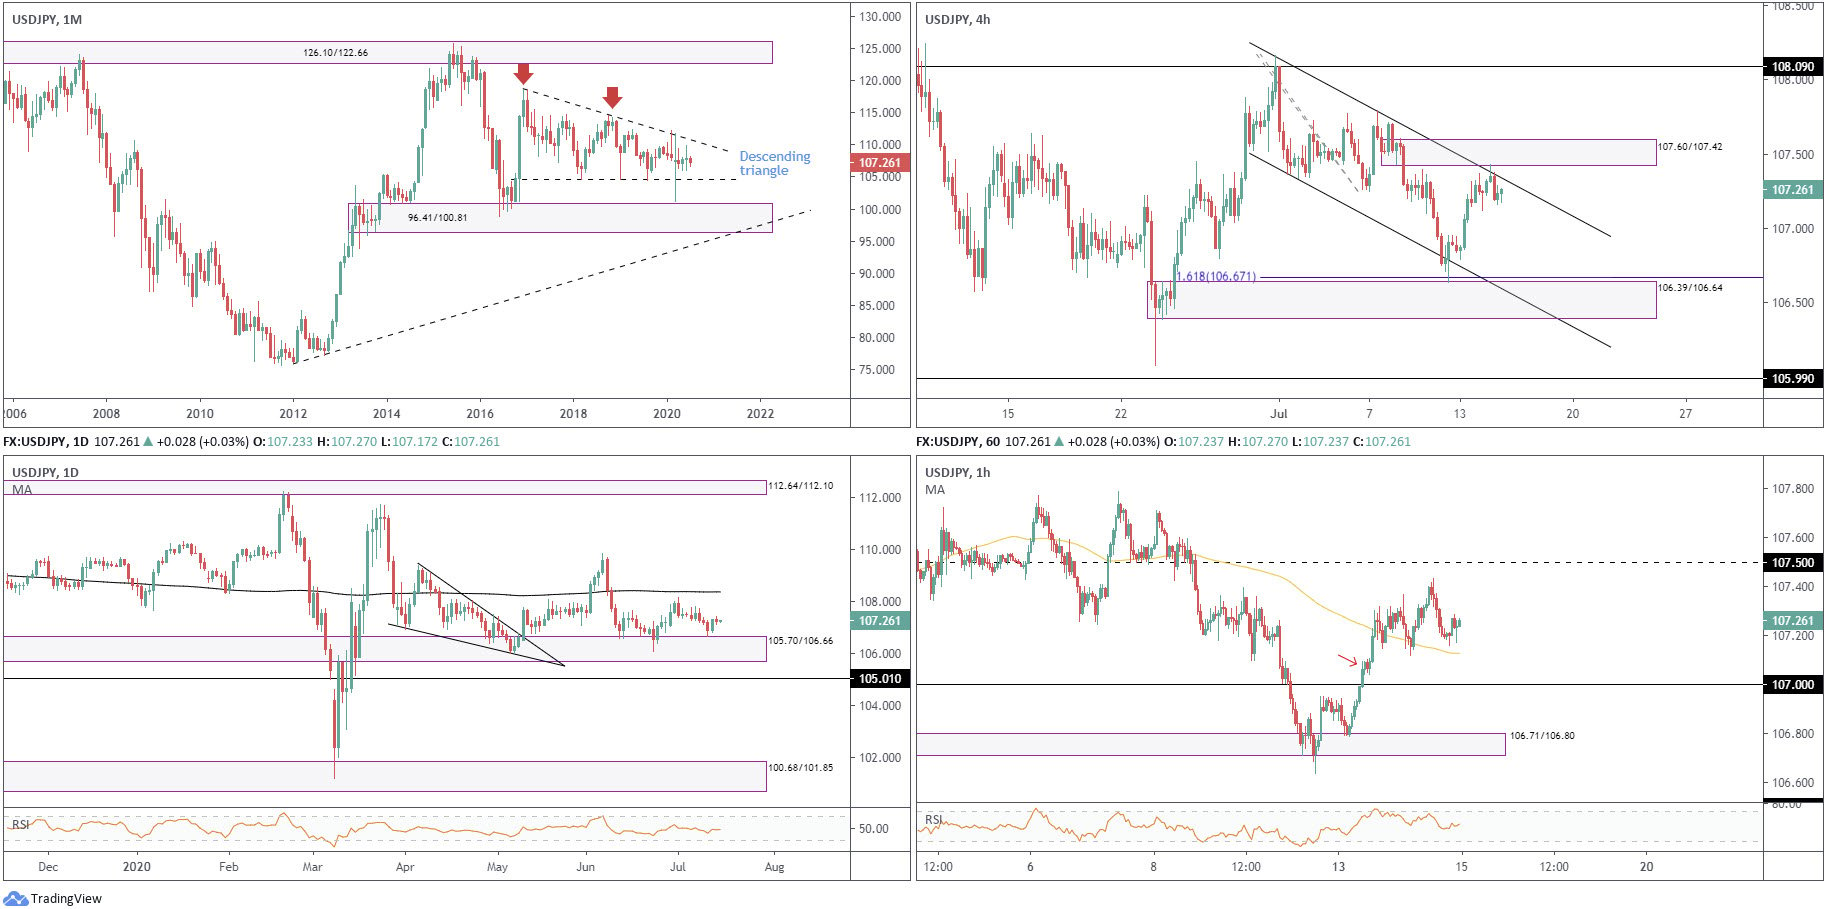
Since kicking off 2017, USD/JPY has been carving out a descending triangle pattern between 118.66/104.62.
April and May were pretty uneventful, with June also wrapping up indecisively in the shape of a neutral doji candlestick pattern.
Areas outside of the noted triangle can be seen at supply from 126.10/122.66 and demand coming in at 96.41/100.81.
Daily timeframe:
Partially altered from previous analysis –
Price action, as you can see, made its way back to demand at 105.70/106.66, an area favoured on Monday.
Assuming an extension to the upside, the 200-day simple moving average at 108.36 and the 108.16 high (July 1) are watched resistances.
H4 timeframe:
Tuesday observed a mild whipsaw occur through channel resistance (108.16), a move that brought in the lower ledge of supply at 107.60/107.42. What’s also technically appealing here is the whipsaw formed by way of a shooting star candlestick pattern, considered a bearish signal at peaks.
Demand at 106.39/106.64, joined closely with channel support (107.36) and a 161.8% Fib ext. level at 106.67, represents a logical target for any shorts. Breaking current supply, however, will likely lead us to peaks around 107.78.
H1 timeframe:
The 100-period simple moving average is proving its worth as support right now, circulating around the 107.12 neighbourhood.
Below, we have mild demand (red arrow) working the 107.09 area, with a break to 107 likely to be seen in the event of a pop lower. To the upside, 107.50 resistance remains valid.
Structures of Interest:
The monthly timeframe offers limited direction right now.
Daily demand at 105.70/106.66 recently re-joined the fight, placing buyers in a somewhat brighter light.
H4 fades channel resistance and supply at 107.60/107.42.
H1 holds off the 100-period simple moving average, with resistance set at 107.50 and support from 107.
On account of the above, daily buyers currently compete with H4 sellers at the moment, leaving H1 traders in a precarious situation. In cases such as this, where things are blurred, hitting the side lines (trading flat) may be the better position to explore.
GBP/USD:
Monthly timeframe:
(Technical change on this timeframe is often limited though serves as guidance to potential longer-term moves)
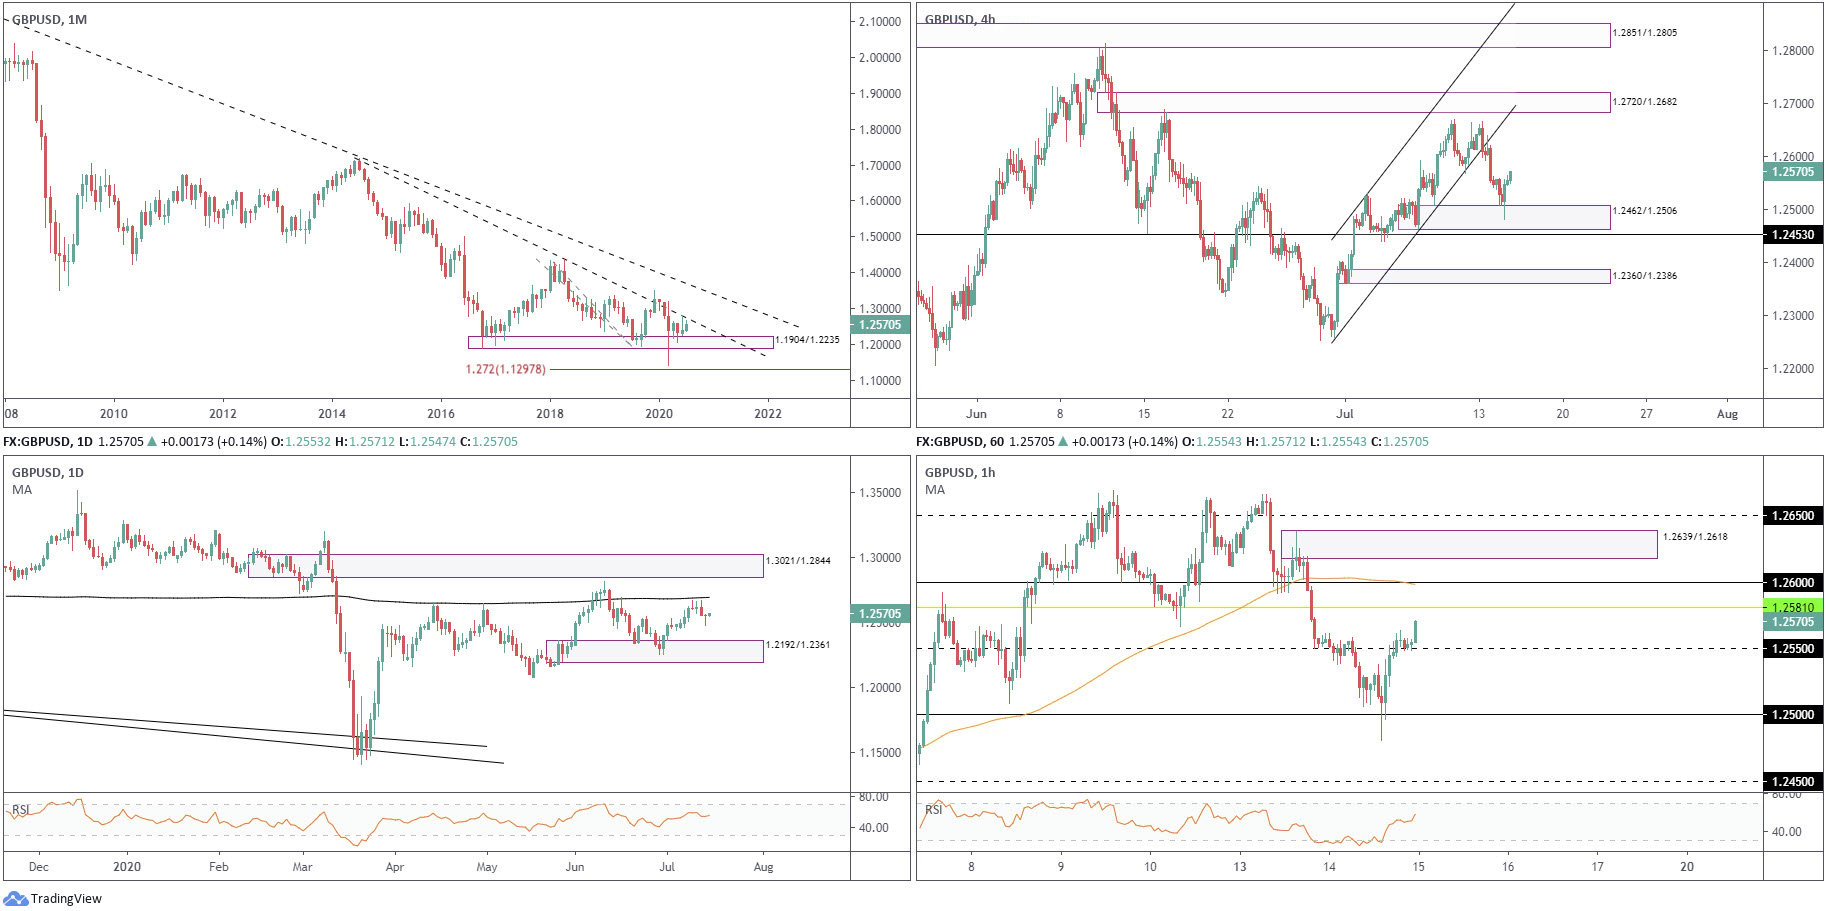
Support at 1.1904/1.2235 and long-term trendline resistance (1.7191) offers clear structure on the monthly timeframe, with the latter prompting a notable upper shadow in June.
Concerning the primary trend, lower peaks and troughs have decorated the monthly chart since early 2008, placing 1.1904/1.2235 support in a vulnerable position.
Daily timeframe:
Buyers and sellers recently clashed south of the 200-day simple moving average at 1.2692, with Monday coming forward and chalking up a bearish outside day. This was initially well received by sellers Tuesday, testing lows at 1.2479. Yet, later in the session, GBP/USD staged a notable recovery, reclaiming earlier losses and establishing a ‘dragonfly doji’, a bullish reversal candlestick pattern. Given the pattern has not formed off support, though, this may be insignificant.
Demand at 1.2192/1.2361 is still in view, as is supply from 1.3021/1.2844, situated above the aforesaid simple moving average.
H4 timeframe:
Leaving supply at 1.2720/1.2682 behind, traders observed Monday dethrone channel support (1.2257), retest the broken level as resistance, and drop to demand at 1.2462/1.2506 on Tuesday, standing just ahead of support at 1.2453.
Buyers, as you can see, established position off the aforesaid demand.
H1 timeframe:
Heading into US trade Tuesday, price connected with the 1.25 level, albeit piercing to lows at 1.2480. The rally from the round number proved decisive, ultimately toppling the 1.2550 region and throwing light on nearby resistance at 1.2581 and the 1.26 level which joins closely with the 100-period simple moving average. Interestingly, above 1.26 we can see supply resides close by at 1.2639/1.2618.
In addition, indicator-based traders will acknowledge the RSI value closing in on overbought territory.
Structures of Interest:
H1 resistance at 1.2581 may appeal this morning, though having 1.26 stationed above, this may act as a magnet to price
Another scenario worth highlighting is a possible whipsaw through 1.26 into H1 supply at 1.2639/1.2618. Although enough to potentially deliver a downside move, there is little higher timeframe confluence supporting the setup, therefore, 1.2581 could serve as support, if not the 1.2550 range is likely to cap downside.
DISCLAIMER:
The information contained in this material is intended for general advice only. It does not take into account your investment objectives, financial situation or particular needs. FP Markets has made every effort to ensure the accuracy of the information as at the date of publication. FP Markets does not give any warranty or representation as to the material. Examples included in this material are for illustrative purposes only. To the extent permitted by law, FP Markets and its employees shall not be liable for any loss or damage arising in any way (including by way of negligence) from or in connection with any information provided in or omitted from this material. Features of the FP Markets products including applicable fees and charges are outlined in the Product Disclosure Statements available from FP Markets website, www.fpmarkets.com and should be considered before deciding to deal in those products. Derivatives can be risky; losses can exceed your initial payment. FP Markets recommends that you seek independent advice. First Prudential Markets Pty Ltd trading as FP Markets ABN 16 112 600 281, Australian Financial Services License Number 286354.


 Access +10,000 financial
instruments
Access +10,000 financial
instruments