Charts: Trading View
(Italics: previous analysis due to limited price change)
EUR/USD:
Weekly timeframe:
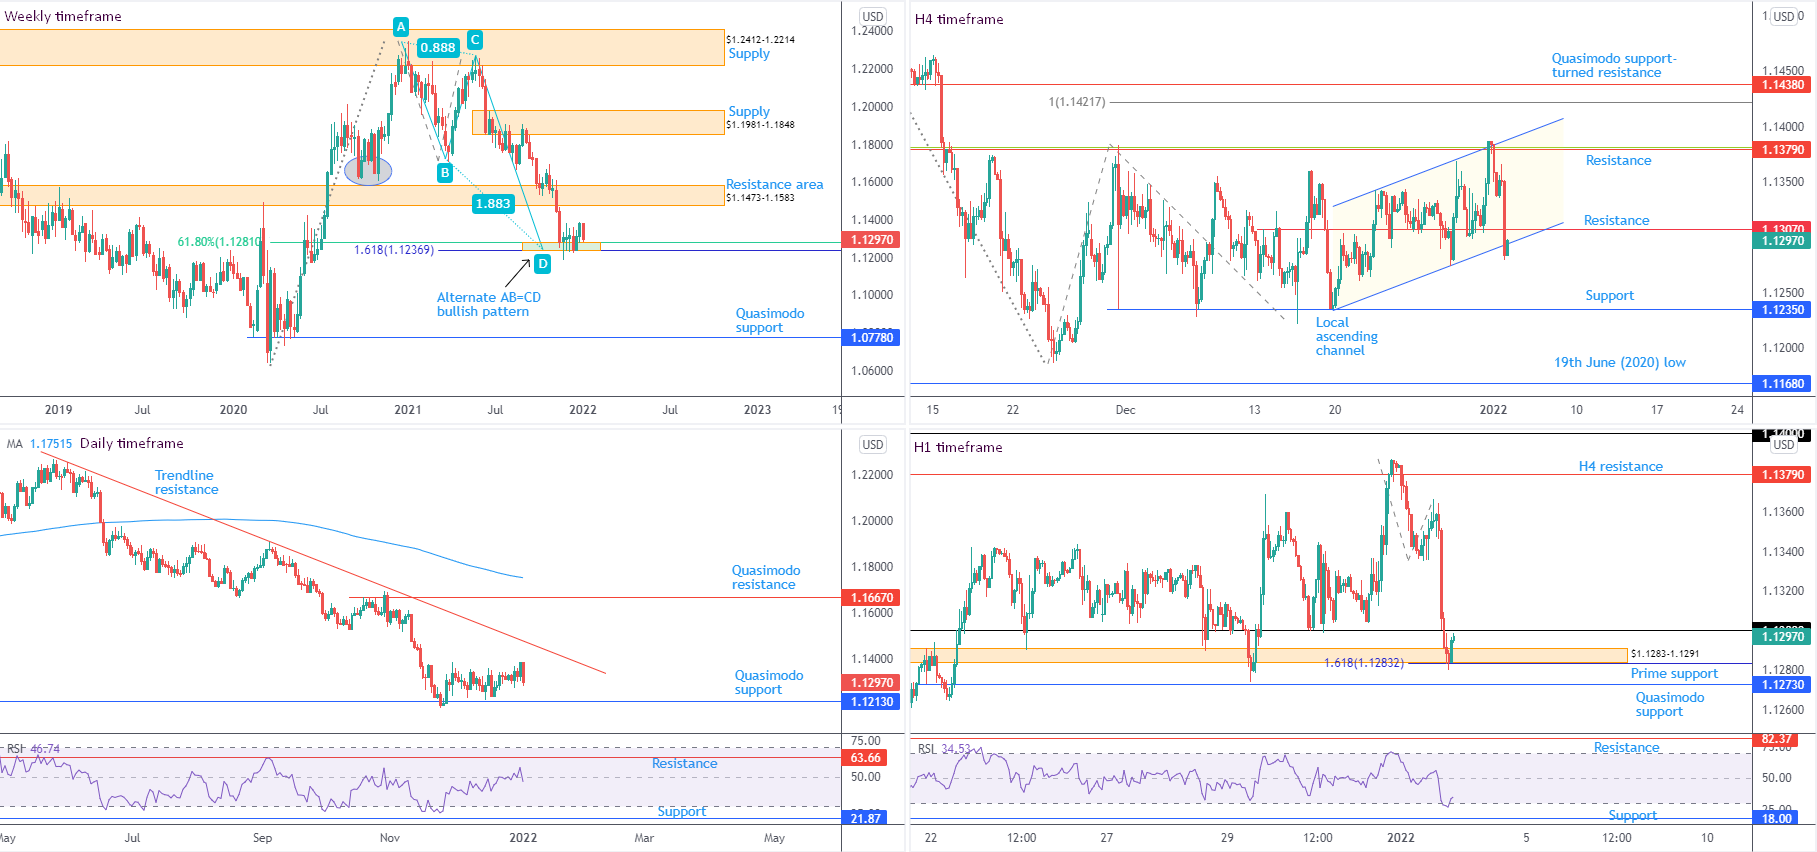
Since mid-November (2021), buyers and sellers have been squaring off around support at $1.1237-1.1281—made up of a 61.8% Fibonacci retracement at $1.1281 and a 1.618% Fibonacci projection from $1.1237. ‘Harmonic’ traders will acknowledge $1.1237 represents what’s known as an ‘alternate’ AB=CD formation.
Any upside derived from current support will likely be capped by resistance at $1.1473-1.1583; navigating lower, on the other hand, throws light on Quasimodo support as far south as $1.0778.
Interestingly, the pair took out 2nd November low (2020) at $1.1603 in late September (2021), suggesting the early stages of a downtrend on the weekly timeframe. This is reinforced by the monthly timeframe’s primary downtrend since mid-2008.
Daily timeframe:
Quasimodo support drawn from mid-June at $1.1213 (positioned beneath the weekly timeframe’s Fibonacci structure) made an entrance on 24th November (2021) and remains committed, despite a passionless attempt from bulls. A run higher casts light on trendline resistance, extended from the high $1.2254. Establishing a decisive close beneath $1.1213, however, exposes support on the daily timeframe at $1.0991 (not visible on the screen).
The relative strength index (RSI) whipsawed above the 50.00 centreline in recent movement. Note that this level has delivered resistance since mid-October (2021). Overthrowing the latter helps validate interest to the upside from current price support (shown through average gains exceeding average losses), yet defending 50.00 connotes a bearish picture, in line with the immediate downtrend (since May 2021).
H4 timeframe:
Europe’s shared currency was on the ropes against the US dollar Monday, influenced on the back of a USD bid (boosted by higher US Treasury yields) and technical selling.
Resistance at $1.1379—a level accompanied by a 38.2% Fibonacci retracement at $1.1381 and channel resistance (extended from the high $1,1342)—made an entrance early trade, with subsequent price movement navigating below support from $1.1307 and channel support, taken from the low $1.1235.
Downstream, the technical radar points to support at $1.1235, suggesting the unit may revisit breached supports and form resistance to tackle lower levels.
H1 timeframe:
One-sided selling emerged heading into US hours, unlocking a $1.32 breach to prime support at $1.1283-1.1291, alongside a 1.618% Fibonacci projection at $1.1283.
Breaking $1.32 bids and tripping sell-stop flow, along with price establishing support from the aforementioned prime support and Fibonacci ratio, gives rise to a possible stop-run scenario. This tends to bring about heavy buying (bids welcoming selling derived from sell-stops). A close back above $1.32 will help validate this concept.
Technicians will note the currency pair also registered oversold conditions, according to the relative strength index (RSI).
Observed Technical Levels:
Short term, H1 bulls are likely to react to a close back above $1.32. The caveat, of course, is H4 resistance stationed at $1.1307 could hinder bullish efforts. With this being the case, technical traders might wait and see if price holds $1.32 as support before committing.
AUD/USD:
Weekly timeframe:
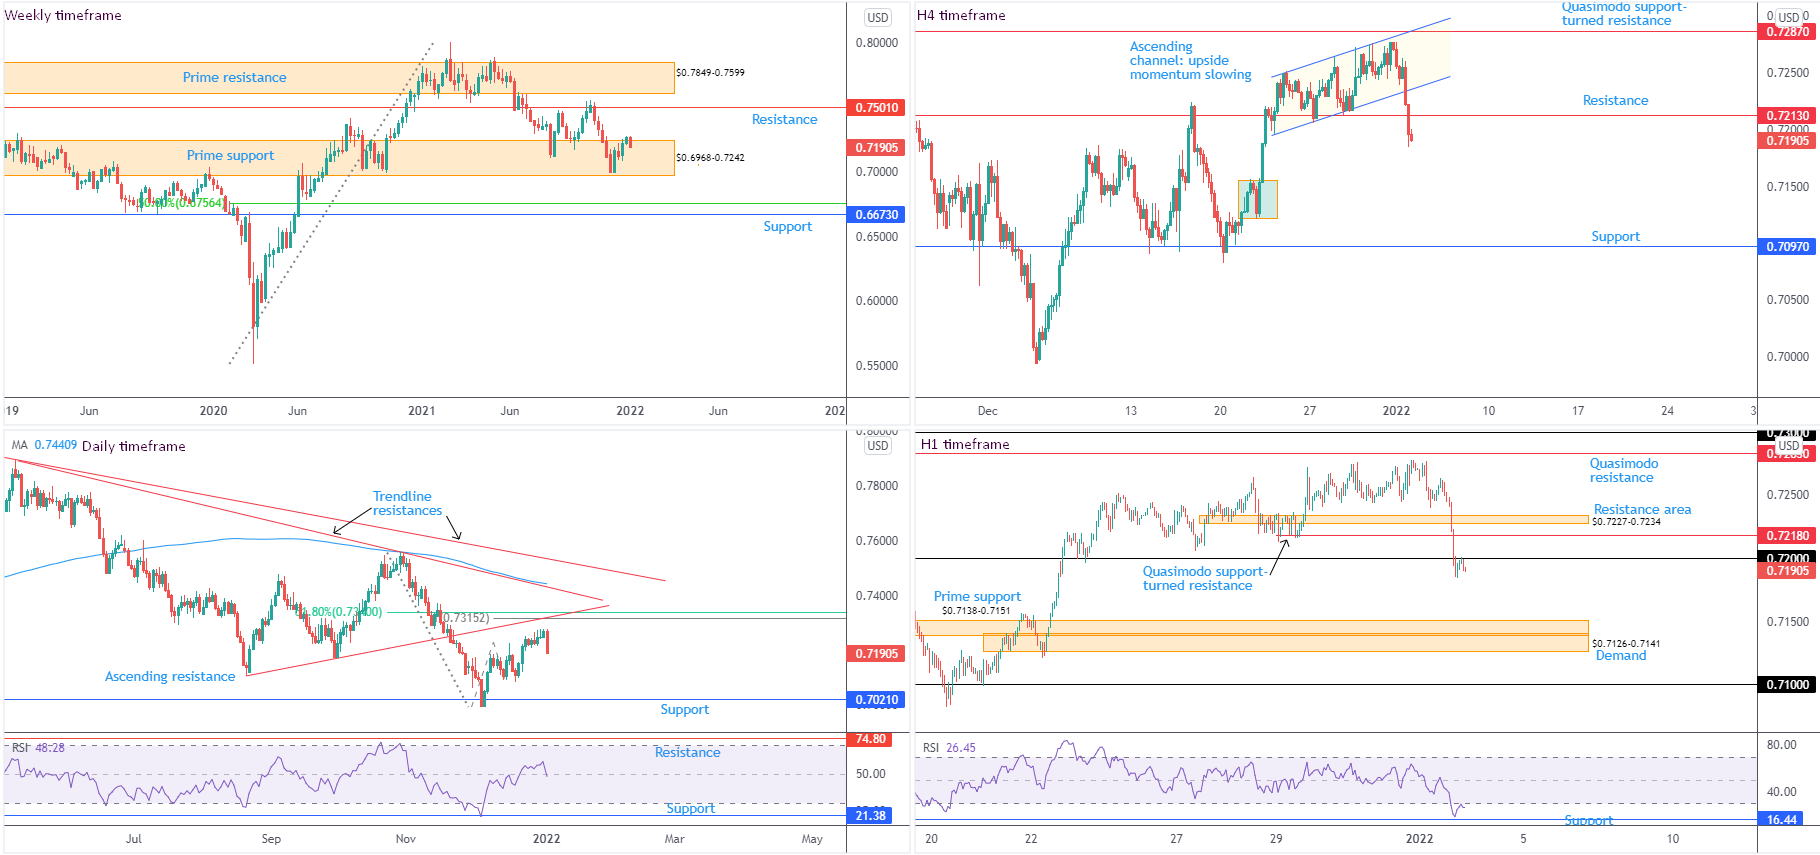
Bulls embraced a modest offensive phase deep within prime support at $0.6968-0.7242, with resistance to target at $0.7501. Manoeuvring beneath $0.6968-0.7242 reveals support at $0.6673 and a 50.0% retracement at $0.6756.
Trend on the weekly timeframe has been higher since pandemic lows of $0.5506 (March 2020); however, the monthly timeframe has been entrenched within a large-scale downtrend since mid-2011.
Daily timeframe:
AUD/USD shorts surfaced on Monday, producing a near-full-bodied bearish candle ahead of resistance (made up of a 61.8% Fibonacci retracement at $0.7340, a 100% Fibonacci projection at $0.7315 and an ascending resistance, drawn from the low $0.7106).
North of the aforesaid resistances, two trendline resistances are seen (taken from highs $0.8007 and $0.7891). Continuation selling, however, shifts attention to support at $0.7021.
Momentum studies show the relative strength index (RSI) has, at the time of writing, failed to find a reception above the 50.00 centreline. Holding south of the latter emphasises a bearish setting (average losses exceeding average gains: negative momentum).
H4 timeframe:
Following a phase of slowing momentum—demonstrated by way of an ascending channel, drawn from $0.7196 and $0.7252—Aussie shorts (alongside other G10 FX currencies) governed control on Monday as the US dollar index (DXY) commanded attention from daily support at 95.86.
The breach of support at $0.7213 deserves attention (now marked as resistance), potentially setting the technical stage for further selling to as far south as support at $0.7097. Demand also resides around $0.7121-0.7166.
H1 timeframe:
In conjunction with the H4 timeframe’s support breach at $0.7213, shorter-term flow on the H1 timeframe elbowed under $0.72 and, in recent hours, retested the lower side of the level as resistance.
Additional downside from current price has demand at $0.7126-0.7141 and prime support at $0.7138-0.7151 to target (areas sitting within the walls of H4 demand mentioned above at $0.7121-0.7166).
The relative strength index (RSI) is currently set within oversold surroundings, a touch ahead of indicator support from 16.44.
Observed Technical Levels:
Based on H4 and H1 analysis, sellers appear to have the upper hand.
H4 support from $0.7213 giving way and H1 retesting the lower side of $0.72 echoes a short-term bearish theme, targeting H1 prime support at $0.7138-0.7151.
USD/JPY:
Weekly timeframe:
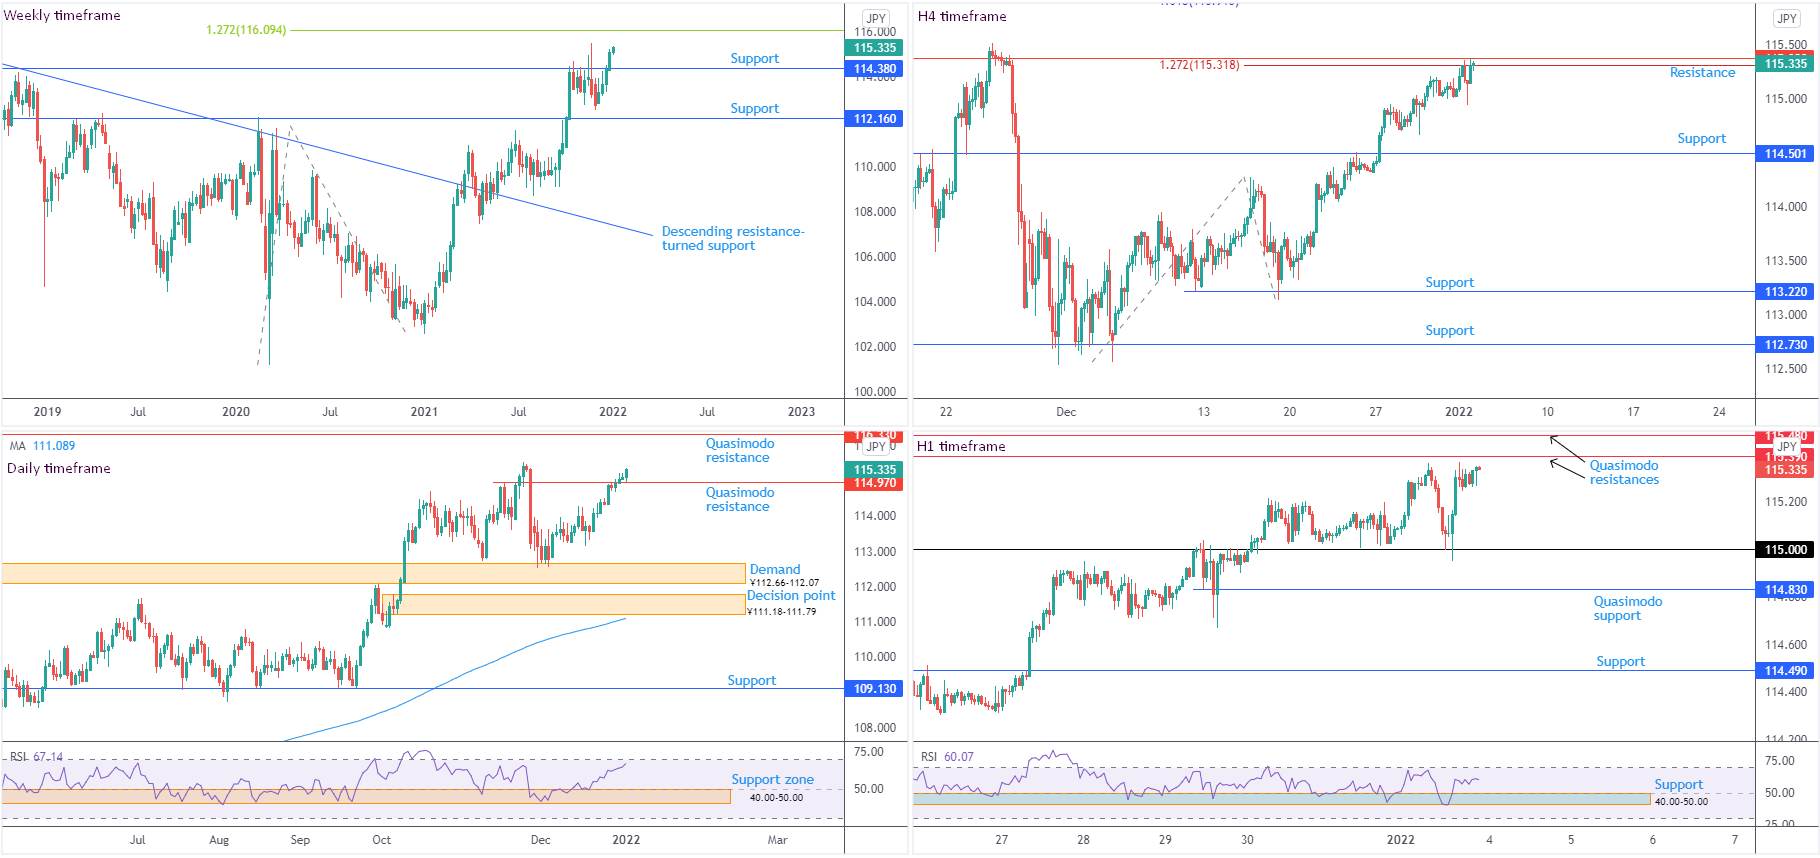
Heading into the close of 2021, USD/JPY action voyaged north of resistance from ¥114.38, a level capping upside since early 2017. A 1.272% Fibonacci projection from ¥116.09 is nearby, should buyers maintain position.
In terms of trend, the unit has been advancing since the beginning of 2021, welcoming a descending resistance breach, drawn from the high ¥118.61.
Daily timeframe:
Quasimodo resistance at ¥114.97 recently came under fire; Monday stood firm above the level, threatening to take on 2021 peaks at ¥115.52 and reach for Quasimodo resistance at ¥116.33.
RSI (relative strength index) analysis shows the value rebounded from support between 40.00 and 50.00 (indicator support often forms around the 50.00 area amid prolonged uptrends and operates as a ‘temporary’ oversold base) and is within striking distance of overbought territory.
H4 timeframe:
Since 17th December, USD/JPY has remained firmly to the upside with sellers demonstrating little interest. Following the break of resistance at ¥114.50 (now marked as support), Monday touched gloves with resistance at ¥115.38 and a 1.272% Fibonacci projection from $115.32.
Beyond here, the 1.618% Fibonacci projection is in view at ¥115.91, followed by Quasimodo resistance at ¥116.35 (not visible on the screen).
H1 timeframe:
As evident from the H1 scale, ¥115 welcomed a retest going into US hours on Monday. North of current price, two Quasimodo resistances are seen at ¥115.48 and ¥115.39, whereas beneath ¥115, Quasimodo support is visible at ¥114.83.
The relative strength index (RSI) continues to respect support between 40.00 and 50.00. Experienced technicians will view this area as a ‘temporary’ oversold base, due to the prolonged up move in December. Monday’s rebound from oversold support, as you can see, places the indicator within reach of overbought levels.
Observed Technical Levels:
The higher timeframe cleared of resistance indicates further upside could be on the menu. H4 resistance from ¥115.38 and a 1.272% Fibonacci projection from $115.32, therefore, may be taken out, alongside H1 Quasimodo resistances from ¥115.48 and ¥115.39.
DISCLAIMER:
The information contained in this material is intended for general advice only. It does not take into account your investment objectives, financial situation or particular needs. FP Markets has made every effort to ensure the accuracy of the information as at the date of publication. FP Markets does not give any warranty or representation as to the material. Examples included in this material are for illustrative purposes only. To the extent permitted by law, FP Markets and its employees shall not be liable for any loss or damage arising in any way (including by way of negligence) from or in connection with any information provided in or omitted from this material. Features of the FP Markets products including applicable fees and charges are outlined in the Product Disclosure Statements available from FP Markets website, www.fpmarkets.com and should be considered before deciding to deal in those products. Derivatives can be risky; losses can exceed your initial payment. FP Markets recommends that you seek independent advice. First Prudential Markets Pty Ltd trading as FP Markets ABN 16 112 600 281, Australian Financial Services License Number 286354.


 Access +10,000 financial
instruments

