
Charts: Trading View
(Italics: Previous Analysis Due to Limited Price Change)
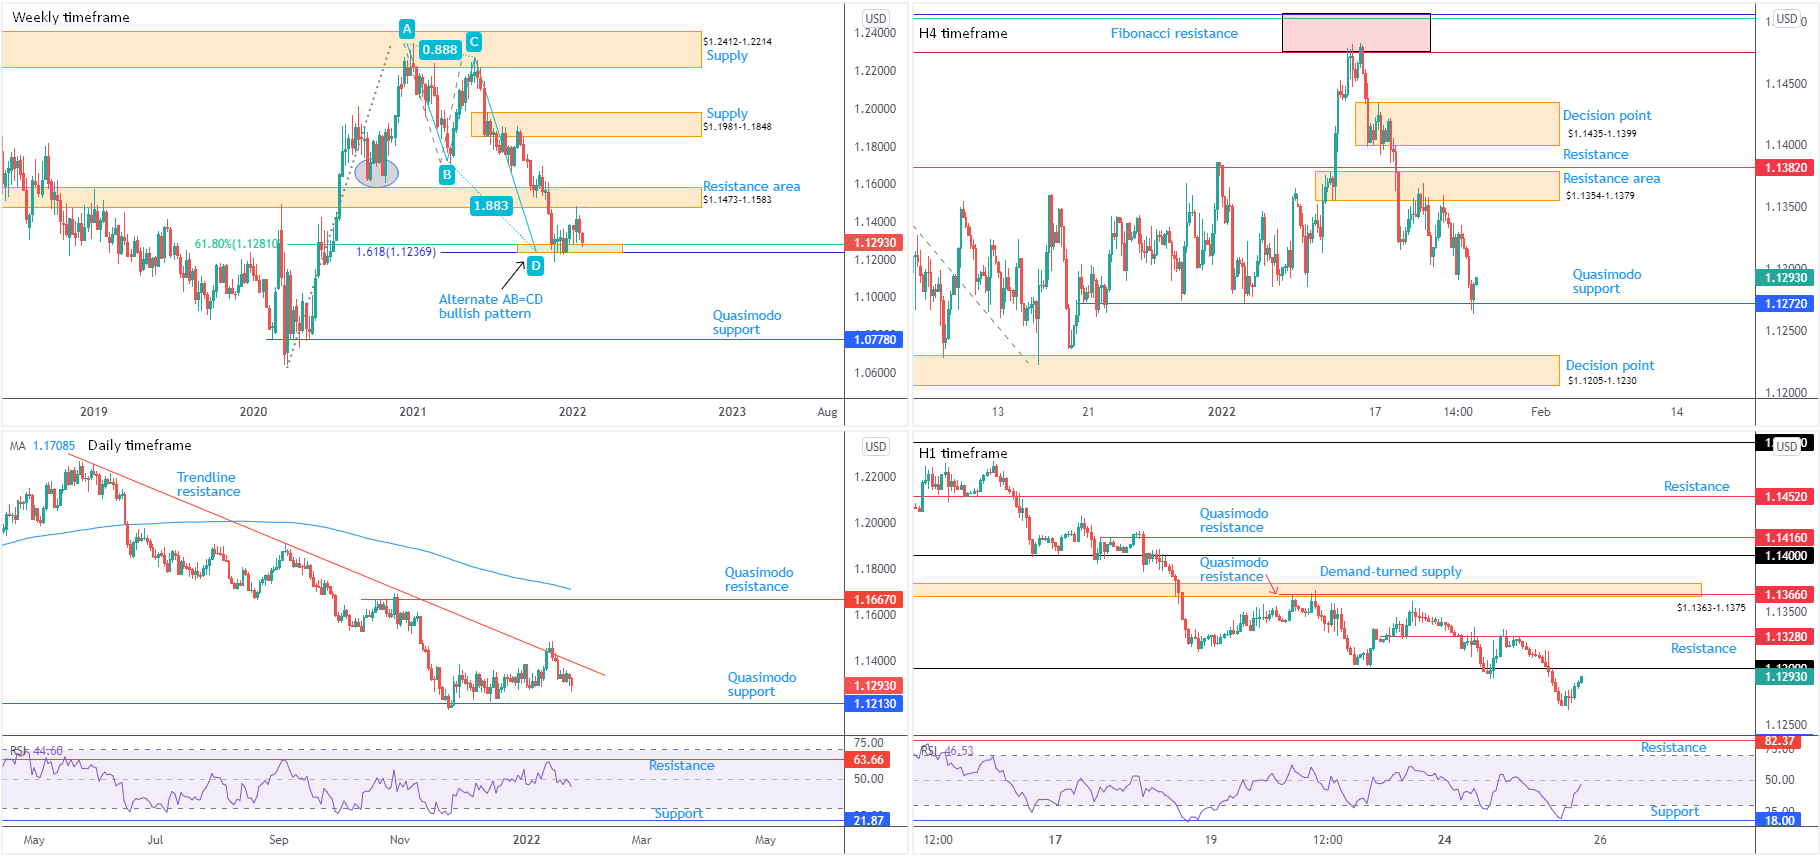
EUR/USD:
Weekly timeframe:
Fibonacci support at $1.1237-1.1281, made up of a 61.8% Fibonacci retracement at $1.1281 and a 1.618% Fibonacci projection from $1.1237, is now back in the frame. This follows a decisive rejection from long-standing resistance at $1.1473-1.1583 (active S/R since late 2017).
Note that current support delivered a floor heading into the close of 2021. ‘Harmonic’ traders will acknowledge $1.1237 represents what’s known as an ‘alternate’ AB=CD formation (extended D leg).
Strengthening the aforementioned resistance area’s presence is the currency pair taking out 2nd November low (2020) at $1.1603 in late September (2021), suggesting a downtrend on the weekly timeframe. This is reinforced by the monthly timeframe’s long-term (some would say ‘primary’) downtrend since mid-2008.
Daily timeframe:
A closer reading of price action on the daily chart shows that the lower edge of weekly resistance at $1.1473-1.1583 was aided by a 7-month trendline resistance on the daily timeframe, extended from the high $1.2254.
Tipped to extend Tuesday’s downside and slip further south of trendline resistance, Quasimodo support offers an obvious target at $1.1213.
According to the relative strength index (RSI), the indicator elbowed under the 50.00 centreline. Voyaging under the latter underpins the bearish narrative on this scale, informing traders that average losses exceed average gains: negative momentum.
H4 timeframe:
Resistance at $1.1354-1.1379—a prior decision point positioned a handful of pips beneath resistance at $1.1382—proved a resilient ceiling, withstanding two upside attempts. Subsequent price action on Tuesday shook hands with Quasimodo support from $1.1272 and, as you can see, formed a modest floor. Journeying beneath $1.1272 has the $1.1205-1.1230 decision point to target.
Technically interesting is the Quasimodo support joins forces with the upper boundary of weekly support at $1.1281.
H1 timeframe:
Aided by the weekly and H4 timeframe’s support ($1.1281-$1.1272), H1 bottomed heading into US hours on Tuesday and is poised to cross swords with the lower side of $1.13. Technicians will note the relative strength index (RSI) also bottomed within oversold space ahead of indicator support at 18.00.
A $1.13 retest appears as though it will be accompanied by a 50.00 centreline retest on the RSI. While above the psychological figure resides ‘local’ resistance at $1.1328 and demand-turned supply at $1.1363-1.1375.
Observed Technical Levels:
A retest of $1.13 is unlikely to deliver much in the way of resistance, knowing weekly and H4 price connected with supportive structure ($1.1281-$1.1272). With that being said, a H1 close above $1.13 may be viewed as a bullish signal to take on H1 resistance at $1.1328 and possibly reach for demand-turned supply at $1.1363-1.1375.
A run back above $1.13 may also be fuelled on the back of sell-stops located beneath the big figure as heavy higher timeframe bids welcome the liquidity.
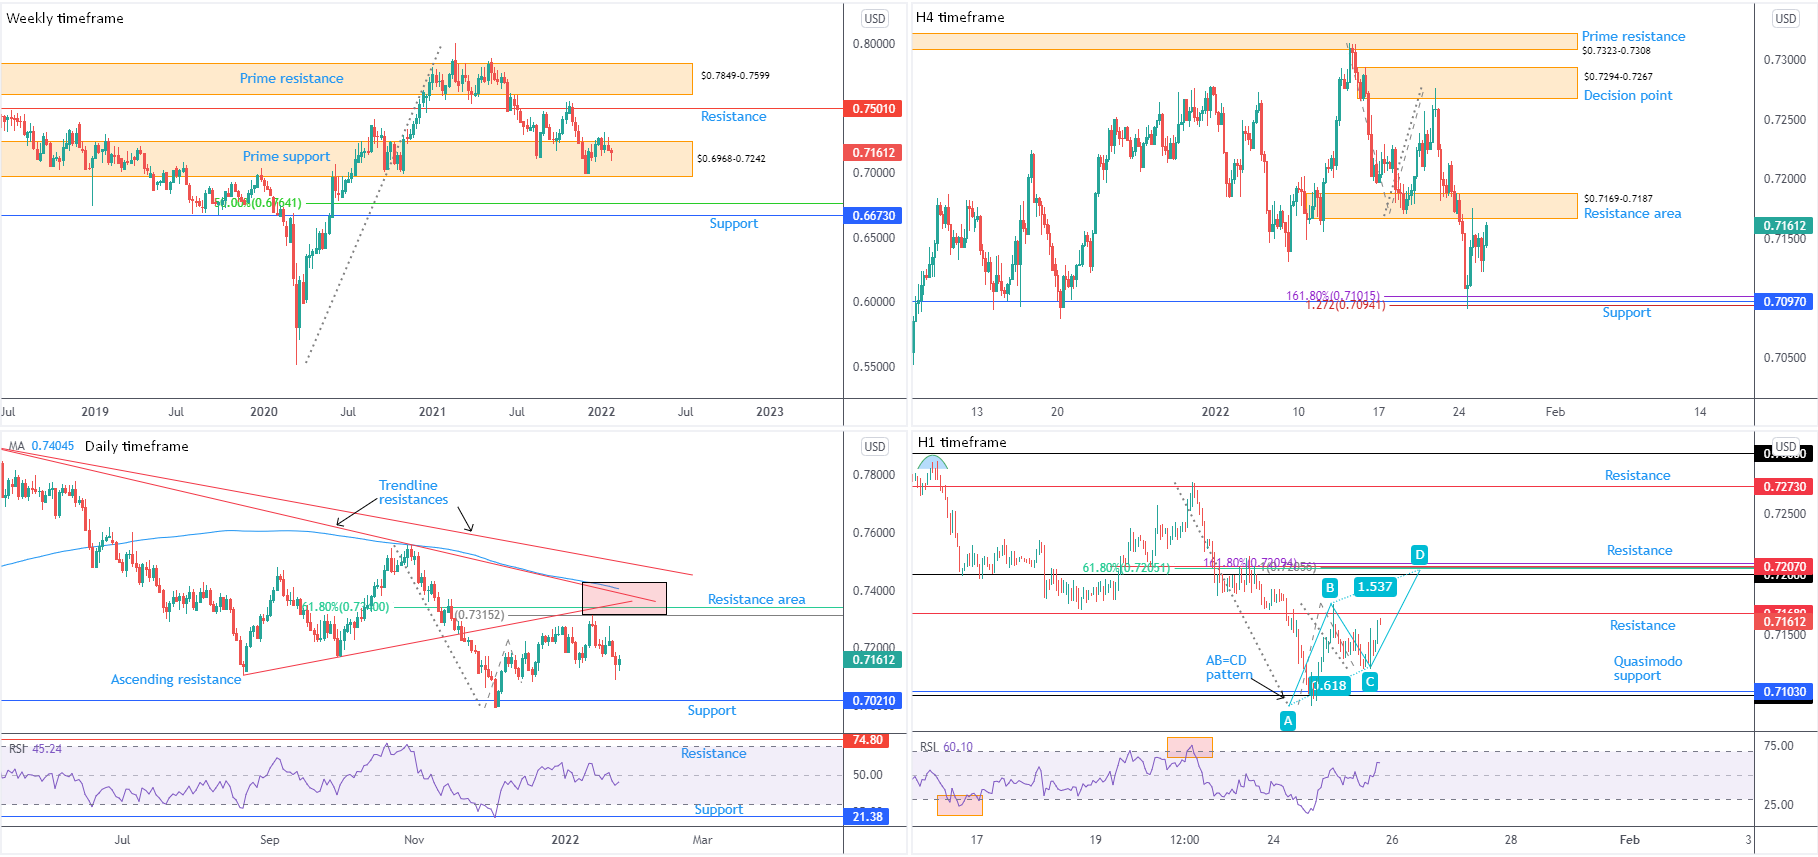
AUD/USD:
Weekly timeframe:
Prime support at $0.6968-0.7242 continues to play a crucial role on the weekly timeframe. Bulls, as you can see, embraced a modestly bullish stance into the close of 2021. 2022, on the other hand, has been relatively undecided so far. Should buyers press higher, resistance is at $0.7501. Manoeuvring beneath $0.6968-0.7242 reveals support at $0.6673 and a 50.0% retracement at $0.6764.
Since mid-Feb tops at $0.8007 (2021), sellers have taken the wheel. This followed a bullish period since pandemic lows of $0.5506 (March 2020), therefore some technical analysts may view this correction into prime support as a dip-buying opportunity. However, it is important to note that the monthly timeframe has been entrenched within a large-scale downtrend from mid-2011.
Daily timeframe:
Following last Thursday leaving behind a shooting star candle formation (typically considered a bearish arrangement) a touch under resistance between $0.7404 (the 200-day simple moving average) and $0.7315 (a 100% Fibonacci projection), AUD/USD weakness touched a low of $0.7091 on Monday.
Aside from the $0.7082 low (20th December [2021]) nearby, obvious support at $0.7021 calls for attention.
Meanwhile, the relative strength index (RSI) ended Tuesday marginally beneath the 50.00 centreline, underlining negative momentum on this timeframe.
H4 timeframe:
Addressing support at $0.7097, a level complemented by a 1.618% Fibonacci extension at $0.7102 and a 1.272% Fibonacci projection at $0.7094, the level proved its worth Monday and elevated price to resistance at $0.7169-0.7187. This resistance remains a focal point on this timeframe, with a break higher shining light on a decision point from $0.7294-0.7267.
H1 timeframe:
$0.71 made an entrance at the beginning of the week, helped by Quasimodo support at $0.7103. Resistance at $0.7168 is now in focus; upstream casts light on resistance at $0.7207 and the $0.72 figure, alongside an AB=CD bearish pattern (the 100% Fibonacci projection at $0.7206) and additional Fibonacci structure.
In addition to the above, the relative strength index (RSI) crossed above the 50.00 centreline. This, through average gains exceeding average losses, shows positive momentum on this timeframe.
Observed Technical Levels:
Having seen H4 resistance at $0.7169-0.7187 unable to stir much of a bearish phase, the H1 timeframe slicing above resistance at $0.7168 to test $0.72 resistance (and associated confluence) could be on the table.
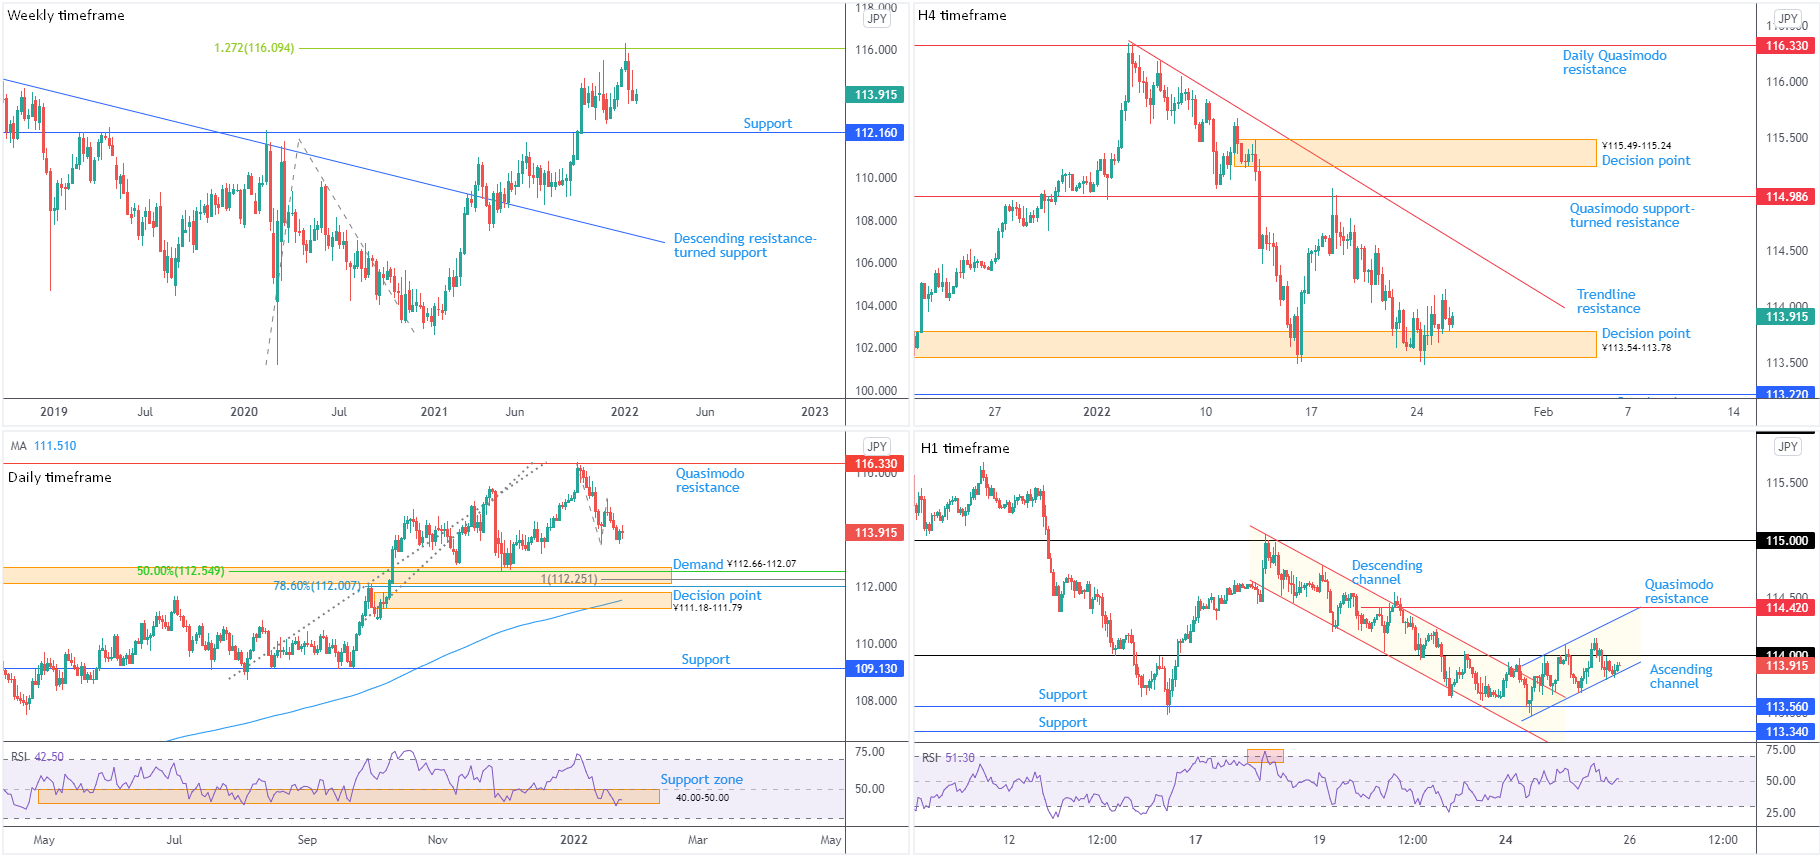
USD/JPY:
Weekly timeframe:
After touching gloves with a 1.272% Fibonacci projection from ¥116.09 in the shape of a shooting star and refreshing multi-year pinnacles, USD/JPY has pencilled in two back-to-back bearish closes. Support at ¥112.16, therefore, represents a downside goal this week.
In terms of trend, the unit has been advancing since the beginning of 2021, welcoming a descending resistance breach, drawn from the high ¥118.61. In consideration of the trend, a dip-buying theme from ¥112.16 remains a reasonable assumption.
Daily timeframe:
Since testing Quasimodo resistance at ¥116.33 at the beginning of 2022, price has been shaking out buyers and handing things to sellers. Downstream shines light on demand at ¥112.66-112.07, which happens to accommodate a 100% Fibonacci projection at ¥112.25 (harmonic traders will acknowledge this as an AB=CD pattern), a 78.6% Fibonacci retracement at ¥112.00 and a 50.0% retracement from ¥112.55.
South of the said structure, a decision point from ¥111.18-111.79 is in view, alongside a 200-day simple moving average at ¥111.51.
The trend on this timeframe, like the weekly timeframe, faces northbound. Against this background, though, the relative strength index (RSI) shows support between 40.00 and 50.00 (a ‘temporary’ oversold range since 10th May) ended last week under pressure.
H4 timeframe:
The ¥113.54-113.78 decision point, once again, came under attack in recent trading. Trendline resistance is seen above, taken from the high ¥116.35, whereas below ¥113.54-113.78 has Quasimodo support to target at ¥113.22.
H1 timeframe:
Since bringing in support at ¥113.56 at the beginning of the week, the unit overthrew channel resistance, drawn from the high ¥115.06. Adding to this, an ascending channel is in the process of forming between ¥113.47 and ¥114.00. Chartists will note price is testing channel support, as we write. Defending the latter could lead to a close above ¥114 and a possible follow-through move to Quasimodo resistance at ¥114.42.
The relative strength index (RSI) also shows the 50.00 centreline offering moderate support at the moment, action telling traders that average gains exceed average losses: positive momentum.
Observed Technical Levels:
Longer-term charts deliver a bearish impression. Consequent to weekly price reacting to the 1.272% Fibonacci projection from ¥116.09 at the beginning of the year, and the daily timeframe observing ¥112.66-112.07 demand as a possible stopping place, sellers appear to have the advantage.
From the H1 timeframe, however, it appears bulls are set to take the currency pair above ¥114 to perhaps target Quasimodo resistance at ¥114.42.
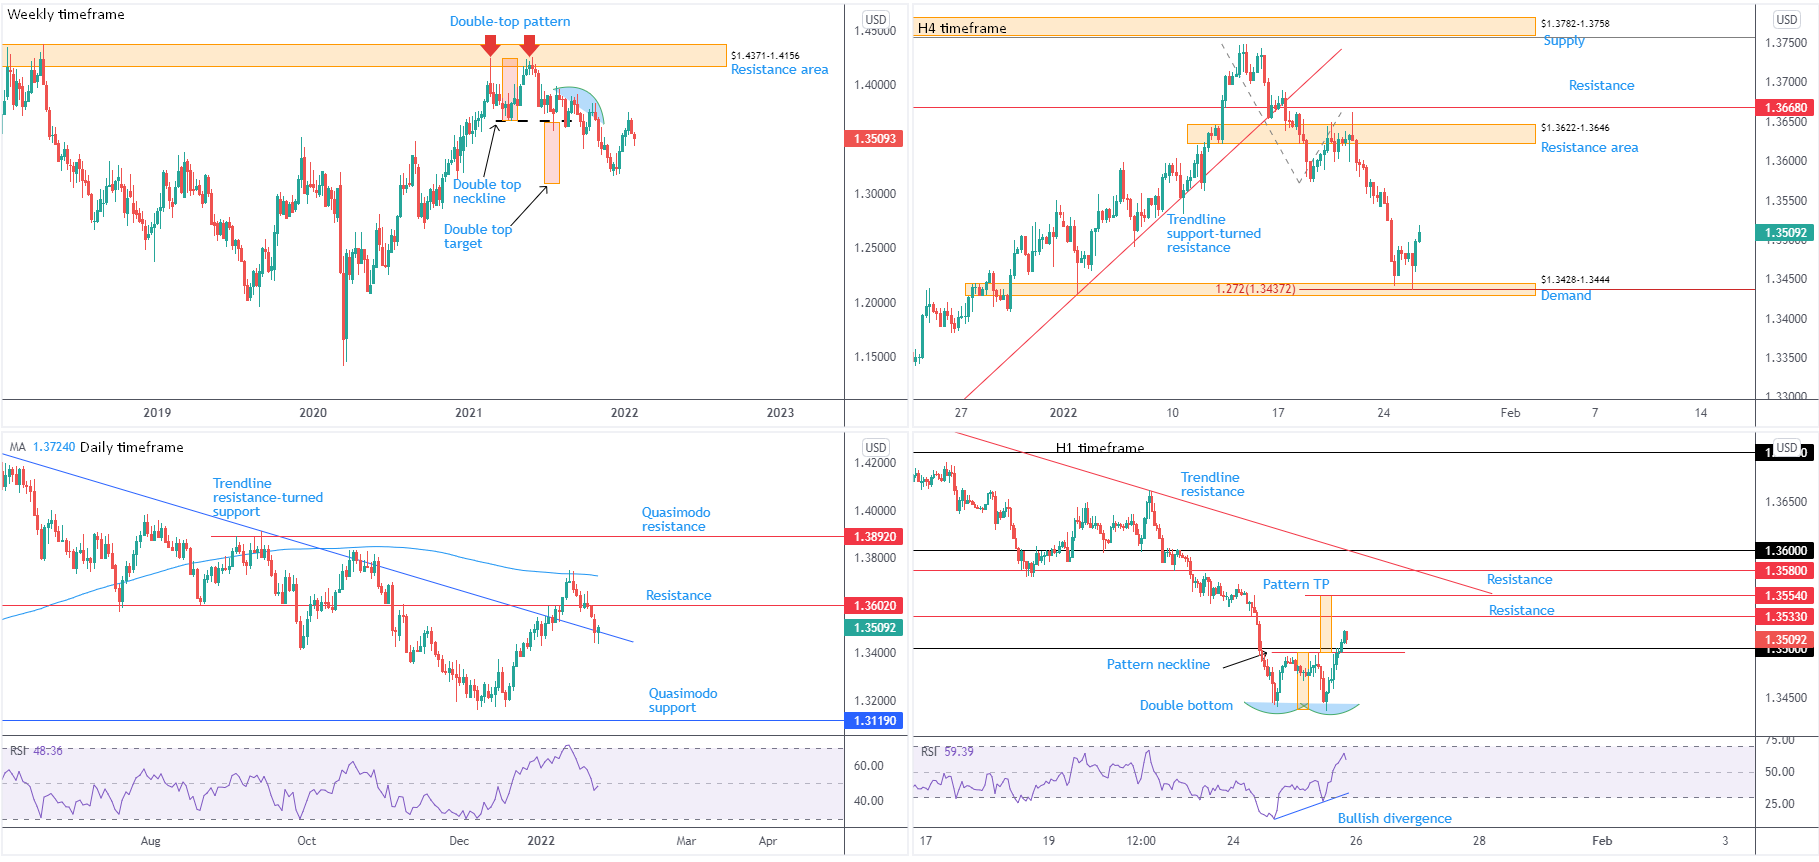
GBP/USD:
Weekly timeframe:
Snapping a 4-week bullish phase, GBP/USD recorded a 0.9 percent decline last week. This reopens the door to the double-top pattern’s ($1.4241) profit objective around $1.3093 (red boxes) in the coming weeks. Against this background, of course, is the possibility of continued upside. ‘Consumed supply’ (blue area) remains nearby between $1.4001 and $1.3830. Considering this, candle action may still be guided as far north as resistance from $1.4371-1.4156.
Trend studies show the weekly timeframe has been higher since early 2020. However, it’s important to recognise that while the trend on the weekly timeframe demonstrates an upside bias, the monthly timeframe’s long-term trend has been lower since late 2007.
Daily timeframe:
Trendline resistance-turned support entered view at the beginning of the week, taken from the high $1.4250. Candlestick enthusiasts will observe Tuesday’s candle establishing a hammer pattern, an individual formation signalling a bullish vibe.
Assuming buyers command control, resistance from $1.3602 is visible, followed by the 200-day simple moving average, circling $1.3724
Despite current support, the relative strength index (RSI) nudged beneath the 50.00 centreline which signals the prospect of negative momentum.
H4 timeframe:
As anticipated, follow-through selling developed and pushed price action towards demand at $1.3428-1.3444, an area sharing chart space with the daily timeframe’s trendline support.
Tuesday put forward a hammer candlestick pattern from the zone, aided by a 1.272% Fibonacci projection from $1.3437, and price since clocked a high of $1.3519.
Resistance at $1.3622-1.3646 remains a clear upside objective, should buyers attempt to take the wheel.
H1 timeframe:
Recent sessions observed short-term activity chalk up a double-bottom formation around $1.3440ish. Price dethroned the pattern’s neckline at $1.3496 and also $1.35, action indicating the unit could be headed above nearby resistance at $1.3533 to the double-tops profit objective at $1.3554. Note this level is set just beneath trendline resistance, etched from the high $1.3743, and resistance from $1.3580.
The double-bottom pattern benefited from bullish divergence within oversold territory. The indicator’s value has since secured position above the 50.00 centreline and is hovering nearby overbought level.
Observed Technical Levels:
The daily timeframe showing active trendline support, the H4 timeframe showing demand at $1.3428-1.3444, and the H1 confirming upside through a double-top pattern shows GBP/USD is perhaps gearing up for a test of $1.3550ish. Prior to any bullish attempts, of course, a $1.35 retest on the H1 could occur and provide short-term traders a floor to consider a bullish theme.
DISCLAIMER:
The information contained in this material is intended for general advice only. It does not take into account your investment objectives, financial situation or particular needs. FP Markets has made every effort to ensure the accuracy of the information as at the date of publication. FP Markets does not give any warranty or representation as to the material. Examples included in this material are for illustrative purposes only. To the extent permitted by law, FP Markets and its employees shall not be liable for any loss or damage arising in any way (including by way of negligence) from or in connection with any information provided in or omitted from this material. Features of the FP Markets products including applicable fees and charges are outlined in the Product Disclosure Statements available from FP Markets website, www.fpmarkets.com and should be considered before deciding to deal in those products. Derivatives can be risky; losses can exceed your initial payment. FP Markets recommends that you seek independent advice. First Prudential Markets Pty Ltd trading as FP Markets ABN 16 112 600 281, Australian Financial Services License Number 286354.


 Access +10,000 financial
instruments
Access +10,000 financial
instruments