
Note – Charts provided by Trading View
EUR/USD:
Monthly timeframe:
(Technical change on this timeframe is often limited though serves as guidance to potential longer-term moves)
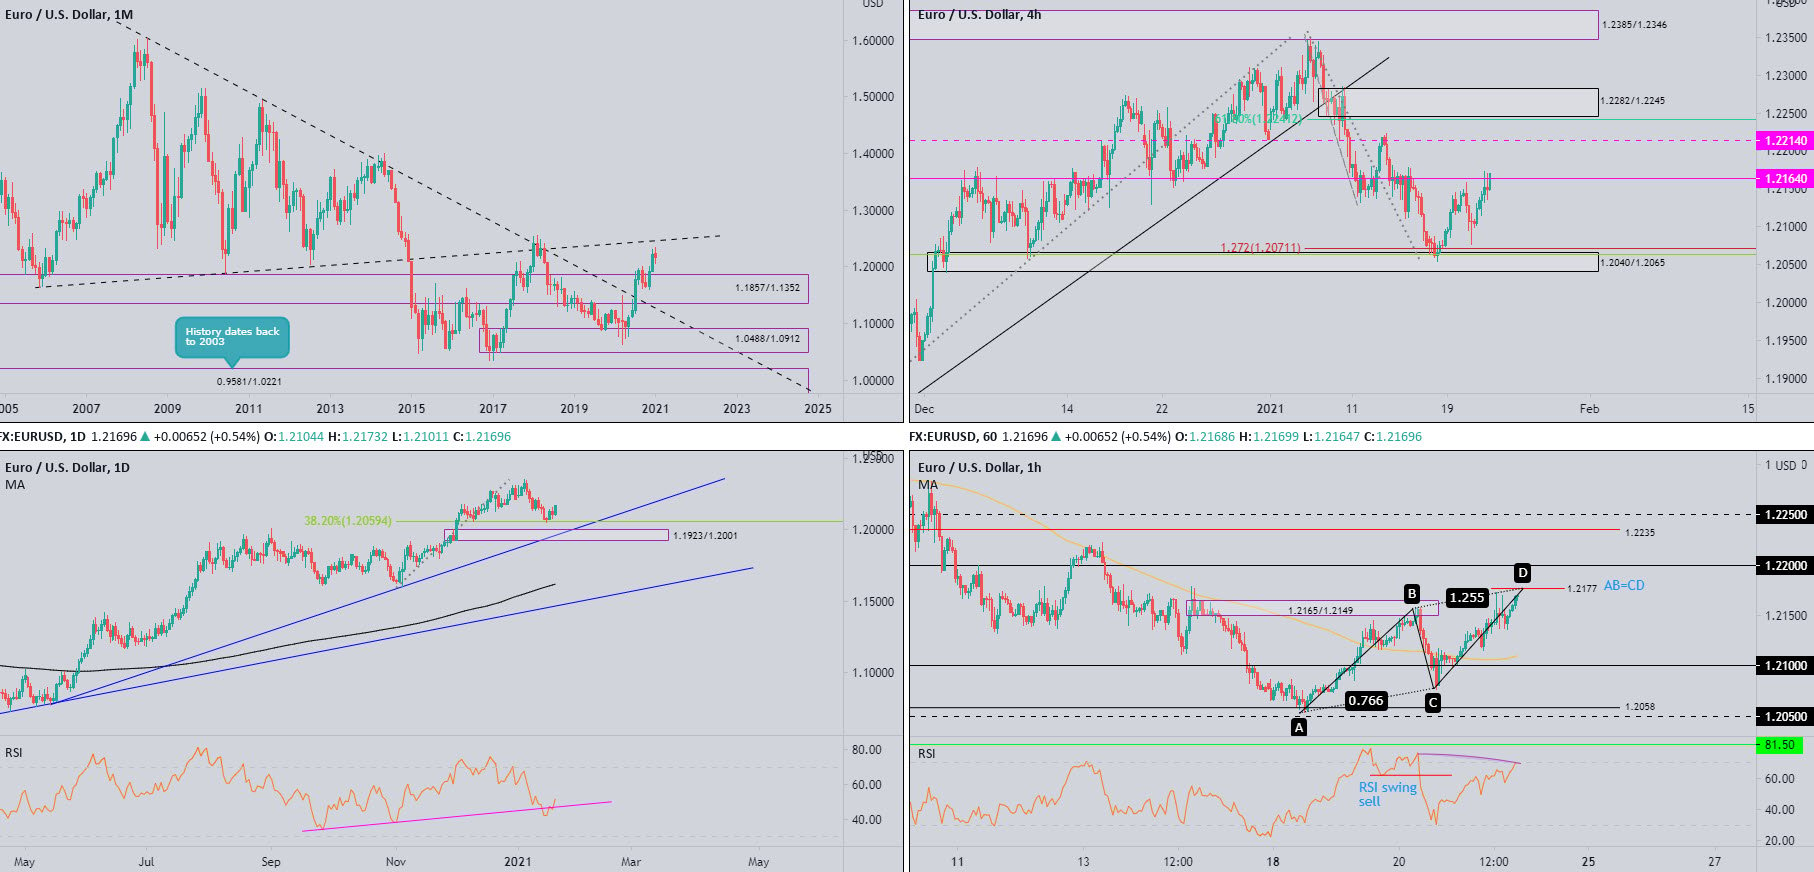
Following the break of long-term trendline resistance (1.6038) in July, and subsequent break of supply at 1.1857/1.1352 in August, buyers made an entrance heading into the close of 2020 and recorded fresh multi-month highs.
This—despite January’s current slide off 2021 pinnacles (0.4 percent)—reasons additional upside towards ascending resistance (prior support – 1.1641) may eventually be on the horizon.
The primary uptrend has been in play since price broke the 1.1714 high (Aug 2015) in July 2017.
Daily timeframe:
Leaving demand at 1.1923/1.2001 (an area complemented by trendline support [1.0774]) untested, buyers, as you can see, have warmed to the 38.2% Fib level at 1.2059 as a broadly soft USD (see US dollar index) fuels euro demand.
Sustained buying throws light on 2021 tops at 1.2349.
Interestingly, the RSI value reclaimed trendline support yesterday, despite dipping a toe below the 50.00 centreline.
H4 timeframe:
Resistance at 1.2164 is centre stage as we transition into Friday’s session, following Thursday’s recovery ahead of demand at 1.2040/1.2065 (accompanied by a Fib cluster at 1.2063/1.2071).
Resistance from 1.2214 is lying in wait above 1.2164, sheltered under supply coming in from 1.2282/1.2245. Fib fans will also note the 61.8% Fib level inhabits territory just under the aforesaid supply at 1.2241.
H1 timeframe:
Thursday’s price action claiming position above the 100-period simple moving average has, as you can see, led H1 through the upper side of supply from 1.2165/1.2149 and shined light on AB=CD resistance at 1.2177. Arranged beneath the 1.22 level, this 20-pip range could be an area intraday sellers take interest in today.
What is also technically attractive about the 1.22/1.2177 combination is the RSI indicator offers bearish divergence at overbought levels.
Observed levels:
Monthly price calling for higher levels, in a market trending north since 2020, implies daily buyers could extend recovery gains. H4 resistance at 1.2164 also echoes a feeble presence, with price possibly bound for 1.2214 H4 resistance. This, of course, places a question mark on the 1.22/1.2177 H1 zone.
AUD/USD:
Monthly timeframe:
(Technical change on this timeframe is often limited though serves as guidance to potential longer-term moves)
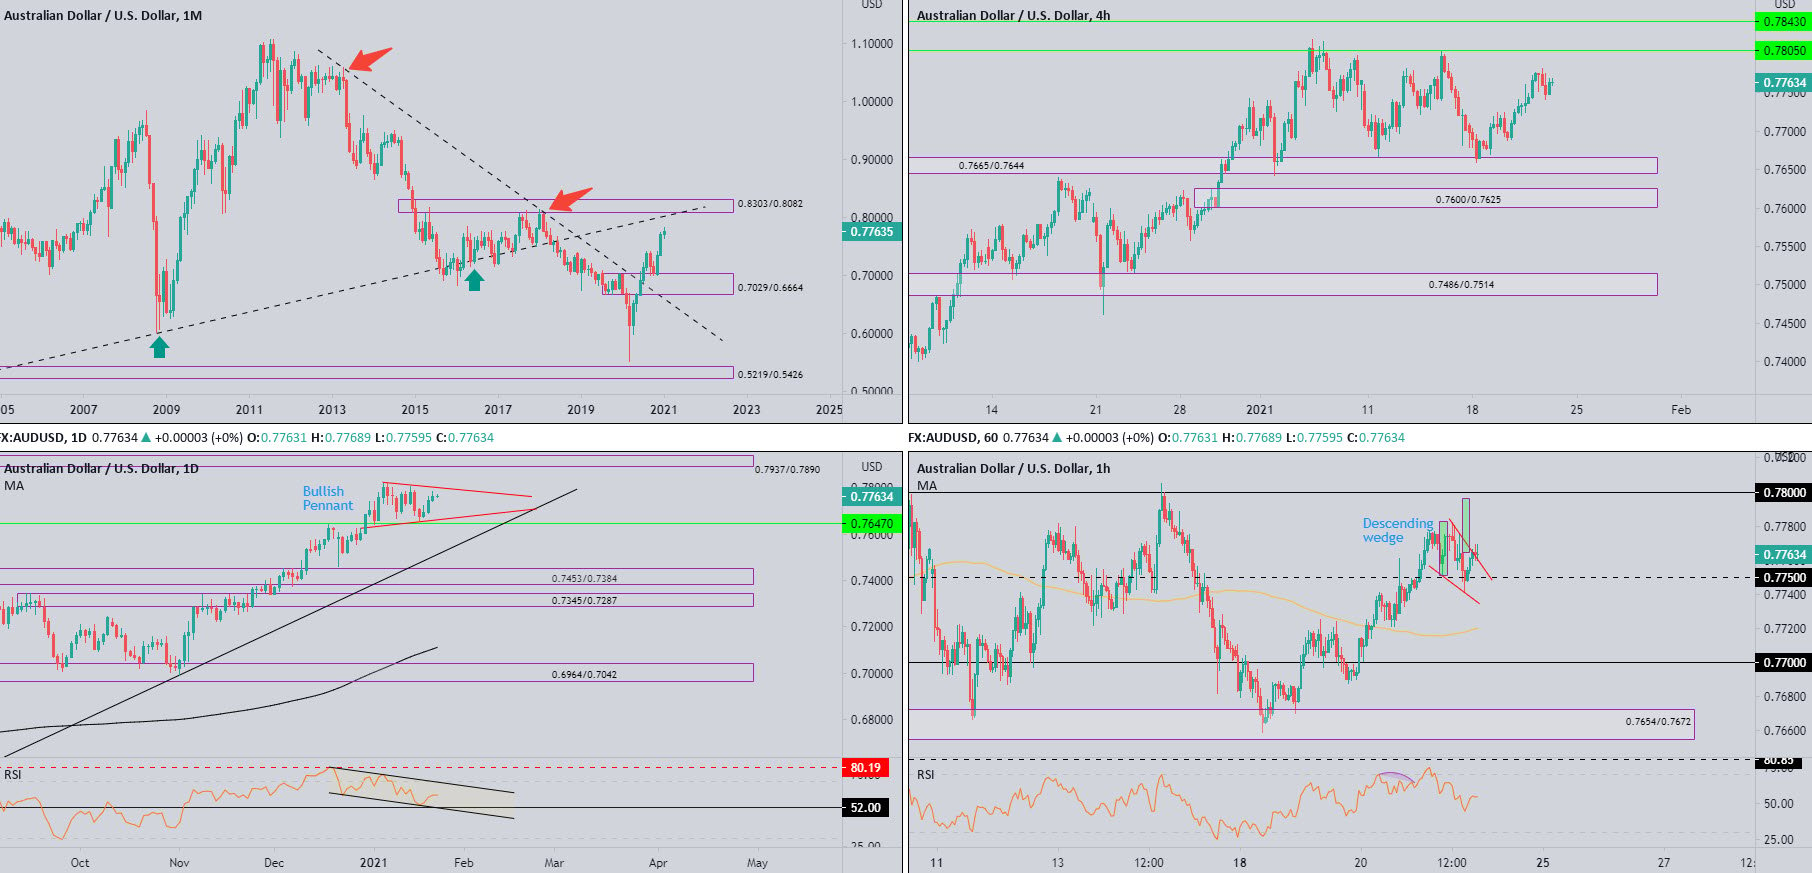
Following two spirited months of gains off demand at 0.7029/0.6664 (prior supply), early 2021 may see buyers invade 0.8303/0.8082—a supply zone aligning closely with trendline resistance (prior support – 0.4776).
In terms of trend, the primary downtrend (since mid-2011) remains south until breaking 0.8135 (January high [2018]).
Daily timeframe:
Recent developments show a bullish pennant pattern establishing between the 2021 high at 0.7820 and January 4 low at 0.7642.
Technicians will also note the aforesaid pattern balances off support at 0.7647, with supply at 0.7937/0.7890 to perhaps call for attention in the event a breakout higher develops.
In terms of the RSI indicator, the value is entrenched within a descending channel. Support is seen at 52.00, while resistance is set around 80.19.
H4 timeframe:
Following Monday’s test of demand at 0.7665/0.7644 (prior supply), the pair’s focus remains on reaching resistance at 0.7805 and possibly resistance at 0.7843.
H1 timeframe:
A detailed view of price action shows a recently established descending wedge (0.7782/0.7751) formed off 0.7750 support. To add to this, we also have the RSI rebounding from the 50.00 centreline.
Observed levels:
From a technical perspective, based on the four charts analysed, buyers appear to have the upper hand. Scope to approach higher levels on the monthly timeframe, together with H4 price displaying room to reach at least 0.7805, places H1 breakout buyers above the descending wedge pattern in a healthy position, with 0.78 targeted.
USD/JPY:
Monthly timeframe:
(Technical change on this timeframe is often limited though serves as guidance to potential longer-term moves)
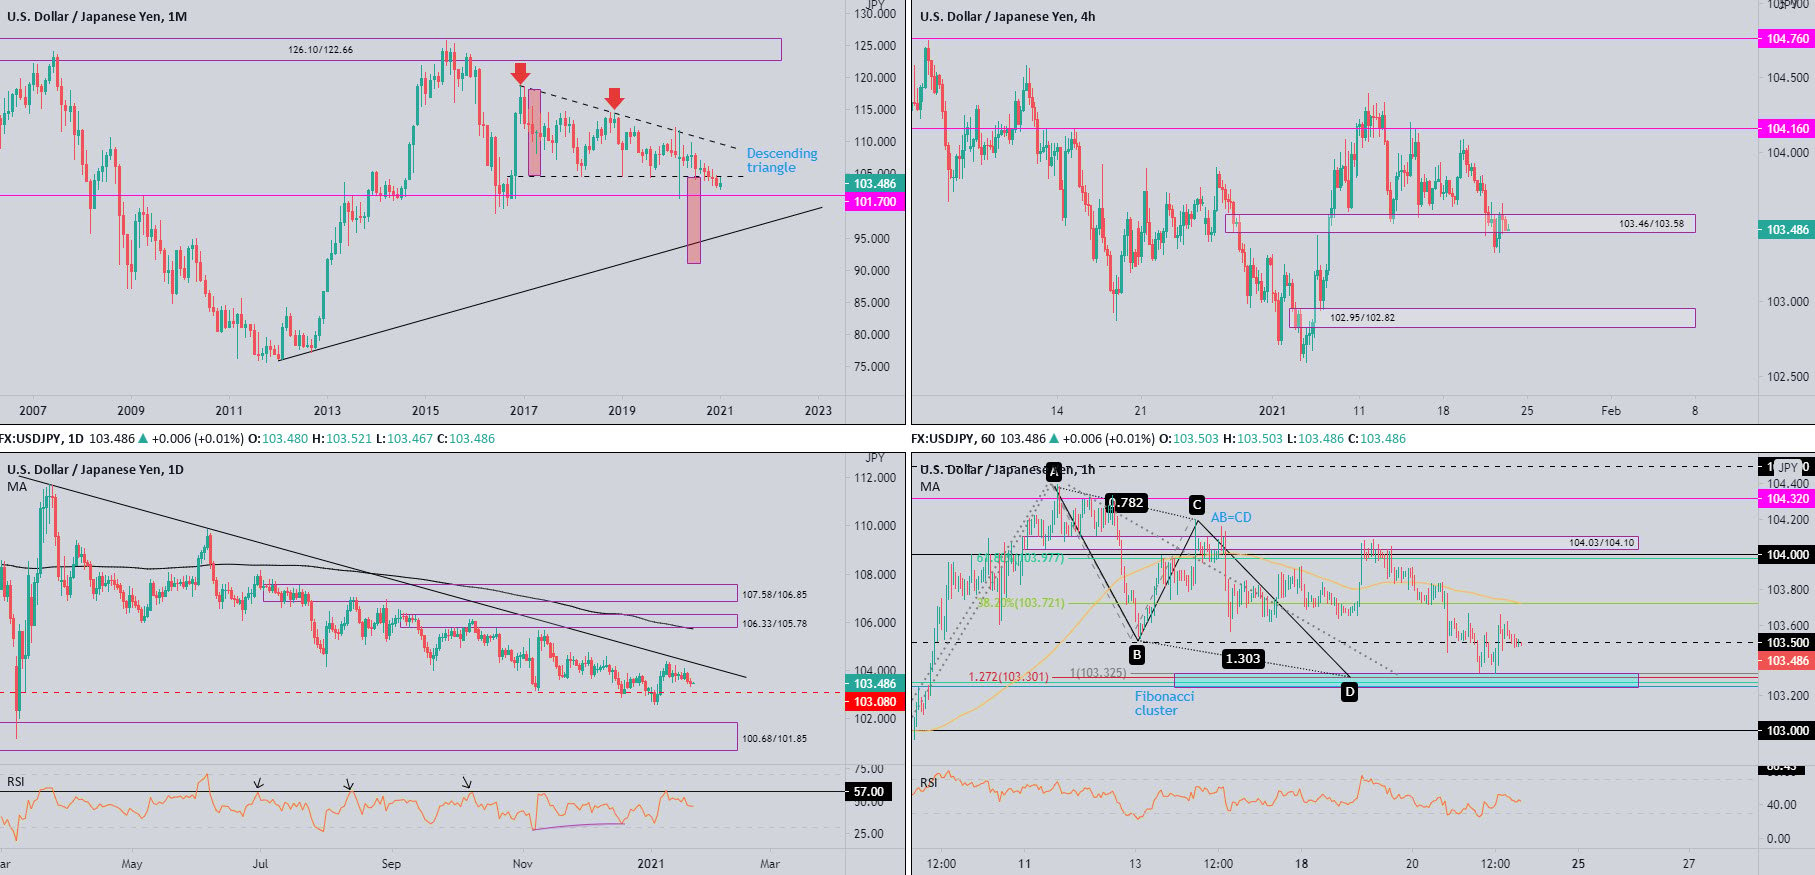
Over the span of four years, USD/JPY carved out a descending triangle pattern between 118.66/104.62.
Although December pursued terrain south of 104.62, January has so far attempted a modest comeback and is within close range of retesting 104.62.
104.62 ceding ground, however, throws light on support from 101.70, with a break uncovering trendline support (76.15) and the descending triangle’s take-profit level at 91.04 (red).
Daily timeframe:
Partly modified from previous analysis –
Despite Wednesday submitting a one-sided show to the downside, sellers offered a somewhat non-committal tone on Thursday.
Overall, though, buyers and sellers remain squaring off between trendline resistance (111.71) and 103.08 support.
Beyond the aforesaid areas, demand is visible at 100.68/101.85 (encases monthly support at 101.70) and supply can be found at 106.33/105.78 (the 200-day simple moving average circles the lower side of the supply).
Also prominent is the RSI indicator recently crossing paths with resistance at 57.00, a level obstructing upside since July 2020.
H4 timeframe:
Partly modified from previous analysis –
Demand at 103.46/103.58 (prior supply) remains under pressure, with the majority of buyers around this zone likely squeezed out of the market. Clearance of 103.46/103.58 unlocks the risk of further declines, targeting daily support at 103.08, followed by H4 demand at 102.95/102.82.
H1 timeframe:
As you can see, price action welcomed the Fib cluster between 103.24 and 103.32 on Thursday, accompanied by an AB=CD pattern, and has since lifted the currency pair above 103.50 resistance.
Thus far, buyers have been reluctant to commit north of 103.50, with price currently retesting the latter. If buyers regain consciousness, the 38.2% Fib level at 103.72 represents a logical upside objective, sharing space with the 100-period simple moving average.
The RSI indicator’s value has failed to find acceptance above the 50.00 centreline, loitering around 45.00 as we write.
Observed levels:
While the monthly, daily and H4 timeframes suggest a possible continuation to the downside, H1 rebounding from 103.50 support to the 38.2% Fib level at 103.72 remains a possibility. Asking for higher than this is difficult, having noted the pair’s position on the higher timeframes.
GBP/USD:
Monthly timeframe:
(Technical change on this timeframe is often limited though serves as guidance to potential longer-term moves)
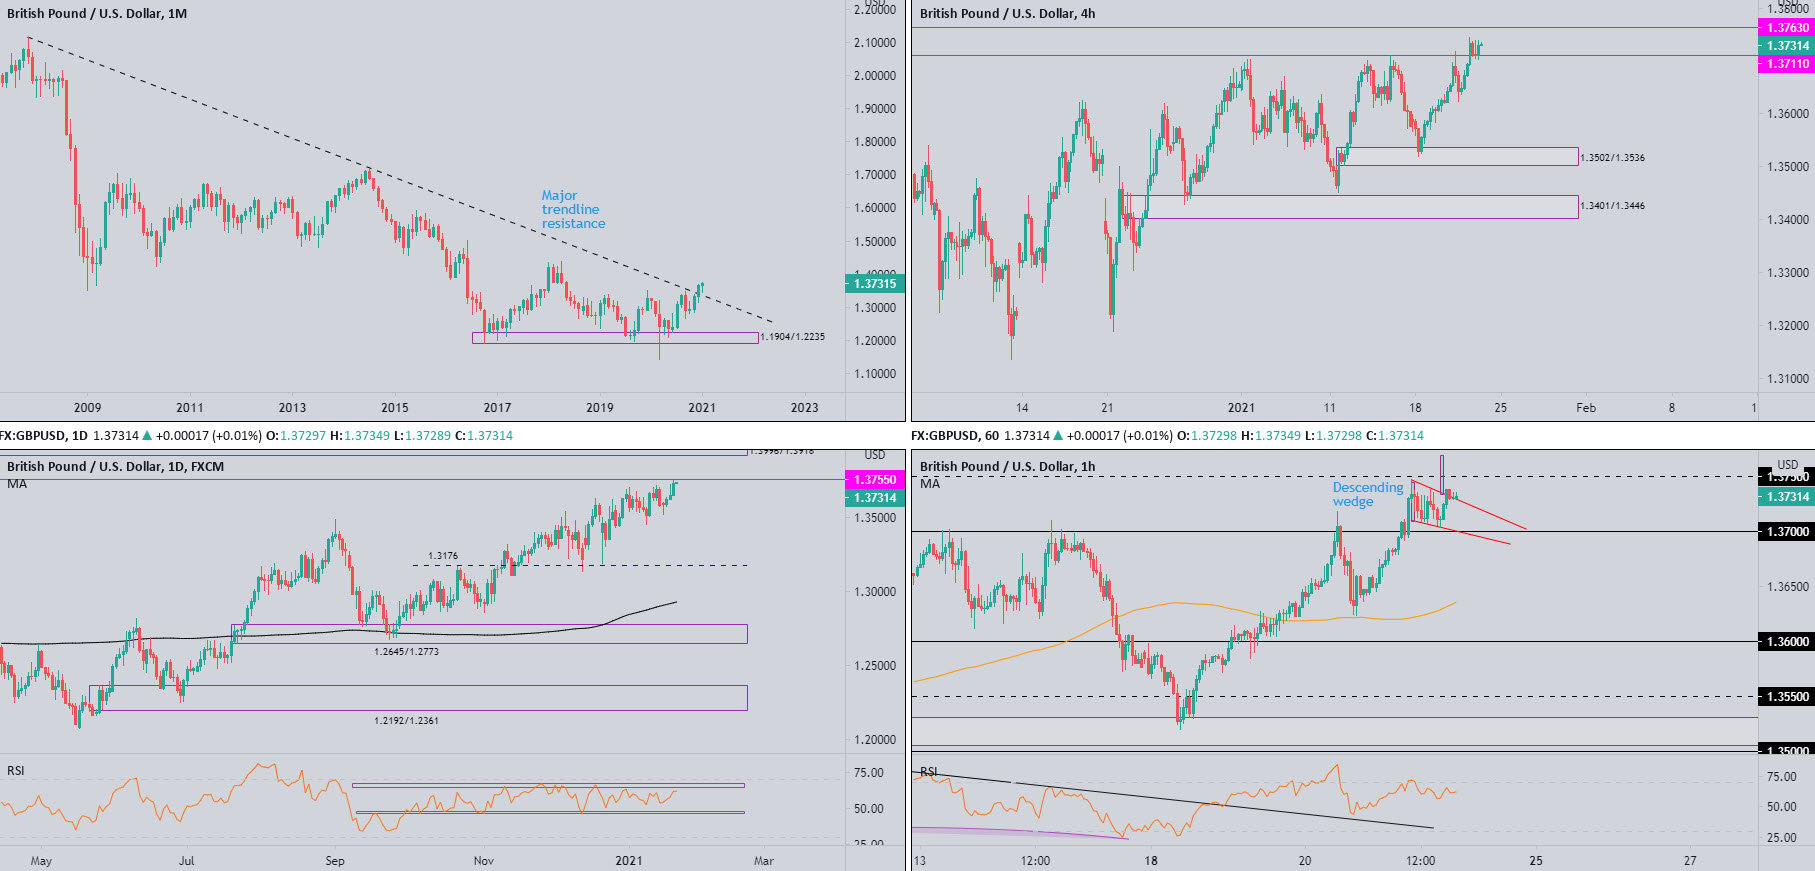
December’s 2.5 percent extension elevated GBP/USD to multi-month highs and stirred trendline resistance (2.1161).
January, as you can see, trades off session lows and recorded fresh 2021 highs (currently up by 0.6 percent).
In terms of trend, the primary trend has faced lower since early 2008, unbroken (as of current price) until 1.4376 gives way – April high, 2018. In effect, the aforesaid high represents the next upside objective on the monthly chart.
Daily timeframe:
Sterling outperformed on Thursday and refreshed 2021 tops against a broadly weaker US dollar. This throws light on nearby resistance at 1.3755.
GBP/USD has favoured an upside bias since early 2020, therefore breaching 1.3755 is possibly on the cards, with supply at 1.3996/1.3918 targeted.
The RSI indicator has revealed a rangebound environment since November, limited by support around 47.00 and resistance at the 66.00 region. RSI fans will note the value is within close range of testing the upper side of the aforesaid consolidation.
H4 timeframe:
1.3711 resistance observed a breach on Thursday, perhaps setting the technical stage for a continuation to another layer of resistance at 1.3763—found just above daily resistance at 1.3755. Also deserving notice is the 1.3711 retest.
H1 timeframe:
A notable feature on the H1 chart is the recently formed descending wedge (1.3745/1.3708), ahead of 1.37 support. According to the pattern’s technical arrangement, the formation’s take-profit objective is stationed at 1.3769 (set just above H4 resistance at 1.3763), with follow-through buying to possibly try for 1.38.
Observed levels:
Although the monthly timeframe shows buyers have room to move higher, the daily timeframe’s resistance at 1.3755 may discourage H1 breakout buyers above the descending wedge pattern.
If buyers manage to close above H4 resistance at 1.3763, this may add conviction and see trend traders pyramid positions.
DISCLAIMER:
The information contained in this material is intended for general advice only. It does not take into account your investment objectives, financial situation or particular needs. FP Markets has made every effort to ensure the accuracy of the information as at the date of publication. FP Markets does not give any warranty or representation as to the material. Examples included in this material are for illustrative purposes only. To the extent permitted by law, FP Markets and its employees shall not be liable for any loss or damage arising in any way (including by way of negligence) from or in connection with any information provided in or omitted from this material. Features of the FP Markets products including applicable fees and charges are outlined in the Product Disclosure Statements available from FP Markets website, www.fpmarkets.com and should be considered before deciding to deal in those products. Derivatives can be risky; losses can exceed your initial payment. FP Markets recommends that you seek independent advice. First Prudential Markets Pty Ltd trading as FP Markets ABN 16 112 600 281, Australian Financial Services License Number 286354.


 Access +10,000 financial
instruments
Access +10,000 financial
instruments