
Note – Charts provided by Trading View
EUR/USD:
Monthly timeframe:
(Technical change on this timeframe is often limited though serves as guidance to potential longer-term moves)
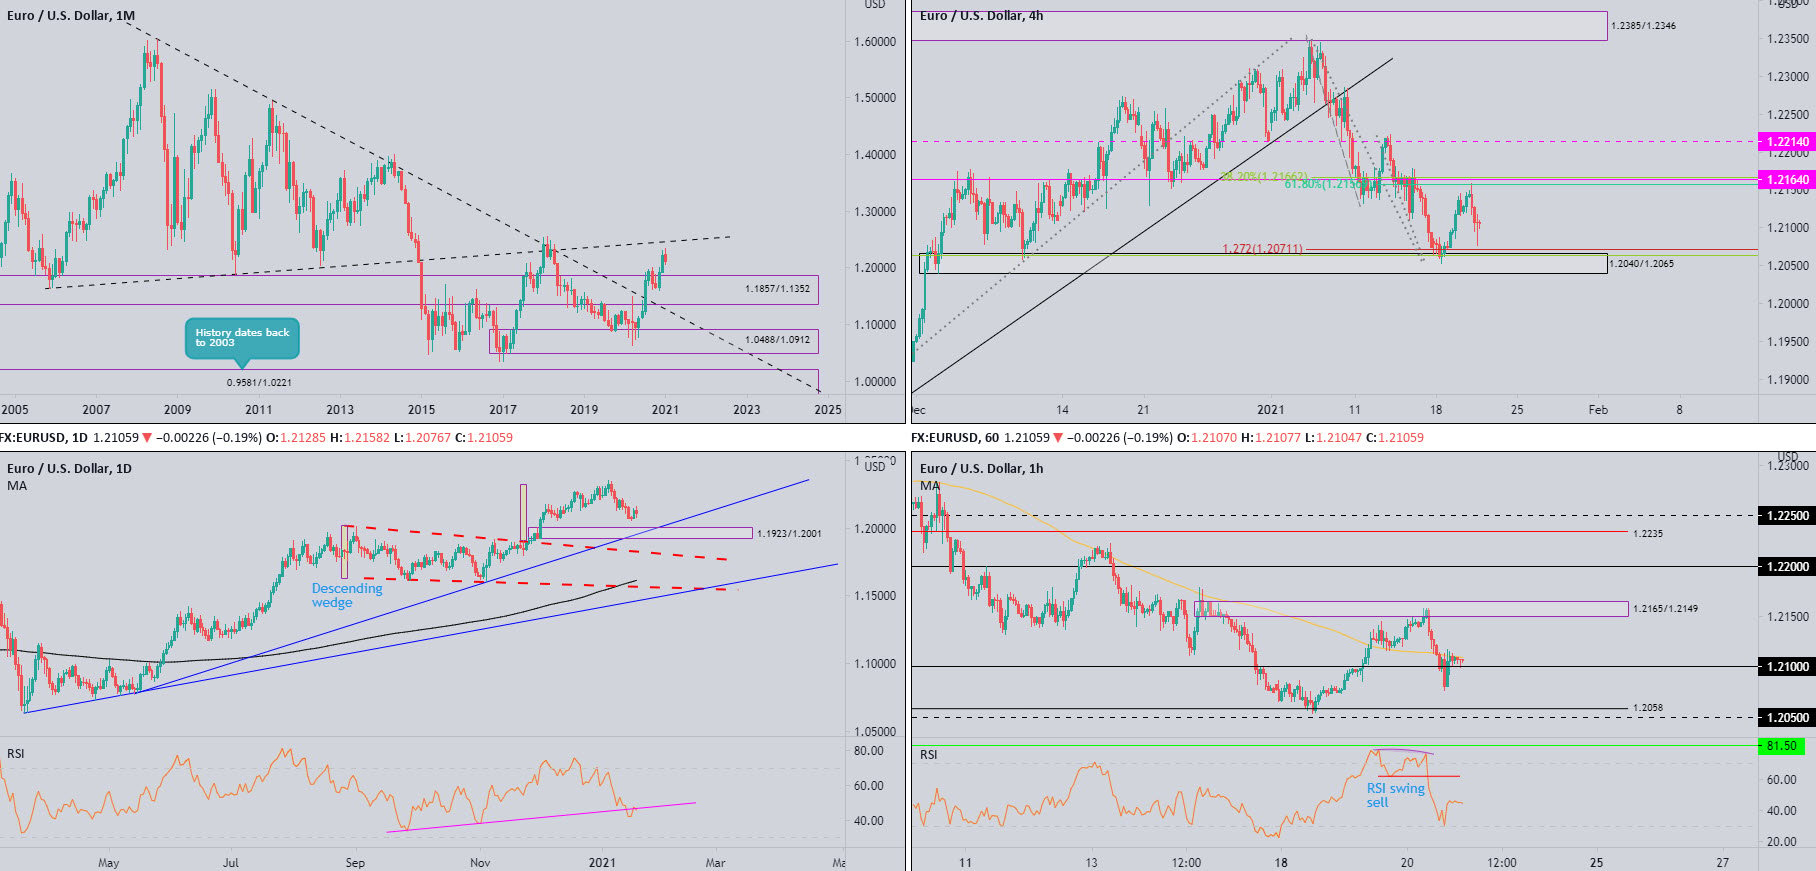
Following the break of long-term trendline resistance (1.6038) in July, and subsequent break of supply at 1.1857/1.1352 in August, buyers made an entrance heading into the close of 2020 and recorded fresh multi-month highs.
This—despite January’s current slide off 2021 pinnacles (0.9 percent)—reasons additional upside towards ascending resistance (prior support – 1.1641) may eventually be on the horizon.
The primary uptrend has been in play since price broke the 1.1714 high (Aug 2015) in July 2017.
Daily timeframe:
Partly modified from previous analysis –
Demand from 1.1923/1.2001 continues to hog the technical spotlight. This is a significant zone given it was not only here a decision was made to achieve fresh peaks above 1.2011 (September 1 high), the area is also complemented by trendline support (1.0774).
Interestingly, the RSI value retests the lower side of trendline resistance (prior support). The value currently stands at 45.60.
H4 timeframe:
Early trading Wednesday forged a striking bearish outside reversal candle after joining hands with a 61.8% Fib level at 1.2156, sheltered just south of a resistance level at 1.2164 and a 38.2% Fib level at 1.2166.
Demand at 1.2040/1.2065 is another prominent range on the H4 chart, accompanied by a Fib cluster at 1.2063/1.2071 (38.2% Fib level/127.2% Fib projection).
In the event the aforesaid demand steps aside, daily demand highlighted above at 1.1923/1.2001 is lying in wait.
H1 timeframe:
Alongside RSI bearish divergence within overbought space, EUR/USD tunnelled lower out of supply from 1.2165/1.2149 on Wednesday. Consequently, the pair dived through the 100-period simple moving average and tested the energy of 1.21 support. As you can see, although buyers are attempting to secure 1.21, the 100-period simple moving average is proving effective resistance.
Downstream, technical eyes are likely to shift towards 1.2050 support and associated support at 1.2058. Traders will note the aforesaid levels are located within H4 demand at 1.2040/1.2065.
With reference to the RSI indicator, the value recently rebounded from oversold levels and currently hovers within close range of 50.00.
Observed levels:
Trend in this market remains strongly to the upside.
1.21 on the H1 appears feeble and lacks higher timeframe support.
Immediate support beyond 1.21 is H4 demand at 1.2040/1.2065 and associated Fib cluster at 1.2063/1.2071 (38.2% Fib level/127.2% Fib projection), an area also holding H1 support around the 1.2050 region.
Should H4 demand break down, daily demand at 1.1923/1.2001 could then be the place to be.
AUD/USD:
Monthly timeframe:
(Technical change on this timeframe is often limited though serves as guidance to potential longer-term moves)
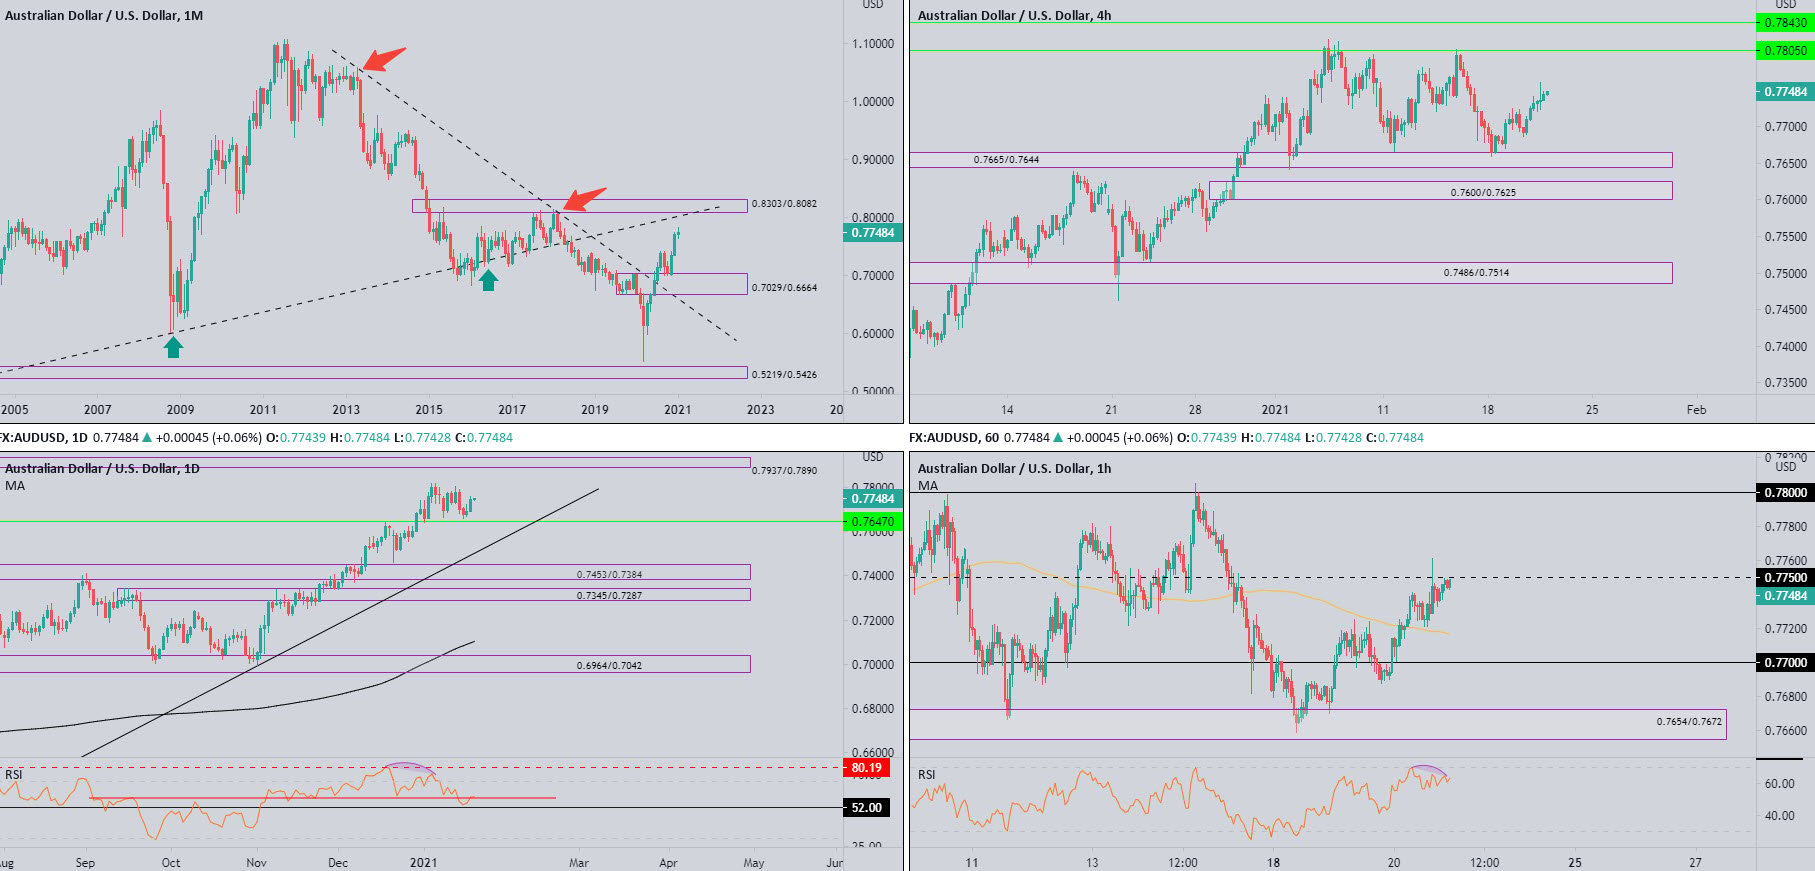
Following two spirited months of gains off demand at 0.7029/0.6664 (prior supply), buyers, despite January trading off best levels (forming a shooting star), appear free to explore as far north as 0.8303/0.8082—a supply zone aligning closely with trendline resistance (prior support – 0.4776).
In terms of trend, the primary downtrend (since mid-2011) remains south until breaking 0.8135 (January high [2018]).
Daily timeframe:
Recent developments witnessed the Australian dollar strengthen against the US dollar, extending recovery gains a few pips ahead of support at 0.7647.
Increased interest to the upside could see AUD/USD invade 2021 tops and possibly make a run for supply at 0.7937/0.7890.
In terms of the RSI indicator, resistance at 60.00 is being tested while support rests below at 52.00.
H4 timeframe:
Following Monday’s test of demand at 0.7665/0.7644 (prior supply), the pair continued to flex its financial muscle on Wednesday, reaching fresh weekly peaks at 0.7760.
Resistance falls in at 0.7805, with a break unveiling resistance at 0.7843.
H1 timeframe:
After a near-retest of the 100-period simple moving average at 0.7719 heading into US trading Wednesday, short-term buyers made contact with 0.7750 resistance. This was joined by mild RSI bearish divergence.
Brushing aside 0.7750 could unearth further upside, with 0.78 resistance perhaps on the radar for many breakout buyers. 0.78, as you can probably see, is also linked with H4 resistance at 0.7805.
Observed levels:
Room for H4 buyers to approach resistance at 0.7805 (as well as higher timeframe action showing space to advance) implies H1 0.7750 resistance is on thin ground. A break higher may call on short-term breakout buyers, with 0.78 targeted.
USD/JPY:
Monthly timeframe:
(Technical change on this timeframe is often limited though serves as guidance to potential longer-term moves)
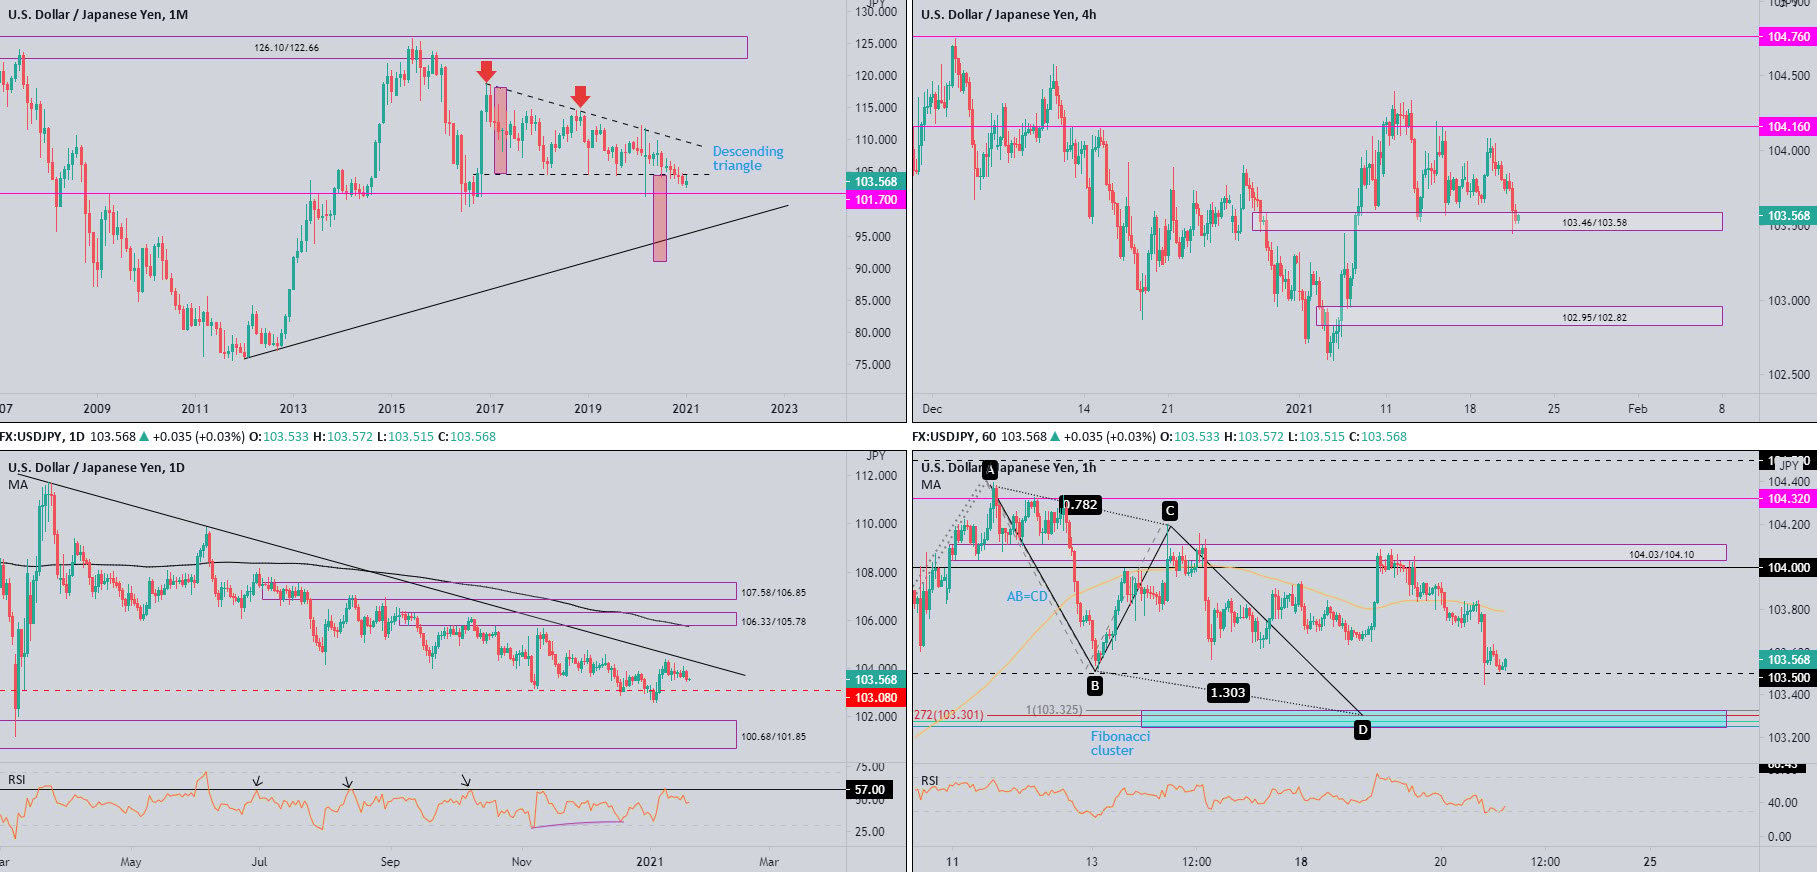
Over the span of four years, USD/JPY carved out a descending triangle pattern between 118.66/104.62.
Although December pursued terrain south of 104.62, January has so far attempted a modest comeback and is within close range of retesting 104.62.
104.62 ceding ground, however, throws light on support from 101.70, with a break uncovering trendline support (76.15) and the descending triangle’s take-profit level at 91.04 (red).
Daily timeframe:
Partly modified from previous analysis –
Wednesday exhibited a one-sided market as USD/JPY settled a few pips off session lows.
Overall, though, buyers and sellers continue to square off between trendline resistance (111.71) and 103.08 support.
Beyond the aforesaid areas, demand is visible at 100.68/101.85 (encases monthly support at 101.70) and supply can be found at 106.33/105.78 (the 200-day simple moving average circles the lower side of the supply).
Also prominent is the RSI indicator recently crossing paths with resistance at 57.00, a level obstructing upside since July 2020.
H4 timeframe:
The recent slide has placed demand at 103.46/103.58 (prior supply) under siege, with price tentatively spiking its lower side.
Clearance of 103.46/103.58 unlocks the risk of further declines today, targeting daily support at 103.08, followed by H4 demand at 102.95/102.82.
H1 timeframe:
103.50 support made its way into the fight amid US trading on Wednesday. Thus far, however, buyers have yet to embrace the level.
While the higher timeframes show that a break of H4 demand at 103.46/103.58 (holds 103.50 within) points to 103.08 daily support, the H1 timeframe displays a Fib cluster between 103.24 and 103.32, accompanied by an AB=CD pattern.
With regards to the RSI indicator, the value crossed paths with oversold territory in recent hours and currently trades just ahead of 40.00.
Observed levels:
103.50 support on the H1 is, from a technical standpoint, on shaky ground, having seen H4 demand at 103.46/103.58 come under fire. This may lead technical eyes towards the H1 Fib cluster (103.24/103.32) and AB=CD support today.
Failure to hold 103.24/103.32 points to daily support at 103.08 and the 103 level on the H1.
GBP/USD:
Monthly timeframe:
(Technical change on this timeframe is often limited though serves as guidance to potential longer-term moves)
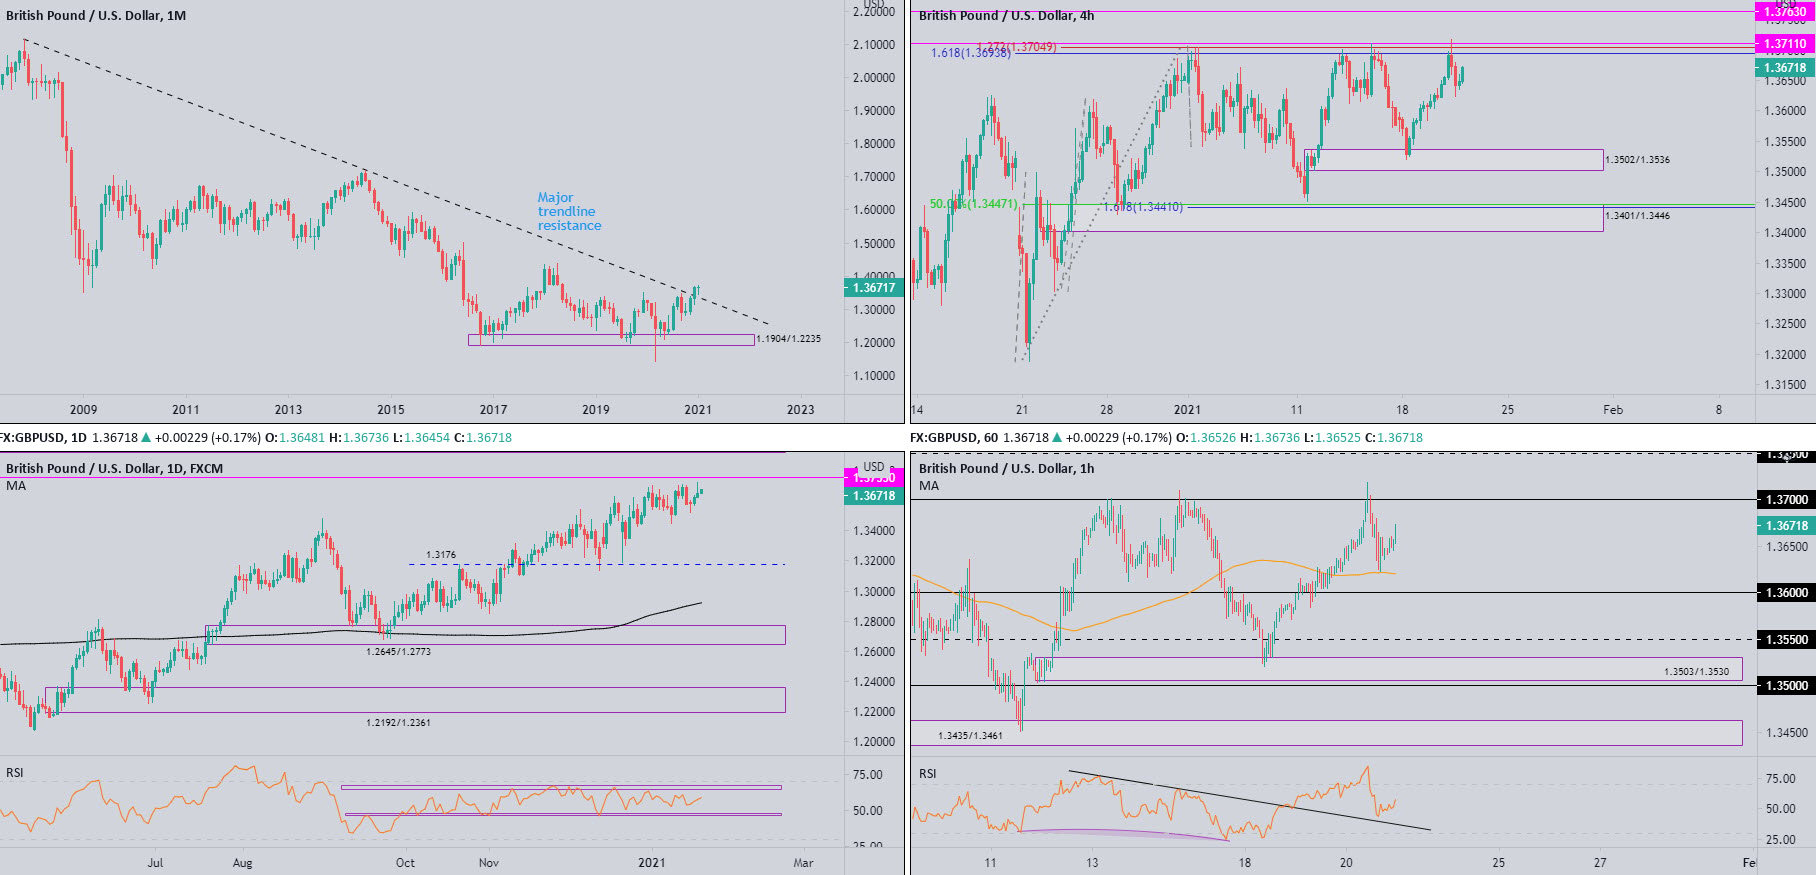
December’s 2.5 percent extension elevated GBP/USD to multi-month highs and stirred trendline resistance (2.1161).
January, as you can see, currently trades off session lows and is modestly higher by 0.1 percent.
In terms of trend, the primary trend has faced lower since early 2008, unbroken (as of current price) until 1.4376 gives way – April high, 2018. In effect, the aforesaid high represents the next upside objective on the monthly chart.
Daily timeframe:
Brought forward from previous analysis –
Resistance at 1.3755 is seen overhead.
The pair has favoured an upside bias since early 2020.
The swing low at 1.3450 (January 11) could be challenged if buyers fail to come through, with support at 1.3176 targeted if increased downside is seen.
The RSI indicator has revealed a rangebound environment since November, limited by support around 47.00 and resistance at the 66.00 region.
H4 timeframe:
Traders will note resistance at 1.3711 and Fib ext. levels at 1.3693 and 1.3704 made an entrance on Wednesday, guiding GBP/USD to a session low at 1.3623.
Buyers making a comeback in early trading, nonetheless, indicates seller weakness and could be an early cue we’re heading over 1.3711 to test resistance at 1.3763.
H1 timeframe:
Together with H4 resistance at 1.3711, 1.37 resistance also made a show on Wednesday on the H1, delivering a price move to within close range of the 100-period simple moving average at 1.3621, set ahead of the 1.36 level.
If buyers attempt to reclaim 1.37 today, 1.3750 resistance is in sight, arranged just under daily resistance at 1.3755.
From the RSI indicator, the value rebounded north of trendline support (prior resistance) and is currently exploring territory above the 50.00 centreline.
Observed levels:
Monthly price calling for a higher presence and daily activity observing resistance at 1.3755 reveals that buyers may attempt to topple the 1.37 resistance area on the H4 and H1 timeframes today, with 1.3750 forged as an initial target.
DISCLAIMER:
The information contained in this material is intended for general advice only. It does not take into account your investment objectives, financial situation or particular needs. FP Markets has made every effort to ensure the accuracy of the information as at the date of publication. FP Markets does not give any warranty or representation as to the material. Examples included in this material are for illustrative purposes only. To the extent permitted by law, FP Markets and its employees shall not be liable for any loss or damage arising in any way (including by way of negligence) from or in connection with any information provided in or omitted from this material. Features of the FP Markets products including applicable fees and charges are outlined in the Product Disclosure Statements available from FP Markets website, www.fpmarkets.com and should be considered before deciding to deal in those products. Derivatives can be risky; losses can exceed your initial payment. FP Markets recommends that you seek independent advice. First Prudential Markets Pty Ltd trading as FP Markets ABN 16 112 600 281, Australian Financial Services License Number 286354.


 Access +10,000 financial
instruments
Access +10,000 financial
instruments