Note – Charts provided by Trading View
EUR/USD:
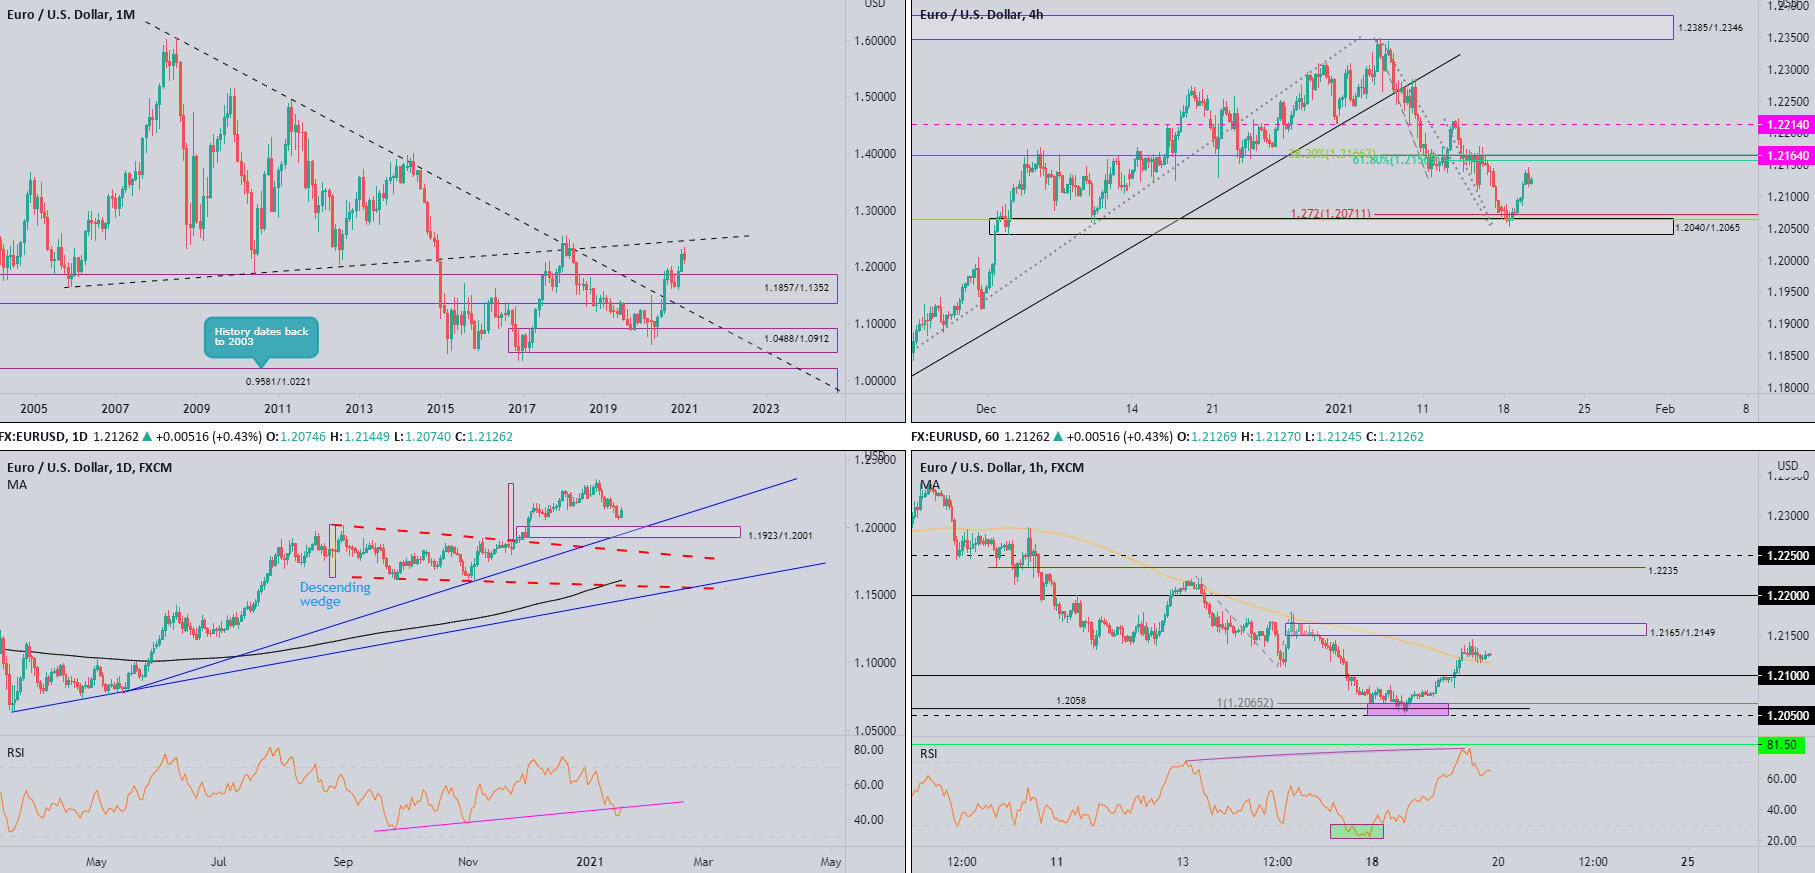
Monthly timeframe:
(Technical change on this timeframe is often limited though serves as guidance to potential longer-term moves)
Following the break of long-term trendline resistance (1.6038) in July, and subsequent break of supply at 1.1857/1.1352 in August, buyers made an entrance heading into the close of 2020 and recorded fresh multi-month highs.
This—despite January’s current slide off 2021 pinnacles (0.7 percent)—reasons additional upside towards ascending resistance (prior support – 1.1641) may eventually be on the horizon.
The primary uptrend has been in play since price broke the 1.1714 high (Aug 2015) in July 2017.
Daily timeframe:
Partly modified from previous analysis –
Despite Tuesday’s advance, demand from 1.1923/1.2001 continues to hog the spotlight—a significant zone given it was not only here a decision was made to achieve fresh peaks above 1.2011 (September 1 high), the area is also complemented by trendline support (1.0774).
Interestingly, the RSI value is seen retesting the lower side of trendline resistance (prior support). The value currently stands at 47.50.
H4 timeframe:
Demand at 1.2040/1.2065 made an entrance on Monday, accompanied by a Fib cluster at 1.2063/1.2071 (38.2% Fib level/1.272% Fib projection). Tuesday, as you can see, extended recovery gains from the aforesaid demand and landed price action within close range of resistance at 1.2164, a level boasting history as far back as February 2018. 1.2164 resistance also shares space with a Fib cluster at 1.2156 and 1.2166.
H1 timeframe:
Following the arrangement of RSI bearish divergence (hidden), along with the RSI exiting overbought levels, price action entered a narrow range on Tuesday, balancing off the upper side of a 100-period simple moving average at 1.2115.
Supply at 1.2165/1.2149 is overhead, with a break uncovering the 1.22 level. Traders will note the H4 resistance at 1.2164 is charted within the upper range of the aforesaid H1 supply.
Observed levels:
Partly modified from previous analysis –
The monthly timeframe remains calling for higher levels. However, in light of January’s slide, retesting demand at 1.1857/1.1352 is possible. Daily demand at 1.1923/1.2001, however, could hold back a 1.1857/1.1352 retest, knowing the demand fuses with daily trendline support.
H1 holding off the 100-period simple moving average, with room on both H1 and H4 timeframes to advance, could encourage short-term buying today, taking aim at H1 supply from 1.2165/1.2149 and H4 resistance at 1.2164.
AUD/USD:
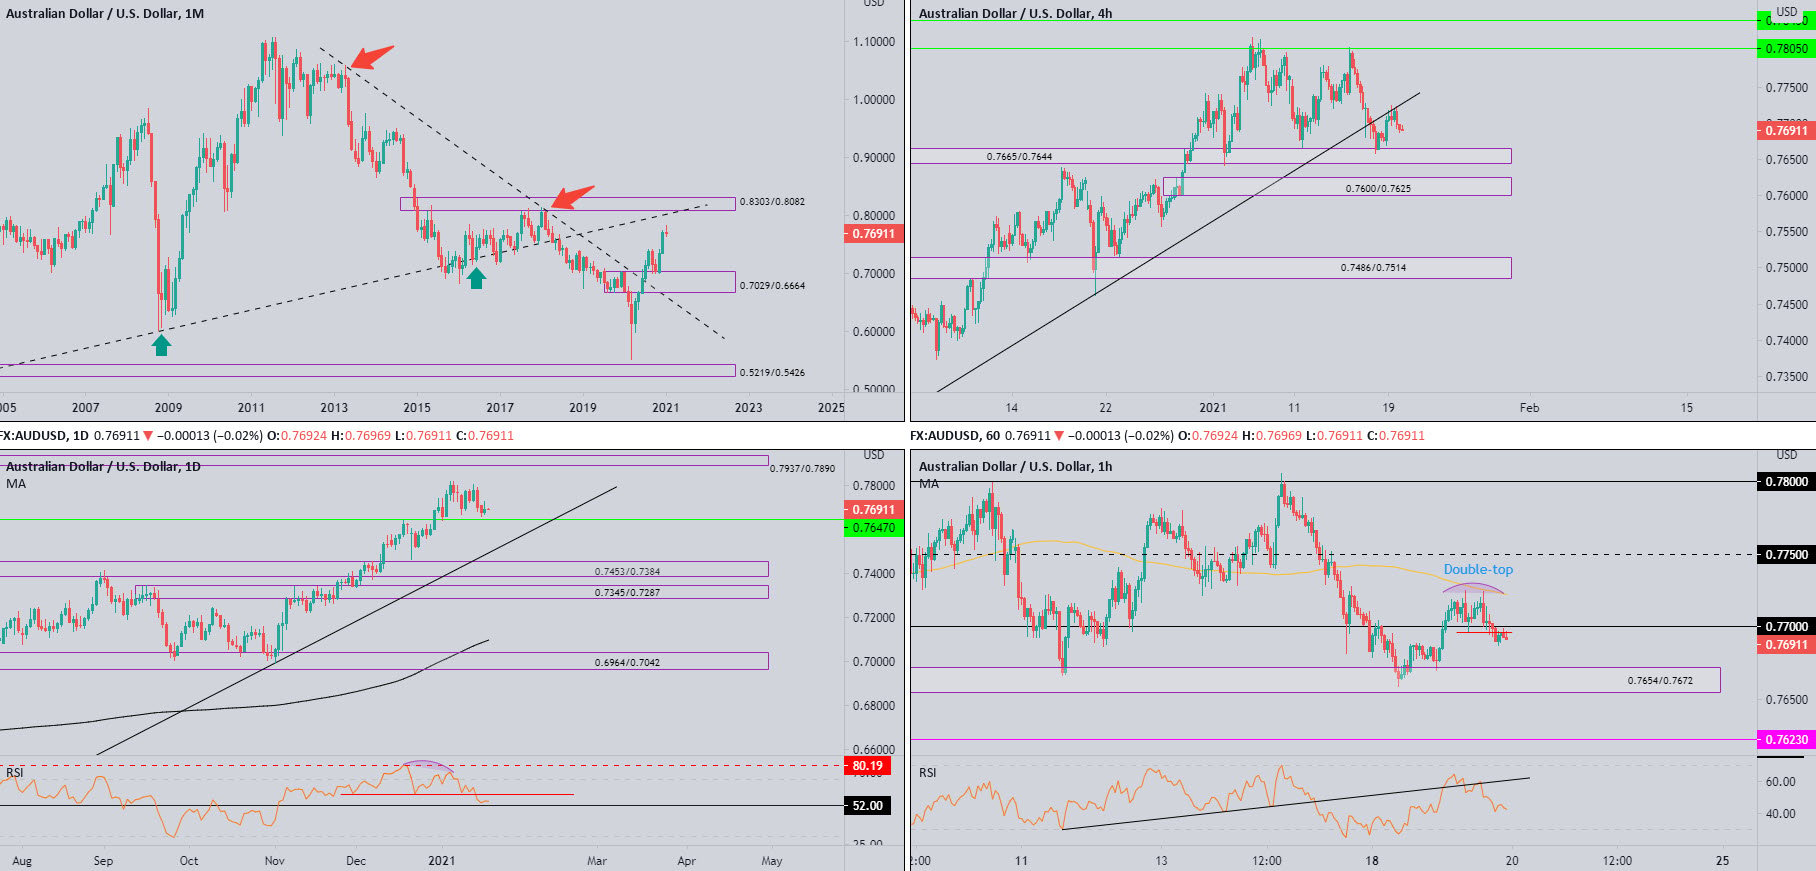
Monthly timeframe:
(Technical change on this timeframe is often limited though serves as guidance to potential longer-term moves)
Following two spirited months of gains off demand at 0.7029/0.6664 (prior supply), buyers, despite January trading off best levels (forming a shooting star), appear free to explore as far north as 0.8303/0.8082—a supply zone aligning closely with trendline resistance (prior support – 0.4776).
In terms of trend, the primary downtrend (since mid-2011) remains south until breaking 0.8135 (January high [2018]).
Daily timeframe:
Brought forward from previous analysis –
Since January 6 refreshed 2021 tops at 0.7820, AUD/USD has consolidated gains.
In terms of technical levels to be mindful of, support at 0.7647 could wave in price action today. Buyers embracing this level throws light on supply at 0.7937/0.7890.
In terms of the RSI indicator, support at 60.00 collapsing on Friday draws support at 52.00 into range.
H4 timeframe:
As buyers embraced demand at 0.7665/0.7644 (prior supply) in early trading this week, this resulted in the pair retesting trendline resistance (prior support – 0.6991) Tuesday. For now, as you can see, the retest is holding. Whether this will wave in additional selling to target demand at 0.7600/0.7625 is difficult to estimate at this point. 0.7600/0.7625, however, was a key decision point.
H1 timeframe:
The lifeless effort to hold 0.77 led H1 to form a double-top pattern around 0.7724 on Tuesday, with the pattern neckline (0.7697) also ceding ground.
According to the pattern’s take-profit objective (measured by taking the distance between the highest peak and the neckline and extending this south from the neckline), short-term flow may cross paths with demand at 0.7654/0.7672 today.
From the RSI indicator, we can see the value retested trendline resistance (prior support) and nudged below the 50.00 centreline.
Observed levels:
Short-term sellers may welcome the break of the H1 double-top pattern neckline at 0.7697, with H1 demand targeted at 0.7654/0.7672, an area fastened to the upper side of H4 demand at 0.7665/0.7644. It should be noted daily support at 0.7647 is seen within the lower boundary of H4 demand.
USD/JPY:
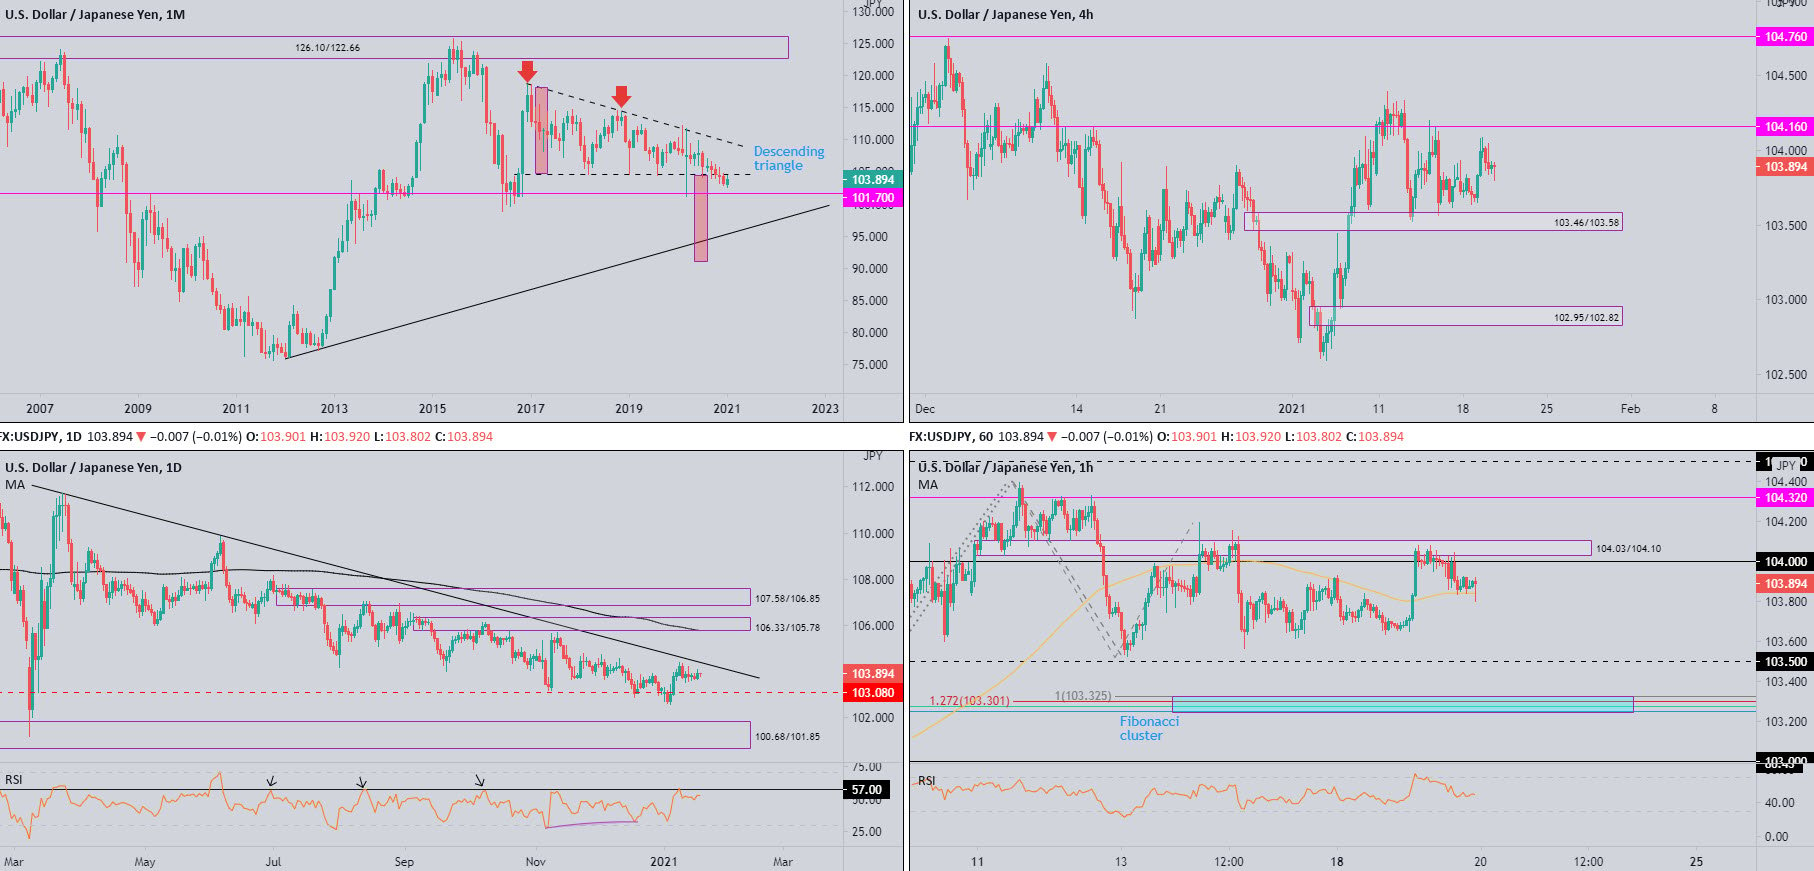
Monthly timeframe:
(Technical change on this timeframe is often limited though serves as guidance to potential longer-term moves)
Over the span of four years, USD/JPY carved out a descending triangle pattern between 118.66/104.62.
Although December pursued terrain south of 104.62, January has so far arranged a modest comeback and is within relatively close range of retesting 104.62.
104.62 ceding ground, however, throws light on support from 101.70, with a break uncovering trendline support (76.15) and the descending triangle’s take-profit level at 91.04 (red).
Daily timeframe:
Partly modified from previous analysis –
Since last Wednesday, buyers and sellers have been squaring off ahead of trendline resistance (111.71), following the 103.08 support rebound at the beginning of January.
Beyond the aforesaid areas, demand is visible at 100.68/101.85 (encases monthly support at 101.70) and supply can be found at 106.33/105.78 (the 200-day simple moving average circles the lower side of the supply).
Also prominent is the RSI indicator recently crossing paths with resistance at 57.00, a level obstructing upside since July 2020.
H4 timeframe:
Technical change on this chart has been somewhat limited since the currency pair entered a narrow consolidation a week ago.
104.16 resistance and demand at 103.46/103.58 (prior supply) remain centre stage. Downriver, demand is set around 102.95/102.82, arranged beneath daily support at 103.08, while skies above 104.16 are relatively blue until resistance at 104.76—placed north of 104.57 (December 10 high).
H1 timeframe:
Early movement on Tuesday, in the shape of two heavy-handed H1 bullish candles, toppled the 100-period simple moving average and greeted 104 resistance and supply at 104.03/104.10 (prior demand). As you can see, this provided enough fuel to facilitate a retest at the 100-period simple moving average at 103.84.
Buyers holding the aforesaid SMA suggests selling is thin and consequently may shift interest north of 104 to 104.32 resistance.
Observed levels:
Short-term buyers from the H1 timeframe’s simple moving average has an ultimate target set around 104.62 (based on the monthly timeframe).
However, before reaching this far north, 104 resistance, supply at 104.03/104.10, 104.32 resistance and 104.50 resistance must be taken on the H1, along with 104.16 resistance on the H4. A H4 close above the latter may be interpreted as a bullish cue we’re headed for 104.62 on the monthly timeframe, and possibly H4 resistance at 104.76.
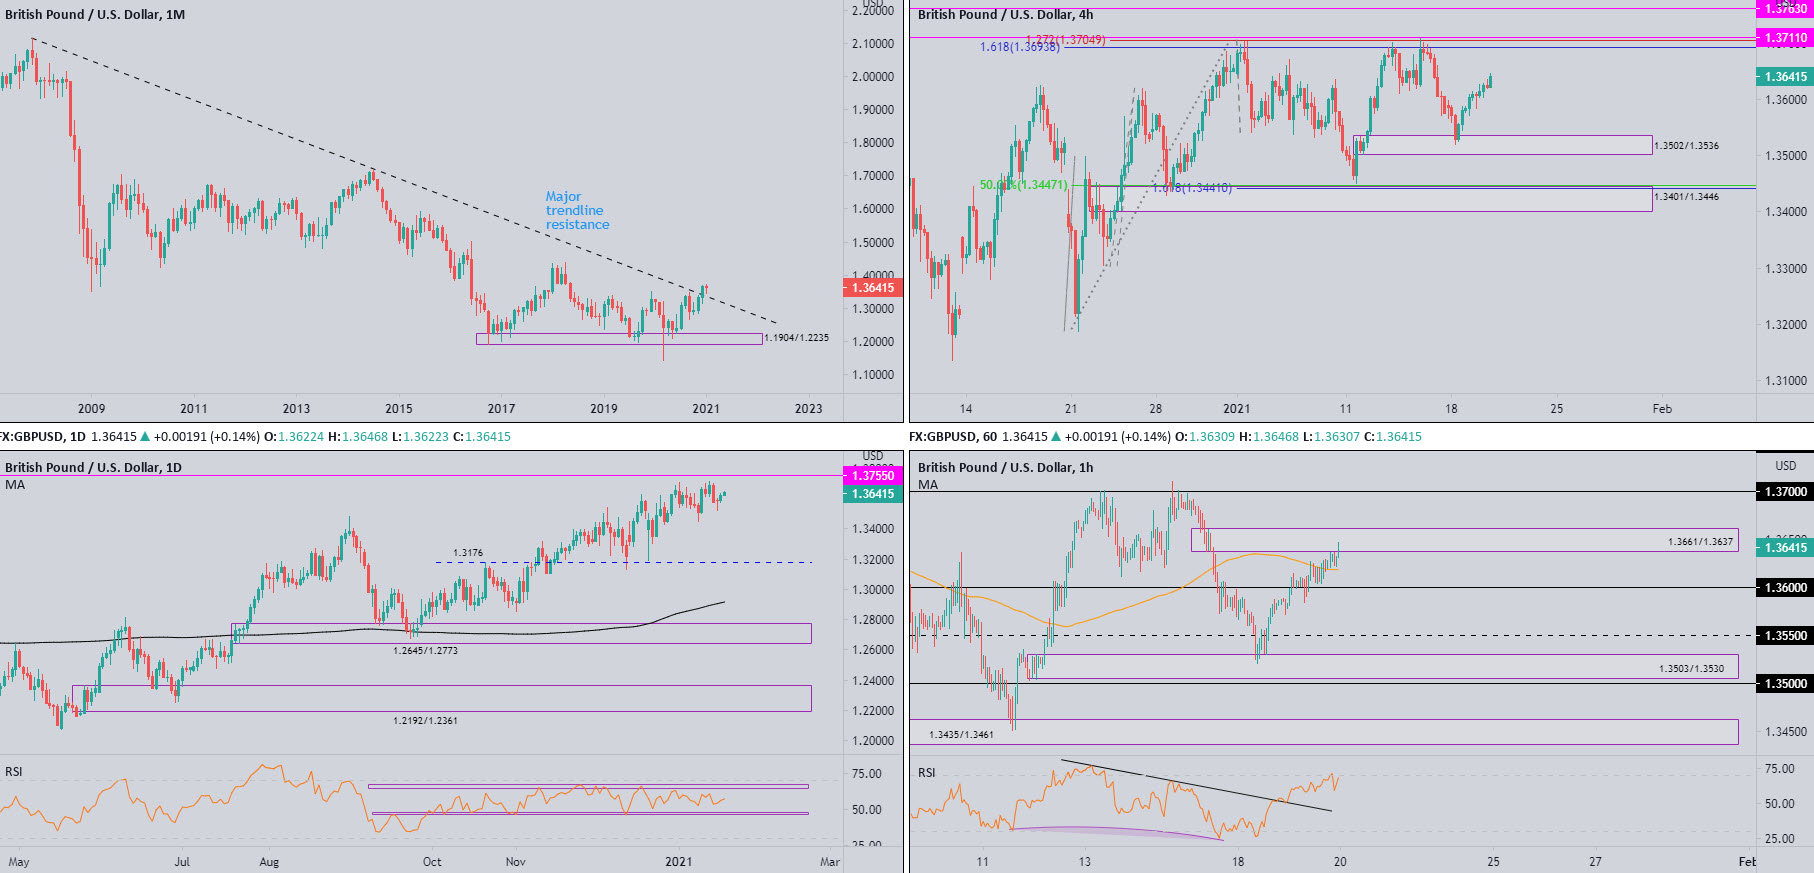
GBP/USD:
Monthly timeframe:
(Technical change on this timeframe is often limited though serves as guidance to potential longer-term moves)
December’s 2.5 percent extension elevated GBP/USD to multi-month highs and stirred trendline resistance (2.1161). January, as you can see, currently trades unchanged.
In terms of trend, the primary trend has faced lower since early 2008, unbroken (as of current price) until 1.4376 gives way – April high, 2018. In effect, the aforesaid high represents the next upside objective on the monthly chart.
Daily timeframe:
Partly modified from previous analysis –
Resistance at 1.3755 is seen overhead.
The pair has favoured an upside bias since early 2020.
The swing low at 1.3450 (January 11) could be challenged if buyers fail to come through, with support at 1.3176 targeted if increased downside is seen.
The RSI indicator has revealed a rangebound environment since November, limited by support around 47.00 and resistance at the 66.00 region.
H4 timeframe:
Demand at 1.3502/1.3536 proved effective support, with additional moves north throwing light on resistance at 1.3711 and Fib ext. levels at 1.3693 and 1.3704.
H1 timeframe:
Sterling eked out modest gains against the US dollar on Tuesday, taking the currency pair above the 1.36 level and the 100-period simple moving average to eventually join hands with supply at 1.3661/1.3637.
The aforesaid supply, a drop-base-drop formation, is considered a relatively significant area due to its dominant push from the base. Selling from here, though, must contend with the 100-period simple moving average and 1.36 support.
From the RSI indicator, the value entered overbought space following the break of trendline resistance.
Observed levels:
Scope to travel north on the monthly, daily and H4 timeframes implies H1 supply at 1.3661/1.3637 could be fragile. A 1.36 retest, therefore, may encourage a bullish scene, with 1.37 initially targeted.
DISCLAIMER:
The information contained in this material is intended for general advice only. It does not take into account your investment objectives, financial situation or particular needs. FP Markets has made every effort to ensure the accuracy of the information as at the date of publication. FP Markets does not give any warranty or representation as to the material. Examples included in this material are for illustrative purposes only. To the extent permitted by law, FP Markets and its employees shall not be liable for any loss or damage arising in any way (including by way of negligence) from or in connection with any information provided in or omitted from this material. Features of the FP Markets products including applicable fees and charges are outlined in the Product Disclosure Statements available from FP Markets website, www.fpmarkets.com and should be considered before deciding to deal in those products. Derivatives can be risky; losses can exceed your initial payment. FP Markets recommends that you seek independent advice. First Prudential Markets Pty Ltd trading as FP Markets ABN 16 112 600 281, Australian Financial Services License Number 286354.


 Access +10,000 financial
instruments
Access +10,000 financial
instruments