
Note – Charts provided by Trading View
EUR/USD:
Monthly timeframe:
(Technical change on this timeframe is often limited though serves as guidance to potential longer-term moves)
Following the break of long-term trendline resistance (1.6038) in July, and subsequent break of supply at 1.1857/1.1352 in August, buyers made an entrance heading into the close of 2020 and recorded fresh multi-month highs. This, despite January’s current slide (-0.5 percent), reasons additional upside towards ascending resistance (prior support – 1.1641) may be on the horizon.
The primary uptrend has been in play since price broke the 1.1714 high (Aug 2015) in July 2017.
Daily timeframe:
1.2095 support has been a talking point on this timeframe since price recoiled from 2021 pinnacles around 1.2349 (after crossing paths with a descending wedge pattern’s [1.2011/1.1612] take-profit target at 1.2318 [yellow]).
Trend on this timeframe remains decisively north, with the latest correction to possibly attract dip-buying strategies.
Through the lens of the RSI indicator, the value hovers within a stone’s throw from trendline support, though is also circling under the 50.00 centreline.
H4 timeframe:
The H4 timeframe reveals buyers and sellers are squaring off between support at 1.2164, derived from as far back as January 2018 (the support level also joins forces with a number of Fib levels at 1.2154/1.2167), and resistance from 1.2214.
A break north shines light on ascending resistance (NOT considered a trendline resistance), drawn from December 9 trough at 1.2058; a 1.2164 break, on the other hand, guides attention to demand coming in from 1.2040/1.2065.
H1 timeframe:
The 100-period simple moving average arranged around 1.2217 proved too much for breakout buyers above 1.22 on Wednesday.
Following a bearish outside reversal, early London burrowed through 1.22 to touch lows at 1.2140, a few pips ahead of 1.2125 support and neighbouring 1.21 support.
In terms of where we stand on the RSI indicator, hidden bearish divergence from overbought space saw the value fall sharply in recent trading, taking over support at 42.21. As we write, the indicator hugs the lower side of the said support (now possible resistance).
Observed levels:
H4 support at 1.2164 echoes a vulnerable tone right now. Aside from buyers struggling to overturn nearby resistance at 1.2214, the monthly, daily and H1 timeframes show room to navigate deeper water.
Dipping through H1 support at 1.2125, therefore, is a scenario worth keeping an eyeball on, as 1.21 may act as a magnet to price, given daily support set at 1.2095.

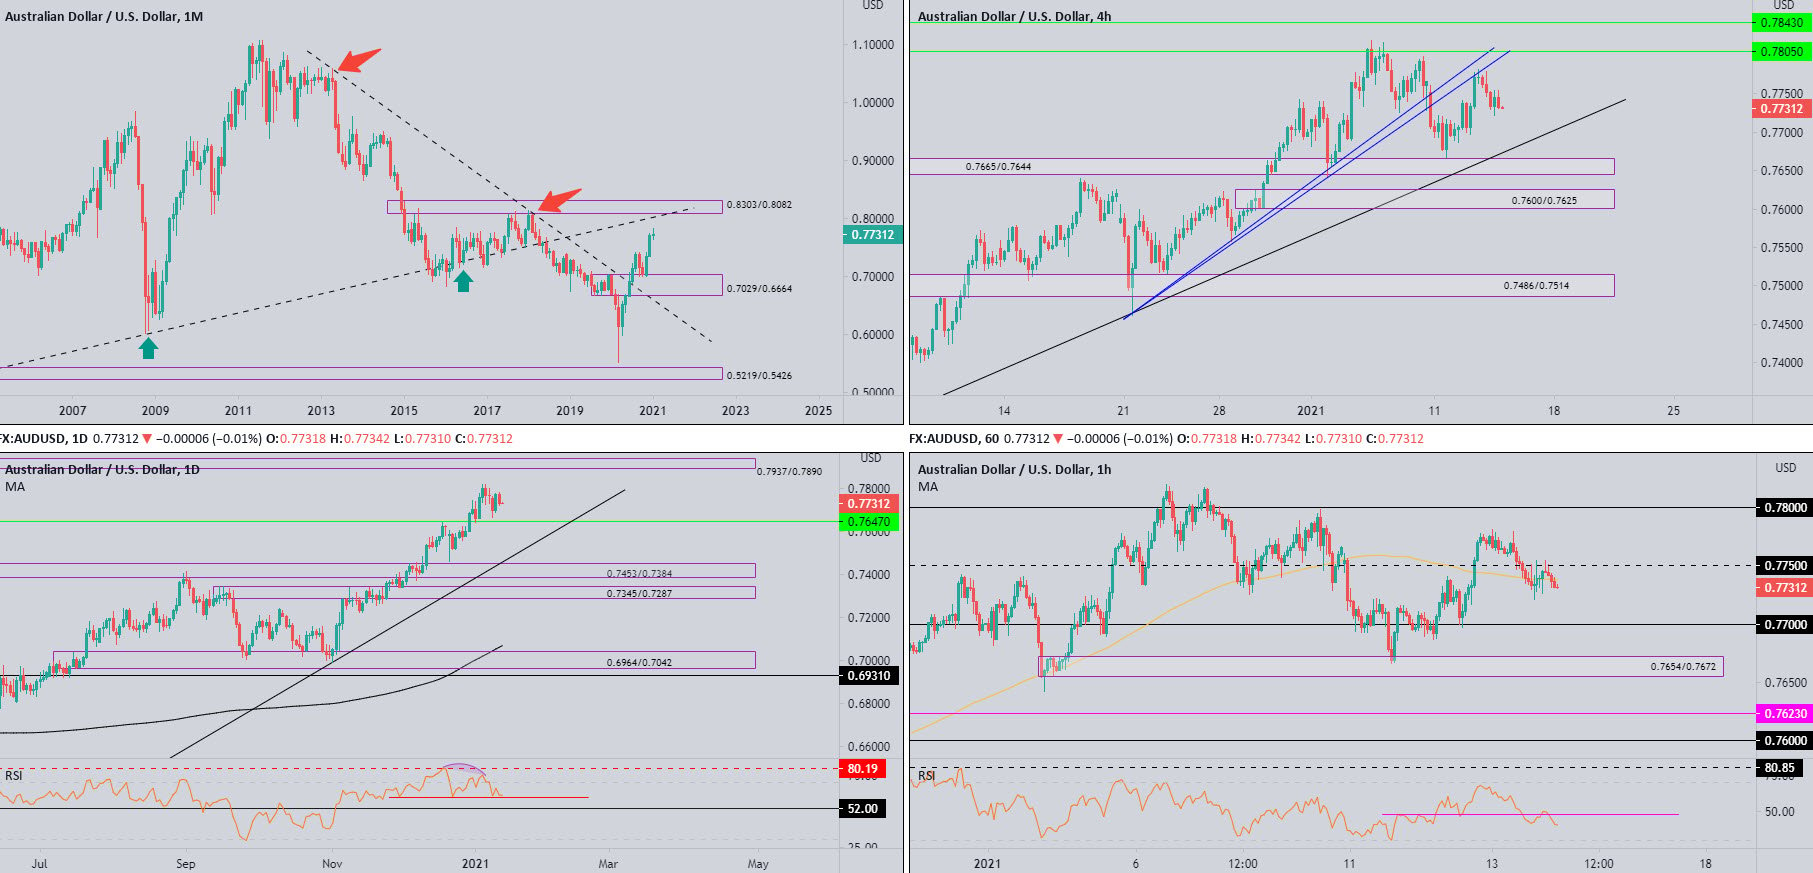
AUD/USD:
Monthly timeframe:
(Technical change on this timeframe is often limited though serves as guidance to potential longer-term moves)
Rebounding from demand at 0.7029/0.6664 (prior supply) in late 2020, buyers, according to the monthly chart, appear free to explore as far north as 0.8303/0.8082, a supply zone aligning closely with trendline resistance (prior support – 0.4776).
In terms of trend, the primary downtrend (since mid-2011) remains south until breaking 0.8135 (January high [2018]).
Daily timeframe:
Partly modified from previous analysis –
The near-retest of 0.7647 support produced a spirited bull candle Tuesday, settling a touch south of session highs. This, however, failed to spark follow-through momentum on Wednesday, finishing lower by half a percent.
Taking into account the prevailing uptrend (since March 2020), and monthly price taking aim at higher peaks, light remains fixed on supply at 0.7937/0.7890.
Momentum, as measured by the RSI oscillator, shows support at 60.00 creating a base.
H4 timeframe:
The organisation of H4 technical framework remains mostly unchanged.
Trendline resistance (prior support – 0.7461) received price action late Tuesday, sending Wednesday’s flow mildly lower. Above, technicians will also note another trendline resistance (prior support – 0.7461), as well as a resistance level at 0.7805.
Downstream, trendline support (0.6991) is visible, together with demand at 0.7665/0.7644.
H1 timeframe:
US trading on Wednesday, as you can see, gripped the lower side of 0.7750 resistance, forcing short-term trade beneath the 100-period simple moving average, currently circling 0.7738.
This unearths possible bearish flow towards 0.77, with further declines expected to demand at 0.7654/0.7672 should 0.77 cave.
It may also interest traders to note the RSI indicator retested a familiar S/R level at 48.00, unlocking a possible visit to oversold space.
Observed levels:
Partly modified from previous analysis –
Monthly price appears set to reach supply at 0.8303/0.8082; daily price also exhibits scope to reach for at least supply at 0.7937/0.7890.
In light of the above analysis, H4 trendline support could prove meaningful, an ascending base coinciding with the 0.77 level on the H1.
Another area to be watchful of is H4 demand at 0.7665/0.7644, which has H1 demand at 0.7654/0.7672 fastened to its upper side.
USD/JPY:
Monthly timeframe:
(Technical change on this timeframe is often limited though serves as guidance to potential longer-term moves)
Over the span of four years, USD/JPY carved out a descending triangle pattern between 118.66/104.62.
Although December pursued terrain south of 104.62, January recently arranged a modest comeback and is within close range of retesting 104.62.
104.62 ceding ground throws light on support from 101.70, with a break uncovering trendline support (76.15) and the descending triangle’s take-profit level at 91.04 (red).
Daily timeframe:
Partly modified from previous analysis –
Buyers and sellers continue to square off ahead of trendline resistance (111.71), following the 103.08 support rebound seen last week.
Beyond the aforesaid areas, demand is seen at 100.68/101.85 (encases monthly support at 101.70), and supply at 106.33/105.78 along with the 200-day simple moving average.
Also prominent is the RSI indicator testing resistance at 57.00, a level hampering upside since July 2020.
H4 timeframe:
After failing to find acceptance above 104.16, demand at 103.46/103.58 (prior supply) waved in price action in early trading on Wednesday (an area joined by a 50.00% retracement level at 103.49). Below demand, this lays the basis for a possible move to demand at 102.95/102.82 (prior supply).
H1 timeframe:
Mid-way through European trading on Wednesday, price entered into a narrow consolidation between the 100-period simple moving average at 103.98 and demand at 103.72/103.79 (prior supply).
Traders will note that above the aforesaid SMA value, 104 resistance is also seen, in addition to supply at 104.03/104.10 (prior demand).
Momentum, according to the RSI indicator, is struggling as the value recently drifted back beneath 50.00.
Observed levels:
The monthly timeframe shows 104.62 is likely to still be retested (closely unites with daily trendline resistance) before reaching for 101.70 support.
Room to push higher on the bigger picture could fuel a bullish assault above 104 (H1) today to take another crack at 104.16 resistance on the H4.

GBP/USD:
Monthly timeframe:
(Technical change on this timeframe is often limited though serves as guidance to potential longer-term moves)
December’s 2.5 percent push elevated GBP/USD to fresh multi-month highs and stirred trendline resistance (2.1161).
In terms of trend, however, the primary trend has faced lower since early 2008, unbroken (as of current price) until 1.4376 gives way – April high, 2018. In fact, the aforesaid high represents the next upside target on the monthly chart.
Daily timeframe:
Brought forward from previous analysis –
Resistance at 1.3755 remains a key theme on this timeframe, posted below supply at 1.3996/1.3918. Should sellers regain consciousness, Monday’s swing low at 1.3450 could be tested.
The RSI indicator has revealed a rangebound environment since November, limited by support around 47.00 and resistance at the 66.00 region.
H4 timeframe:
Arranged by way of two Fib ext. levels at 1.3693 and 1.3704, together with a resistance level at 1.3711, this area, as you can see, put a cap on upside in early trading Wednesday.
Demand at 1.3576/1.3607 is plotted below, with a break here uncovering additional demand at 1.3401/1.3446 (and associated Fibs).
H1 timeframe:
Sellers defending the lower side of 1.37 on Wednesday highlights the demand area listed on the H4 timeframe at 1.3576/1.3607, which surrounds the 1.36 level and the 100-period simple moving average at 1.3581 fixed on the H1.
Technical action on the H1 also reveals that should a break of 1.3576/1.3607 come to pass, 1.3550 support may enter the frame.
Observed levels:
Scope to travel north on the monthly timeframe, and also on the daily timeframe (at least until resistance at 1.3755), stands H4 demand at 1.3576/1.3607 (and associated H1 confluence) in position to receive any dip-buyers in the market today.

DISCLAIMER:
The information contained in this material is intended for general advice only. It does not take into account your investment objectives, financial situation or particular needs. FP Markets has made every effort to ensure the accuracy of the information as at the date of publication. FP Markets does not give any warranty or representation as to the material. Examples included in this material are for illustrative purposes only. To the extent permitted by law, FP Markets and its employees shall not be liable for any loss or damage arising in any way (including by way of negligence) from or in connection with any information provided in or omitted from this material. Features of the FP Markets products including applicable fees and charges are outlined in the Product Disclosure Statements available from FP Markets website, www.fpmarkets.com and should be considered before deciding to deal in those products. Derivatives can be risky; losses can exceed your initial payment. FP Markets recommends that you seek independent advice. First Prudential Markets Pty Ltd trading as FP Markets ABN 16 112 600 281, Australian Financial Services License Number 286354.


 Access +10,000 financial
instruments
Access +10,000 financial
instruments