Note – Charts provided by Trading View
EUR/USD:
Monthly timeframe:
(Technical change on this timeframe is often limited though serves as guidance to potential longer-term moves)
Following the break of long-term trendline resistance (1.6038) in July, and subsequent break of supply from 1.1857/1.1352 in August, buyers made an entrance heading into the close of 2020 and recorded fresh multi-month highs. This reasons additional upside towards ascending resistance (prior support – 1.1641) may be on the horizon.
The primary uptrend has been in play since price broke the 1.1714 high (Aug 2015) in July 2017.
Daily timeframe:
EUR/USD gleaned impetus on the back of USD softness Tuesday, a touch ahead of 1.2095 support. Snapping a three-day losing streak, the shared currency could attempt to invade recently printed 2021 pinnacles around 1.2349 (formed after crossing paths with a descending wedge pattern’s [1.2011/1.1612] take-profit target at 1.2318 [yellow]).
Trend on this timeframe remains decisively north, establishing a series of higher highs and higher lows since March 2020.
In terms of the RSI indicator, the value is establishing support off the 50.00 centreline.
H4 timeframe:
After bringing down trendline support (1.1602) in the latter half of last week, the beginning of this week addressed notable S/R at 1.2164, derived from as far back as January 2018. Traders will have also noted the support level joined forces with a number of Fib levels at 1.2154/1.2167.
As you can see, with the help of USD weakness, 1.2164 delivered a platform for buyers to work with on Tuesday. Resistance may show around 1.2214, with a break shining light on an ascending resistance (NOT considered a trendline resistance), drawn from December 9 trough at 1.2058.
H1 timeframe:
Tuesday favouring the euro witnessed EUR/USD unseat supply at 1.2197/1.2181 and neighbouring round number resistance 1.22. This unearths the 100-period simple moving average currently circling 1.2221, a resistance level at 1.2235 and 1.2250 resistance.
The technical assessment on the H1, therefore, implies buyers may retest the recently breached areas (1.2197/1.2181 and 1.22) and raid aforementioned resistances.
RSI action, following a retest at 42.21 support, is now within close range of overbought status. Also interesting is the indicator reveals bearish (hidden) divergence.
Observed levels:
Monthly price seeking higher ground could stir further buying on the H4 above resistance at 1.2214, which, by extension, pulls H1 action north of 1.22.
However, the threat of a dip to 1.2095 daily support remains a possibility. Buyers also have to take into account H1 RSI recently established bearish divergence, along with the H1 chart displaying a number of resistances above 1.22.

AUD/USD:
Monthly timeframe:
(Technical change on this timeframe is often limited though serves as guidance to potential longer-term moves)
Rebounding from demand at 0.7029/0.6664 (prior supply) in late 2020, buyers, according to the monthly chart, appear free to explore as far north as 0.8303/0.8082, a supply zone aligning closely with trendline resistance (prior support – 0.4776).
In terms of trend, the primary downtrend (since mid-2011) remains south until breaking 0.8135 (January high [2018]).
Daily timeframe:
The near-retest of 0.7647 support produced a spirited bull candle Tuesday, settling a touch south of session highs.
Taking into account the prevailing uptrend (since March 2020), and monthly price taking aim at higher peaks, yesterday’s bullish showing throws light on supply at 0.7937/0.7890.
Momentum, as measured by the RSI oscillator, shows that although the indicator exited overbought terrain, support at 60.00 is seen creating a base.
H4 timeframe:
Yesterday’s animated rally (following Monday’s near-test of demand at 0.7665/0.7644) places H4 within close proximity of resistance at 0.7805 and a trendline resistance (0.7461).
H1 timeframe:
Early US Tuesday saw candlesticks revisit the 0.77 level, with sellers handing the baton to buyers. Follow-through momentum ousted 0.7750 resistance and the 100-period simple moving average, achieving highs at 0.7777.
Room to test 0.78 may stir a 0.7750 retest today, drawing in fresh buyers to possibly approach 0.78 resistance.
What’s also interesting is the RSI indicator dethroned trendline resistance and is now within shouting distance of overbought levels.
Observed levels:
Monthly price appears itching to reach supply at 0.8303/0.8082 along with daily price also exhibiting scope to at least supply at 0.7937/0.7890. On top of this, H4 shows room to reach 0.7805 resistance, therefore, supporting a bullish scene should a 0.7750 H1 support retest arise.

USD/JPY:
Monthly timeframe:
(Technical change on this timeframe is often limited though serves as guidance to potential longer-term moves)
Over the span of four years, USD/JPY carved out a descending triangle pattern between 118.66/104.62.
Although December pursued terrain south of 104.62, January recently arranged a modest comeback and is within close range of retesting 104.62.
104.62 ceding ground throws light on support from 101.70, with a break uncovering trendline support (76.15) and the descending triangle’s take-profit level at 91.04 (red).
Daily timeframe:
Snapping a four-day winning streak, sellers stepped forward on Tuesday and settled a few pips off session lows.
With reference to technical levels residing on the daily chart, support is seen at 103.08, with buyers likely to welcome trendline resistance (111.71) should moves higher develop.
Beyond the aforesaid areas, demand is seen at 100.68/101.85 (encases monthly support at 101.70) and supply at 106.33/105.78 along with the 200-day simple moving average.
Also prominent is the RSI indicator testing resistance at 57.00, a level hampering upside since July 2020.
H4 timeframe:
Despite an earnest attempt to maintain a presence above support at 104.16, bids were clearly light.
Recent hours observed the pair fall sharply, taking over 104.16 and landing ahead of demand at 103.46/103.58 (prior supply). Technicians will also note the 50.00% retracement level at 103.49 is seen within the walls of the aforesaid demand.
Below demand, this lays the basis for a possible move to demand at 102.95/102.82 (prior supply).
H1 timeframe:
Tuesday’s one-sided push lower in US trading led candle action through demand at 104.03/104.10, as well as the 104 level and the 100-period simple moving average.
Retesting the lower side of 104 and 104.03/104.10 may stir a bearish scene, with Friday’s low at 103.60 and 103.50 support in the crosshairs as possible targets.
The picture coming out of the RSI indicator right now shows the value exiting oversold territory following a 44.40 support breach.
Observed levels:
The monthly timeframe shows 104.62 is likely to still be retested before reaching for 101.70 support. The daily timeframe, on the other hand, could pop either way at the moment.
The H4 timeframe is poised to test demand at 103.46/103.58, an area not only holding a 50.00% retracement within, but also the 103.50 support visible on the H1. Traders considering long positions around this area may also want to take into account that a whipsaw into nearby H1 demand at 103.39/103.26 could form.

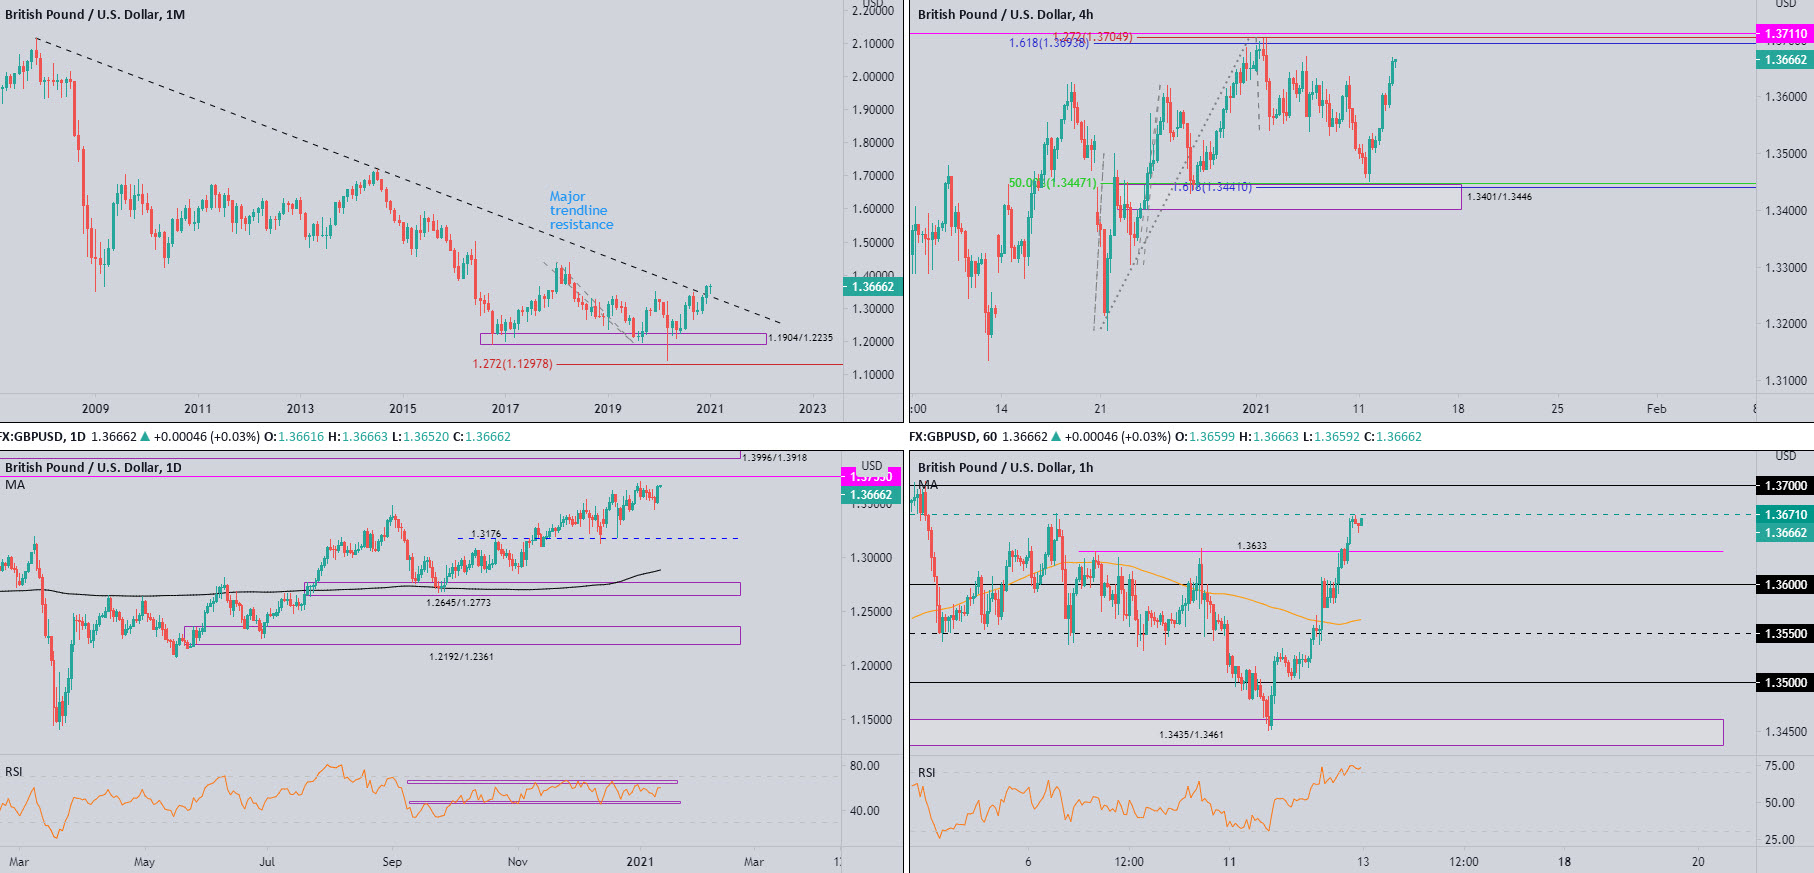
GBP/USD:
Monthly timeframe:
(Technical change on this timeframe is often limited though serves as guidance to potential longer-term moves)
December’s 2.5 percent push elevated GBP/USD to fresh multi-month highs and stirred trendline resistance (2.1161).
In terms of trend, however, the primary trend has faced lower since early 2008, unbroken (as of current price) until 1.4376 gives way – April high, 2018. In fact, the aforesaid high represents the next upside target on the monthly chart.
Daily timeframe:
Partly modified from previous analysis –
Thanks to Tuesday’s 1 percent advance, resistance at 1.3755 may enter the fight today, stationed below supply at 1.3996/1.3918.
The RSI has revealed a rangebound environment since November, limited by support around 47.00 and resistance at the 66.00 region.
H4 timeframe:
Following Monday’s near-visit of demand at 1.3401/1.3446 (and associated Fibs), buyers, as you can see, extended recovery gains Tuesday with price action now threatening to retest resistance at 1.3711 and surrounding Fib levels.
H1 timeframe:
After ousting resistance at 1.3633, price has since consolidated gains under resistance at 1.3671. An upside extension today is likely to engage any 1.37 offers.
In terms of the RSI indicator’s position, the value recently entered its overbought area which suggests upside momentum could diminish.
Observed levels:
The arrangement of H4 resistance at 1.3711 and the 1.37 level on the H1 is an area that may be on the radar for sellers today. Though bearish flow may be light, having seen monthly and daily price indicate moves to at least 1.3755 daily resistance.
DISCLAIMER:
The information contained in this material is intended for general advice only. It does not take into account your investment objectives, financial situation or particular needs. FP Markets has made every effort to ensure the accuracy of the information as at the date of publication. FP Markets does not give any warranty or representation as to the material. Examples included in this material are for illustrative purposes only. To the extent permitted by law, FP Markets and its employees shall not be liable for any loss or damage arising in any way (including by way of negligence) from or in connection with any information provided in or omitted from this material. Features of the FP Markets products including applicable fees and charges are outlined in the Product Disclosure Statements available from FP Markets website, www.fpmarkets.com and should be considered before deciding to deal in those products. Derivatives can be risky; losses can exceed your initial payment. FP Markets recommends that you seek independent advice. First Prudential Markets Pty Ltd trading as FP Markets ABN 16 112 600 281, Australian Financial Services License Number 286354.


 Access +10,000 financial
instruments
Access +10,000 financial
instruments