
Market technician’s view of charts that effect equities:
Continuing to overshadow the Australian market, traders are keeping an eye on Washington as concerns around debt ceiling negotiations have come close to a resolution, the risk of an historic default event in the first 2 weeks of June remains. However the markets last week traded as if an agreement was in place, this is the message traders will start with this week as the Australian Index
moves towards a significant breakout higher.
Large commodities players BHP, RIO, FMG remain the go to trade in the Australian market with many of the smaller players being trimmed lower for the week on poor sentiment.
The Australian banks also remain in accumulation mode as a result of increasing interest rates driving earnings higher, only the increasing provision for bad debts has cautioned some investors
appetite for further accumulation following NAB and WBC going ex div.
XJO WEEKLY
Price structure: Consolidating with the Primary UP trend remaining in place.
Following the Outside range of 3 weeks ago, again followed by an inside range 2 weeks ago now only further confirms the underlying support for large cap Australian equities, with last week also
posting a failed retest below the 7200 level. While May is traditionally a volatile month, the Index has remained resilient against the early selling pressure seen in overseas markets.
Indicator: Relative Strength 14
Relative Strength has remained above the 50 level (just) as part of the overall change in momentum. Further movements over the key 50 level towards the 70 level will remain very bullish for further gains, a cross below this important level would signal Bearish momentum and sentiment.

Comments last week: The Bullish flag noted 3 weeks ago is beginning to re-establish itself and will be confirmed only with a breakout above the 7370 level. With the Index currently sitting above a very important level, the indication of trend failure is close by with a solid close below this key level, the sellers will have gained control with the 6900 once again being the target. It is important to
note the underlying PRIMARY trend is UP.
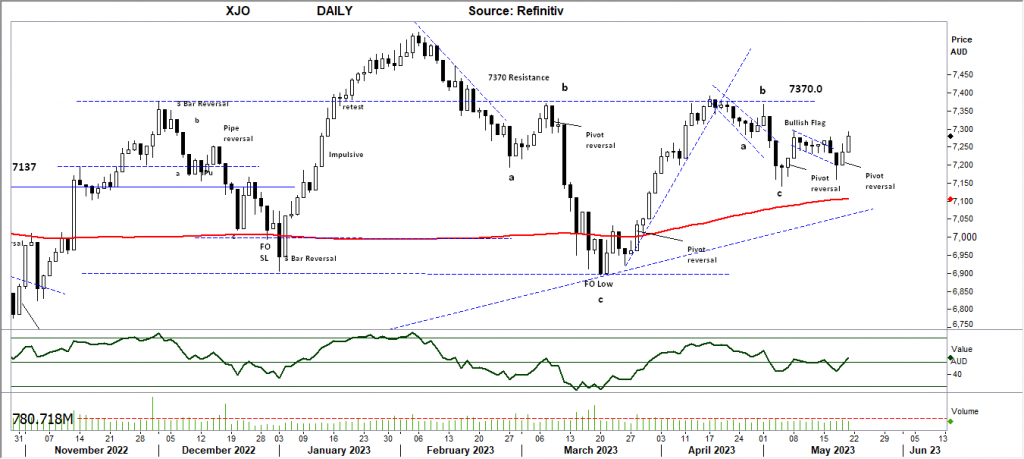
XJO DAILY
Price structure: Sentiment remains positive.
The Daily chart of the XJO shows a second Bullish Flag developing and breaking lower (bear trap) following the 1st early May bullish pivot reversal. With continuation the first target remains the
7370 level as resistance. Also of note on this chart is the 200 day simple moving average turning slightly higher with the Index value remaining above the average. Sentiment remains positive within the top weighted index components, the top 20 remaining resilient and supported and generally within very strong trading ranges. Trading volumes (not shown) remain consistent with thew 12 month average of around 750m to 780m+ per day.
Indicator: Relative Strength 14
The Relative Strength Indicator (14) turned bullish as the pivot reversal takes the indicator above the 50 level, as any reading over the key 50 level indicates price momentum remains positive. Friday’s turn higher, is a positive shift in momentum and will improve in the coming days on any further bullish price action, bearish traders should monitor this for a turn lower indicating a loss of
positive momentum.
Comments last week: Sentiment remains positive within the top weighted index components, the top 20 remaining resilient and supported and generally within very strong trading ranges. Trading volumes (not shown) remain consistent with thew 12 month average of around 750m to 780m+ per day.
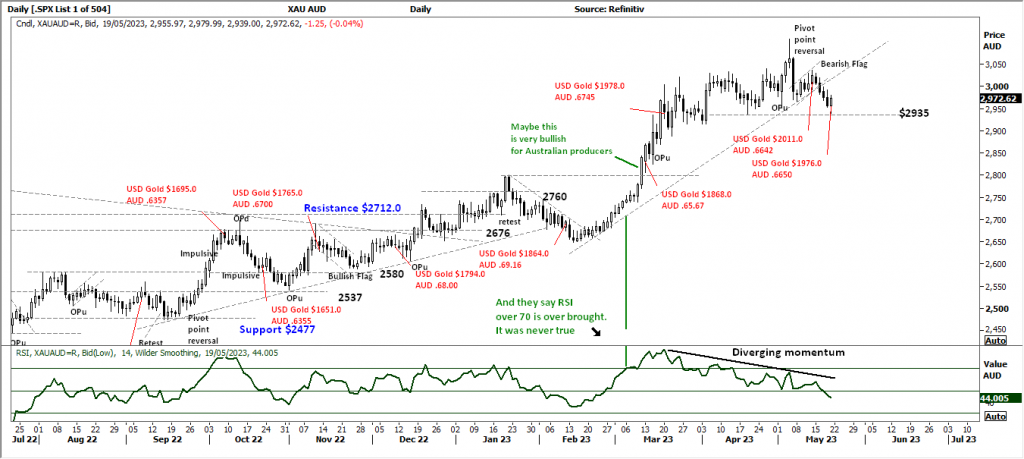
Australian Dollar Gold price: A follow up from last week. Bearish top in play.
The Australian Dollar Gold chart represents the $USD Gold price in the FX cross rate Australian Dollars. While the $USD may be increasing, should the $AUD also increase this will often lower the
cross rate value. The best results for Australian producers is a rising $USD Gold price and a falling $AUD value. The Daily chart of this shows a declining price for the Australian producers selling price, with a consolidating range between $2950 support and $3050 as resistance. The XAUAUD Gold price remains at risk of trading below support, the result will be share price pressure on the individual Gold producers.In the background against this bullish rising price for Australian producers is the rising cost of production and current grades of Ore being mined often declining as the mine life deteriorates.
Indicator: Relative Strength 14
Relative Strength has moved below the key 50 level, indicating slowing price momentum, this is typical of the RSI during price consolidations, a further move below this level would also set a further bearish tone for the underlying Gold stocks (producers).
S&P 500 WEEKLY
Price structure: Continuing Bullish consolidation
The favoured directional breakout is higher with the development of the ascending triangle in place and last week setting a valid pivot point reversal signal. Everything about this ascending pattern
within the Index suggests a breakout higher. BUT traders should be aware the underlying equities remain under pressure with only a handful including Microsoft, Nvidia, Google and Apple doing the
heavy lifting. All are dual listed in the Nasdaq and the S&P500. A breakdown of the lower side trendline would be a very bearish signal not to be ignored by longer term investors as a strong indication for the potential to see continuing weaker prices.
Indicator: Relative Strength Indicator 14
Relative Strength is traveling over the key 50 level but to remain bullish the RSI should continue to turn higher over towards the 70 level with further underlying price advances.
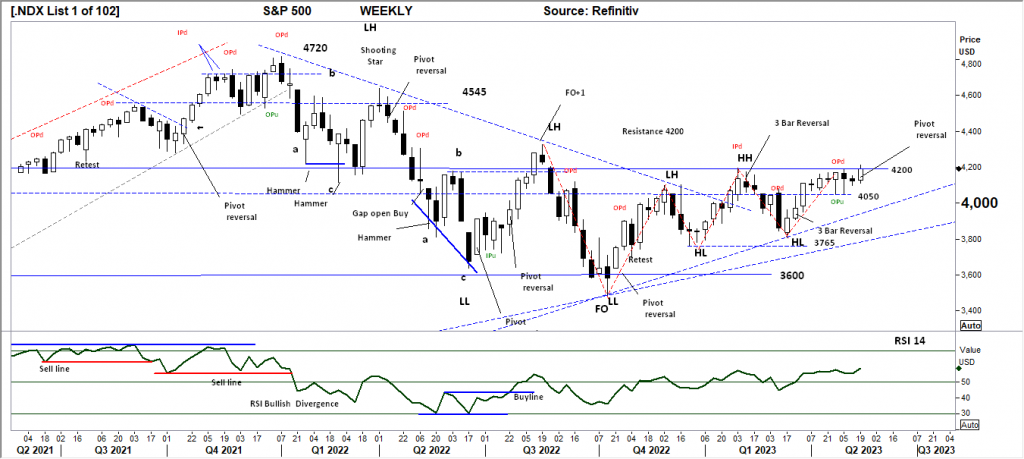
Comments from last week: Two key levels are now in play, support at 4050 and resistance of 4200. As the saying goes, never short a dull market. Or as John Bollinger added low volatility begets high volatility. The breakout from this continuing consolidation will be dramatic.
S&P 500 DAILY
Price structure: Pushing hard against resistance
The most important observation is last weeks final price action has pushed above the 2023 consolidation setting strong trading ranges. The Daily trend and the Weekly trend now align in an upward direction suggesting strong accumulation and further upside could be expected in the short daily observation. The biggest driver to have traders push the index higher remains a short squeeze in the regional banks, along with the US Government liquidity debt position being resolved.
Indicator: Relative Strength 14
Relative Strength is above the 50 level, as momentum remains positive. Further price strength for this index will see the RSI move higher above the key 50 level, with the RSI continuing to rise above the key 50 level further bullish price momentum would remain.
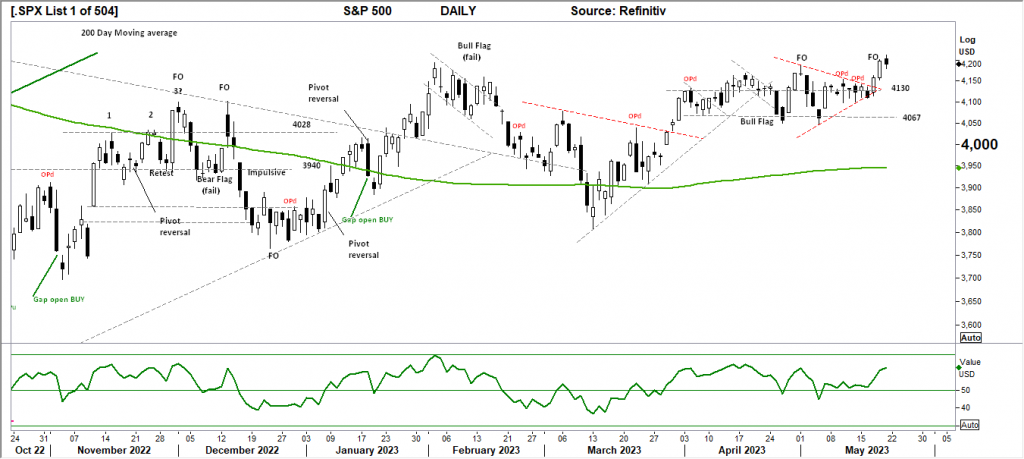
Comments from last week: Although the Weekly chart (above) resulted in a 2nd Outside period, the daily chart suggests further upside in the short term as the pennant pattern develops. This remains bullish following as the US macro scene remains somewhat buoyant, this would indicate a retest towards the 4200 level is underway again. As this pattern develops the 4067 level remains the breakdown level, a close below this level would have the sellers in control, with further downside expected.
NASDAQ DAILY
Price structure: Expanding ranges
The OPd has been overcome very quickly as the market develops. The expanding ranges in the Nasdaq often result in follow on profit taking, last Friday’s short range bar indicates the first stage
of hesitation by traders and has the potential to mark the short term high point. Immediate follow through higher is required this week, any price weakness has the potential to retest the 13,500
level for support within this current strong advance.
Indicator: Relative Strength 14
The Relative Strength Indicator moving back above the 50 level and now the 70 level, this does not indicate an over brought market, only a strong momentum move is underway with the current price breakout. This is a strong development, but should always be monitored for a decline below the 50 level indicating an underlying change in momentum.

Comments from last week: The Outside range, often a marker for a swing point to develop, the first support level to be tested remains at 13,200. The very important observation in this chart is the short daily ranges on the down close bars/candles. The underlying Primary trend remains UP. Further strength in this chart will be confirmed with a continuing close over the 13200level and the FO point (3) providing the potential for a significant short squeeze, ultimately pushing price higher.
USD Spot GOLD – DAILY: Is it a Bull market? Maybe not.
The multi year chart now represents a significant now confirmed bearish triple top in place, with the potential to retest the $1550 level should the full pattern play out over the coming months. A Bullish picture for Gold will only take place with a closing price first over the $1980 level in a relatively short time, being within the next 6 trading periods. Only this will offer some insight, last week the underlying strength began to show as the market has set a bullish 3 Bar reversal pattern at the current $1958 Resistance/support level.
Indicator: Relative Strength 14
The RSI declining now sharply back below the 50 level and showing a decline inline with the declining price pattern. Friday’s reversal has set the RSI higher but not over the key 50 level. With the RSI at risk of moving below the key 30 level, long term traders should monitor this chart for a major top in play.

Comments from last week: The Gold price retested towards the $2072 level again last week following the close below the important $2020 level. The chart now displays the 3rd spike high point, with the first attempt set during April, the second during May and last week’s daily movement again setting a high (3) with a Bearish pivot point reversal following on Thursday.
SILVER DAILY
Price structure: Bull market – Maybe not
In line with Gold – Silver has set a short term bullish pivot reversal at an important support level ($23.0). Also in line with Gold – Silver has set a 3 stage top ($26.20) to remain bullish, silver should trade and close over the $24.60 level in the coming days. Other than a bullish reversal there is no other indication that Silver should trade higher with the $21.0 support level remaining the downside
target only upon a further decline below this support area of $23.00.
Relative Strength 14
Current Relative Strength has turned lower down from the 50 level, the current movement is moving towards the 30-level, setting up a strong bearish signal with the RSI turning lower only reflects the underlying upward price momentum has been lost as the reading moves lower. A continuing move below the 50 level and lower will remain a very bearish signal in the short term.
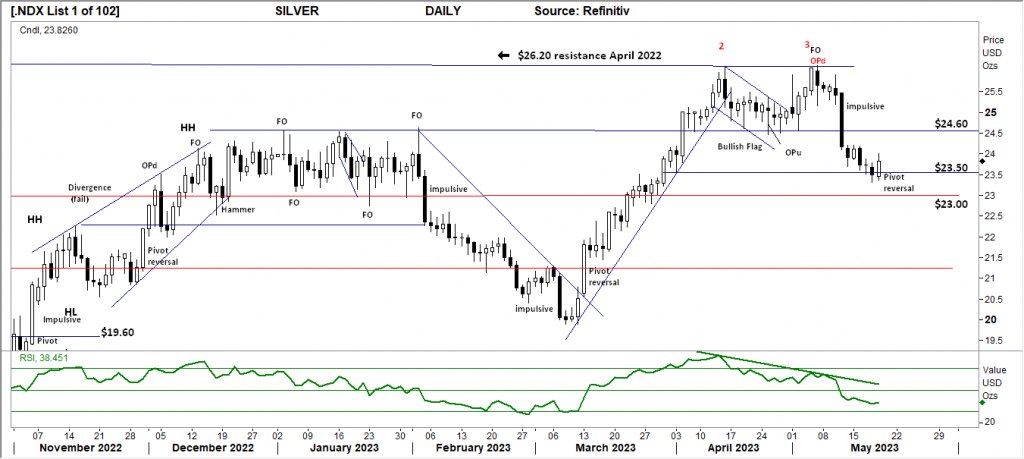
Comments from last week: The OPd a Key reversal bar/Candle has played out with a strong corrective move below the recent lows and key support level indicated at $24.50. Last Friday’s small range bar would suggest some balance coming into the market at this level. In the coming week failure to reverse higher and close above the $24.50 level would be a bearish signal for further declines. The highlighted level of $23.0 will remain the level to watch for support on any further weakness below the low of last week $23.70.
AUSTRALIAN VOLATILITY INDEX: The equities traders friend.
The current volatility remains below the important 13 level. While volatility remains at this level equities sentiment remains solidly bullish. The Volatility reading has moved higher last week but continues to remain below the 13-level indicating the 3 month forward pricing of PUT options is increasing. In general, lower to consolidating commodities prices and consolidation of equity prices is indicated when the reading remains above the 13 level. For continued support of equities, the XVI should remain subdued below the “13” level. The cost of 3month forward PUT options is decreasing from recent elevated levels. The XVI is the difference between 3-month forward pricing of ETO Options against current month. As markets anticipate events, the forward priced option volatility changes, hence as forward price changes, this “skew” in pricing is measured in this XVI. The XVI value works as an inverse observation to the underlying market.


 Access +10,000 financial
instruments
Access +10,000 financial
instruments