
Market technician’s view of charts that effect equities:
Overshadowing the Australian markets traders are keeping an eye on Washington as concerns around debt ceiling negotiations have failed to bring any resolution or give insight to a possible outcome with the risk of an historic default event in the first 2 weeks of June.
Coupled with weaker-than-expected wholesale prices data, in reality a sign of easing inflation, still failed to shield traders from ongoing concerns of a downturn ahead.
Gold mined in Australia is settled in Australian dollars, the Key for Australian Gold producers remains the US Gold price settled in Australian dollars that vary against the $USD currency, this week the AUDXAU chart is included to give some insight into the sectors performance. With the Australian banks reporting strong earnings as a result of increasing interest rates, only the increasing provision for bad debts has soured investors appetite for further accumulation following NAB and WBC going Ex Div last week.
XJO WEEKLY
Price structure: Primary UP trend remains in place.
Following the Outside range of 2 weeks ago last weeks inside range only further confirms the underlying support for Australian equities. While May is traditionally a volatile month, the Index has remained resilient against the selling pressure seen in overseas markets. Thew Bullish flag noted 3 weeks ago is beginning to re-establish itself and will be confirmed only with a breakout above the 7370 level.
With the Index currently sitting above a very important level, the indication of trend failure is close by with a solid close below this key level, the sellers will have gained control with the 6900 once again being the target. It is important to note the underlying PRIMARY trend is UP.
Indicator: Relative Strength 14
Relative Strength has remained above the 50 level (just) as part of the overall change in momentum. Further movements over the key 50 level towards the 70 level will remain very bullish for further gains, a cross below this important level would signal Bearish momentum and sentiment.
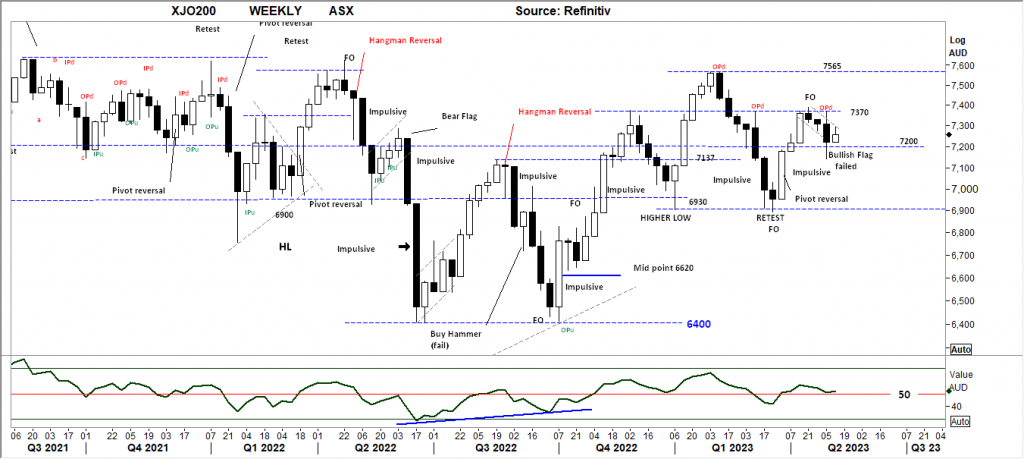
Comments last week: The Bullish flag discussed last week has failed into a new low testing below the important 7200 level, setting an OPd (Outside period down close) in the process. Weakness in commodities and the 4 major banks have moved the Index lower. However the important observation is the Index closed back above the 7200 level indicating buying support. This current price channel beginning from the 6400 low is an important development potentially leading to a retest of the 7565 level in the coming weeks. With the heavy weighting of the banks and industrials within the Index this type of Index consolidation will be heavily reflected in the top 20 index components with investors being offered a strong signal for further gains.
XJO DAILY
Price structure: Sentiment remains positive.
The Daily Chart of the XJO shows a second Bullish Flag developing following the bullish pivot reversal. Also of note on this chart is the 200 day simple moving average turning flat with the Index value remaining above the average. Sentiment remains positive within the index components, with the top 20 remaining resilient and supported within very strong trading ranges. Trading Volumes (not shown) remain consistent with thew 12 month average of around 750m+ per day.
Indicator: Relative Strength 14
The Relative Strength Indicator (14) turned bearish during the decline and will remain very bearish while below the 50 level, as any reading over the key 50 level indicates price momentum remains positive. Fridays turn higher, is a positive shift in momentum and may improve in the coming days, bearish traders should monitor this for a turn lower indicating a loss of positive momentum.

Comments last week: As part of the recovery above the 7200 level the Index viewed in the Daily time frame has set a bullish reversal in the form of a bullish pivot set last Friday. The prior decline from the 7370 level has set a measured decline in the form of an a, b, c pattern. This is a very bullish setup, with the observation of being wrong close by only with a closing price below the pivot point low at point (c).
Australian Dollar Gold Price
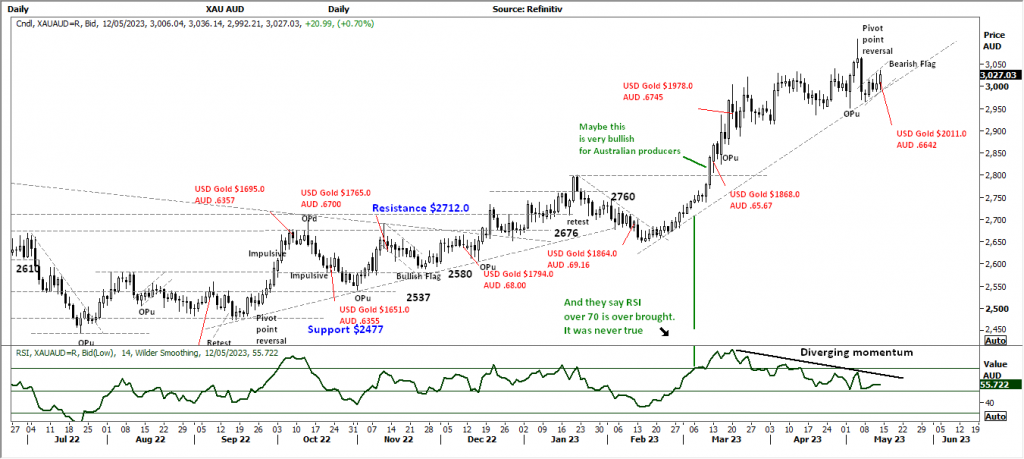
The Australian Dollar Gold chart represents the $USD Gold price in the FX cross rate Australian dollars. While the $USD may be increasing, should the $AUD also increase this will often lower the cross rate value. The best results for Australian producers is a rising $USD Gold price and a falling $AUD value.
The Daily chart of this shows a steadily rising price for Australian producers selling price, with a consolidating range between $2950 support and $3050 as resistance. In the background against this bullish rising price for Australian producers is the rising cost of production and current grades of Ore being mined often declining as the mine life deteriorates.
Indicator: Relative Strength 14
Relative Strength has moved below the key 50 level, indicating slowing price momentum, this is typical of the RSI during price consolidations, a further move below this level would also set a further bearish tone for the underlying Gold stocks (producers).
S&P 500 WEEKLY
Price structure: Continuing Bullish consolidation
Two key levels are now in play, support at 4050 and resistance of 4200. As the saying goes, never short a dull market. Or as John Bollinger added low volatility begets high volatility. The breakout either way from this continuing consolidation will be dramatic. The favoured directional breakout is higher with the development of the ascending triangle in place. Last week’s inside range Bar/candle set on very low volume (not shown) indicates a market in balance. A breakdown to the lower side would be a very bearish signal not to be ignored by longer term investors as a strong indication od continuing weaker prices.
Indicator: Relative Strength Indicator 14
Relative Strength is traveling over the key 50 level but to remain bullish the RSI should continue to turn higher over towards the 70 level with further underlying price advances.
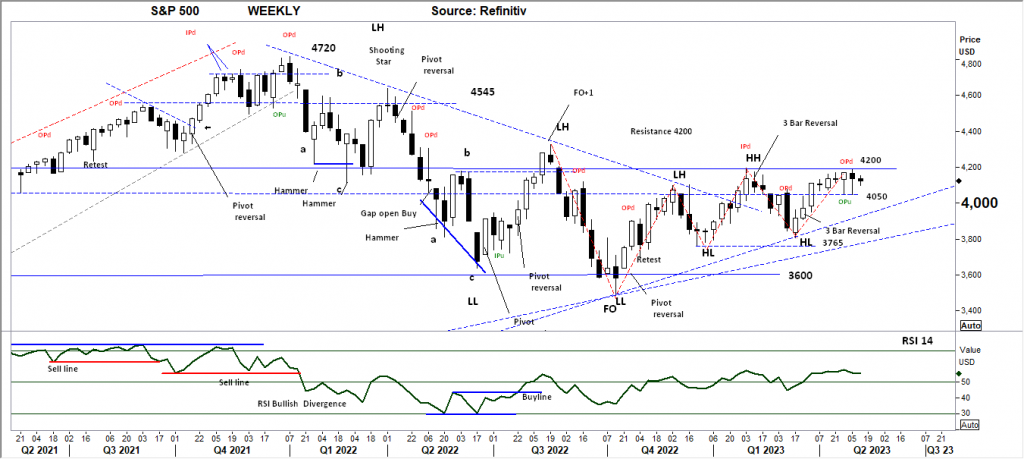
Comments from last week: The Weekly chart is currently developing a very bullish ascending triangle, with the continuing resistance level of 4200 still in play. The current 2 nd outside range may pose a short-term resistance point for Monday – Tuesday. Traders should look for a solid close over this 4200 level as a signal of price strength. With breakout comes retest, for sentiment to remain strong a retest of the 4200 must provide support. Based on the introduction notes above this chart remains very bullish.
S&P 500 DAILY
Price structure: Pushing against resistance.
Although the Weekly chart (above) resulted in a 2nd Outside period, the daily chart suggests further upside in the short term as the pennant pattern develops. This remains bullish following as the US macro scene remains somewhat buoyant, this would indicate a retest towards the 4200 level is underway again. As this pattern develops the 4067 level remains the breakdown level, a close below this level would have the sellers in control, with further downside expected. The biggest driver may be a short squeeze in the regional banks, along with the US Government liquidity debt position being resolved.
Indicator: Relative Strength 14
Relative Strength is above the 50 level, as momentum remains positive. Further price strength for this index will see the RSI move higher above the key 50 level, with the RSI continuing to rise above the key 50 level further bullish price momentum would remain.
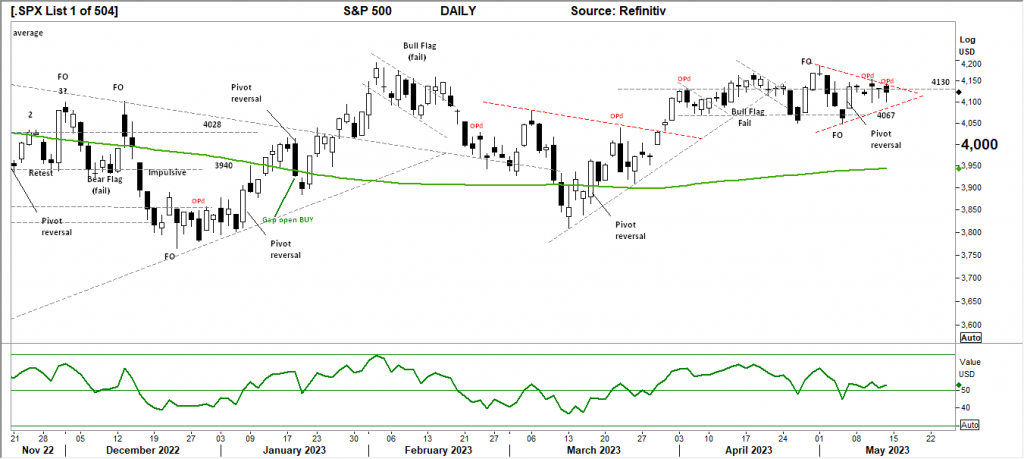
Comments from last week: Although the Weekly chart (above) resulted in an Outside period, the daily chart suggests further upside in the short-term following the FO (fake out bar) again testing below the 4067 level. This bullish pivot following some very positive developments in the US macro scene would indicate a retest towards the 4200 level is underway again.
NASDAQ DAILY
Price structure: Outside Period (range)
The Outside range, often a marker for a swing point to develop, the first support level to be tested remains at 13,200. The very important observation in this chart is the short daily ranges on the down close bars/candles. The underlying Primary trend remains UP. Further strength in this chart will be confirmed with a continuing close over the 13200level and the FO point (3) providing the potential for a significant short squeeze, ultimately pushing price higher.
Indicator: Relative Strength 14
The Relative Strength indicator moving back above the 50 level with the current price breakout. This is a strong development, but should always be monitored for a decline below the 50 level indicating an underlying change in momentum.
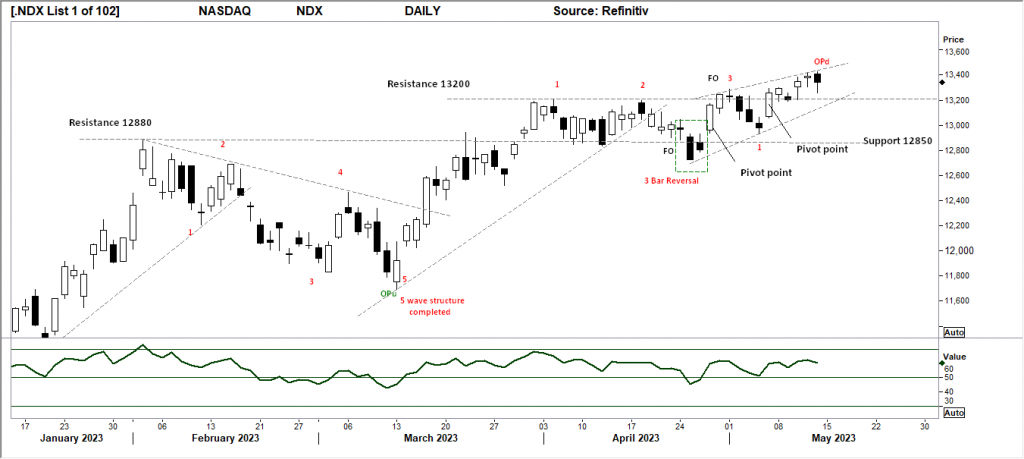
Comments from last week: The price decline last week has setup a further bullish pivot point pattern with a solid close over the 13,200 level, the pivot point low set last Thursday also indicates a higher low in place. The underlying primary trend is UP with the expectation of further gains within the current price structure.
USD Spot GOLD – DAILY: Is it a Bull market? Maybe not.
The Gold price retested towards the $2072 level again last week following the close below the important $2020 level. The chart now displays the 3 rd spike high point, with the first attempt set during April, the second during May and last week’s daily movement again setting a high (3) with a Bearish pivot point reversal following on Thursday. The multi year chart now represents a significant now confirmed bearish triple top in place, with the potential to retest the $1550 level should the full pattern play out over the coming months. A Bullish picture for Gold will only take place with a closing price over the $2072 level in a relatively short time, within the next 6 trading periods will offer some insight to the underlying strength.
Indicator: Relative Strength 14
The RSI declining sharply back towards the 50 level and showing a diverging decline against the consolidating price pattern is a normal occurrence in price consolidation patterns. With the RSI at risk of moving below the key 50 level, traders should monitor this chart for a short term top in play.
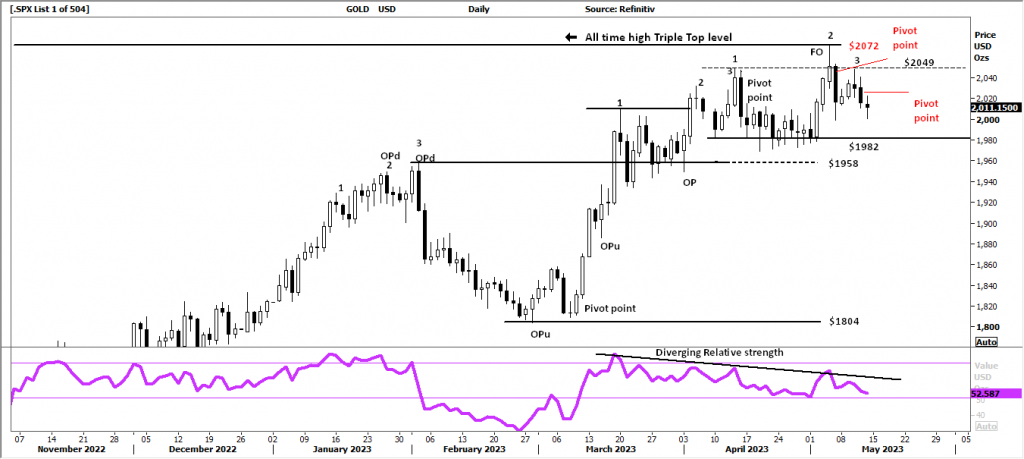
Comments from last week: The Gold price retested towards the $2072 level last week following the close over the important $2020 level, this is the 3 rd attempt at this level, with the first attempt set during August 2020, the second during March 2022 and last week’s daily movement again setting a high with a Bearish pivot point reversal following on Friday.
SILVER DAILY
Price structure: Bull market – Maybe not
The OPd a Key reversal bar/Candle has played out with a strong corrective move below the recent lows and key support level indicated at $24.50. Last Friday’s small range bar would suggest some balance coming into the market at this level. In the coming week failure to reverse higher and close above the $24.50 level would be a bearish signal for further declines. The highlighted level of $23.0 will remain the level to watch for support on any further weakness below the low of last week $23.70.
Relative Strength 14
Current Relative Strength has turned lower from over the 50 level, the current movement is moving towards the 30-level, setting up a strong bearish signal with the RSI turning lower only reflects the underlying upward momentum being lost and turning lower. A continuing move below the 50 level and lower would be very bearish signal in the short term.

Comments from last week: Silver has again failed at the important $26.20 level, the third attempt to cross this level has failed with an OPd Outside range, the whole structure remains well short of the $30 highs set during February 2021. The high close within the range last Friday will need to follow thru in the coming days to help traders remain positive in the current price structure.
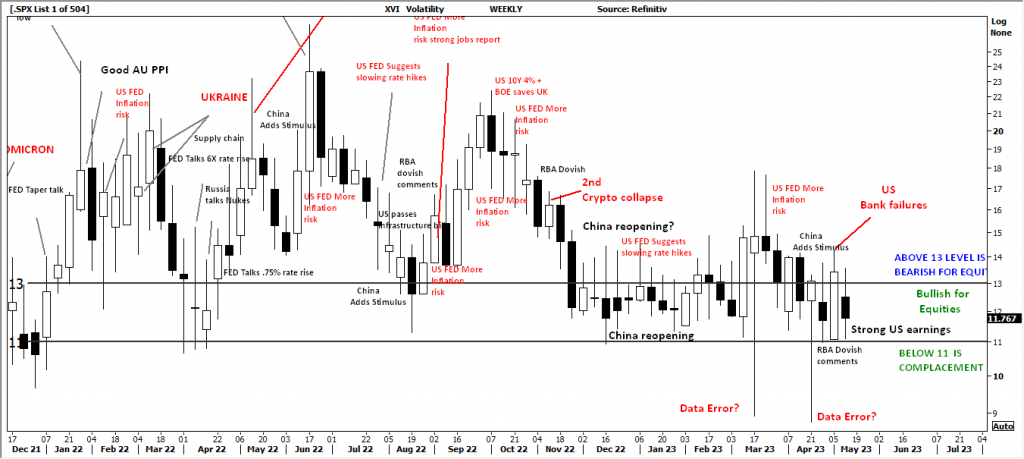
AUSTRALIAN VOLATILITY INDEX: The equities traders friend.
The current volatility remains below the important 13 level. While volatility remains at this level equities sentiment remains solidly bullish.
The Volatility reading has moved lower last week and continues to remain below the 13-level indicating forward pricing of PUT options is declining.
In general, lower to consolidating commodities prices and equity prices or consolidation of equity prices is indicated as the reading remains above the 13 level.
For continued support of equities, the XVI should remain subdued below the “13” level.
The cost of 3month forward PUT options is decreasing from recent elevated levels.
The XVI is the difference between 3-month forward pricing of ETO Options against current month.
As markets anticipate events, the forward priced option volatility changes, hence as forward price changes, this “skew” in pricing is measured in this XVI.
The XVI value works as an inverse observation to the underlying market.


 Access +10,000 financial
instruments
Access +10,000 financial
instruments