
Forex traders use several approaches to determine whether to buy or sell a currency pair. Fundamental analysis uses economic data and news to predict whether a pair will rise or fall.
Technical analysis, on the other hand, focuses on charts to identify potential entry and exit points. It entails using indicators like the average directional index (ADX) and MACD to determine whether to buy or sell a forex pair.
What are spinning top candlestick patterns?
There are two main types of candlestick patterns in price action analysis: reversal and continuation. Reversal chart patterns like head and shoulders and double-top usually signal that an existing trend is about to end. The same is true with reversal candlestick patterns like Doji, morning star, and shooting star.
Continuation chart and candlestick patterns like a bullish flag, cup, handle, and three white soldiers provide signals that a forex pair will continue moving in the existing trend.
A spinning top candlestick is a reversal pattern that sends a sign that an existing trend is about to end and that a new one is forming. It is not as popular as other forex candlesticks like Doji and morning star.
The spinning top candlestick is made up of a small body that has long upper and lower shadows, as shown in the chart below.
 Source: MT4
The pattern implies that there is a battle going on between buyers and sellers. As such, it is a sign that there is indecision between bulls and bears. This explains why the upper and lower shadows are relatively long while the body is small.
How a spinning top candlestick pattern forms
There are two types of spinning top candlestick patterns: bearish and bullish. A bullish one forms when a forex pair is in a bearish trend. As it drops, the pair then closes at a higher price than where it opened, as shown in the chart below. On the other hand, a bearish spinning top forms when a candlestick chart is in an upward trend and then closes at a lower price than where it opened.

How to use the spinning top candlestick pattern
A spinning top pattern is usually a sign that an existing trend is fading and that a new one in the opposite direction is starting. Therefore, after spotting the pattern, traders start preparing to enter a trade in the opposite direction.
A bracket order is one of the best approaches to using the pattern. A bracket order comprises two pending orders, each protected by a stop-loss and a take-profit.
In the case of a bullish spinning candlestick pattern, a trader puts a sell-stop slightly below the lower shadow and a buy-stop above the upper shadow. They then place a stop-loss and a take-profit based on their risk-reward ratio.
As such, if the reversal happens, the buy-stop trade is executed followed by the take-profit. A good example of this is shown in the chart below. In it, a trader would place a buy-stop at 135.80, which is the upper side of the spinning top pattern, and a sell-stop at 134.96, and then protect them.
 Source: MT4
The candlestick chart below shows how to use a bearish spinning top pattern. In it, one way is to place a sell-stop at the lower shadow at 137.41 and a buy-stop at 137.71 and then protect the two. If the pattern works as it should, the sell-stop will be executed and the trader will make money as the price retreats.
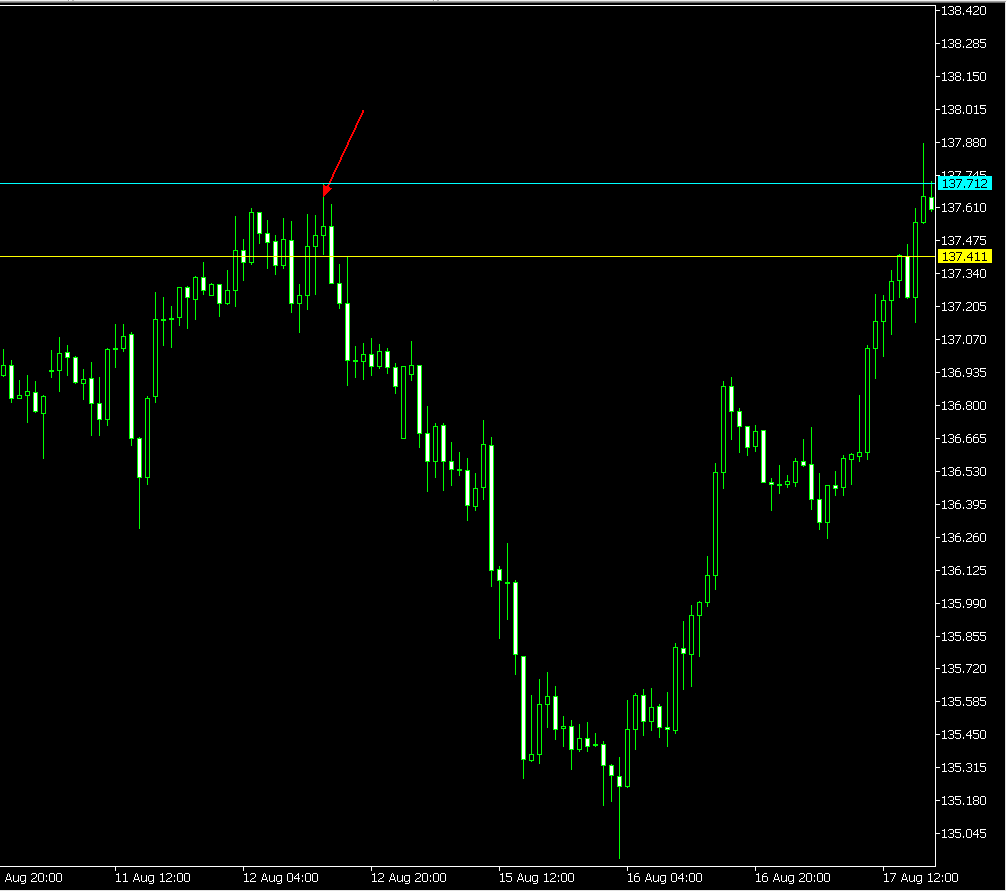 Source: MT4
Summary
A spinning top candlestick pattern is a rare sign of a reversal in forex trading. This article has looked at how the pattern forms and explained how to use it. Professional traders use other approaches along with these patterns to make decisions. For example, most of them use multi-timeframe analysis to confirm the overall direction of a trend while others use it in combination with technical indicators.


 Access +10,000 financial
instruments
Access +10,000 financial
instruments