
EUR/USD:
Monthly timeframe:
(Technical change on this timeframe is often limited though serves as guidance to potential longer-term moves)
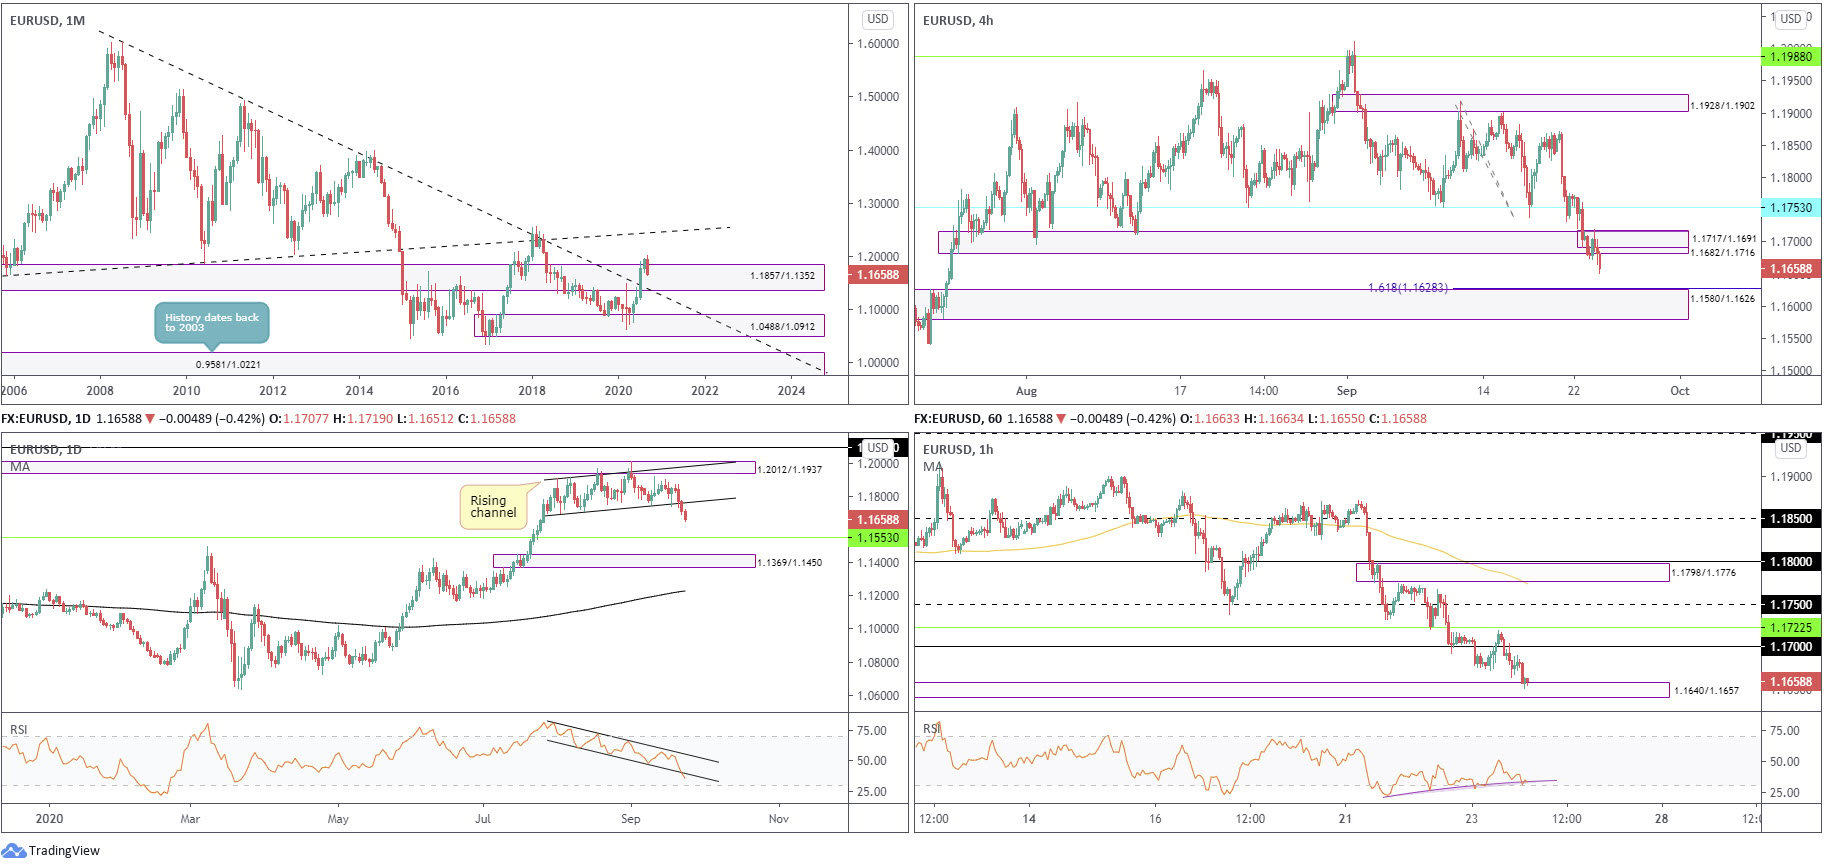
August saw the euro nudge to a fourth successive monthly gain against the US dollar, adding nearly 1.5 percent.
The move toppled supply from 1.1857/1.1352 and extended space north of long-term trendline resistance (1.6038), arguing additional upside may be on the horizon, targeting trendline resistance (prior support – 1.1641). Despite this, the primary downtrend (since July 2008) remains intact until 1.2555 is engulfed (Feb 1 high [2018]).
Trading in September is down more than 2.3 percent.
Daily timeframe:
Wednesday watched the euro register a fourth successive daily loss against the dollar, extending space under channel support from 1.1695. The pair is tipped for more underperformance as support is not expected to surface until reaching 1.1553, with a break uncovering clear demand at 1.1369/1.1450.
With respect to the RSI oscillator, the line pushed through the lower limit of a (near) two-month descending channel formation, poised to perhaps greet oversold territory.
H4 timeframe:
Price voyaged through demand at 1.1682/1.1716 Wednesday, which has brought demand at 1.1580/1.1626 and a 161.8% Fib ext. level at 1.1628 into the line of fire.
H1 timeframe:
After retesting 1.17, sellers arrived at demand from 1.1640/1.1657, an area drawn from July. Although the RSI exhibits bullish divergence, the aforesaid demand is likely to offer little in terms of upside movement, owing to where we trade on the bigger picture. The 1.16 level is next in line should we probe lower, reinforced by a nearby support at 1.1589.
Structures of Interest:
Partially altered from previous analysis –
Monthly price is struggling to sustain gains north of supply at 1.1857/1.1352, while daily price indicates further losses are in the offing after breaking channel support. H4 demand at 1.1682/1.1716 lost its grip yesterday, throwing light on another layer of demand at 1.1580/1.1626.
Although H1 is testing demand at 1.1640/1.1657, the monthly, daily and H4 timeframes indicate any upside could be short-lived. A retest at 1.17, therefore, would likely interest sellers, as may a break of the H1 demand.
AUD/USD:
Monthly timeframe:
(Technical change on this timeframe is often limited though serves as guidance to potential longer-term moves)
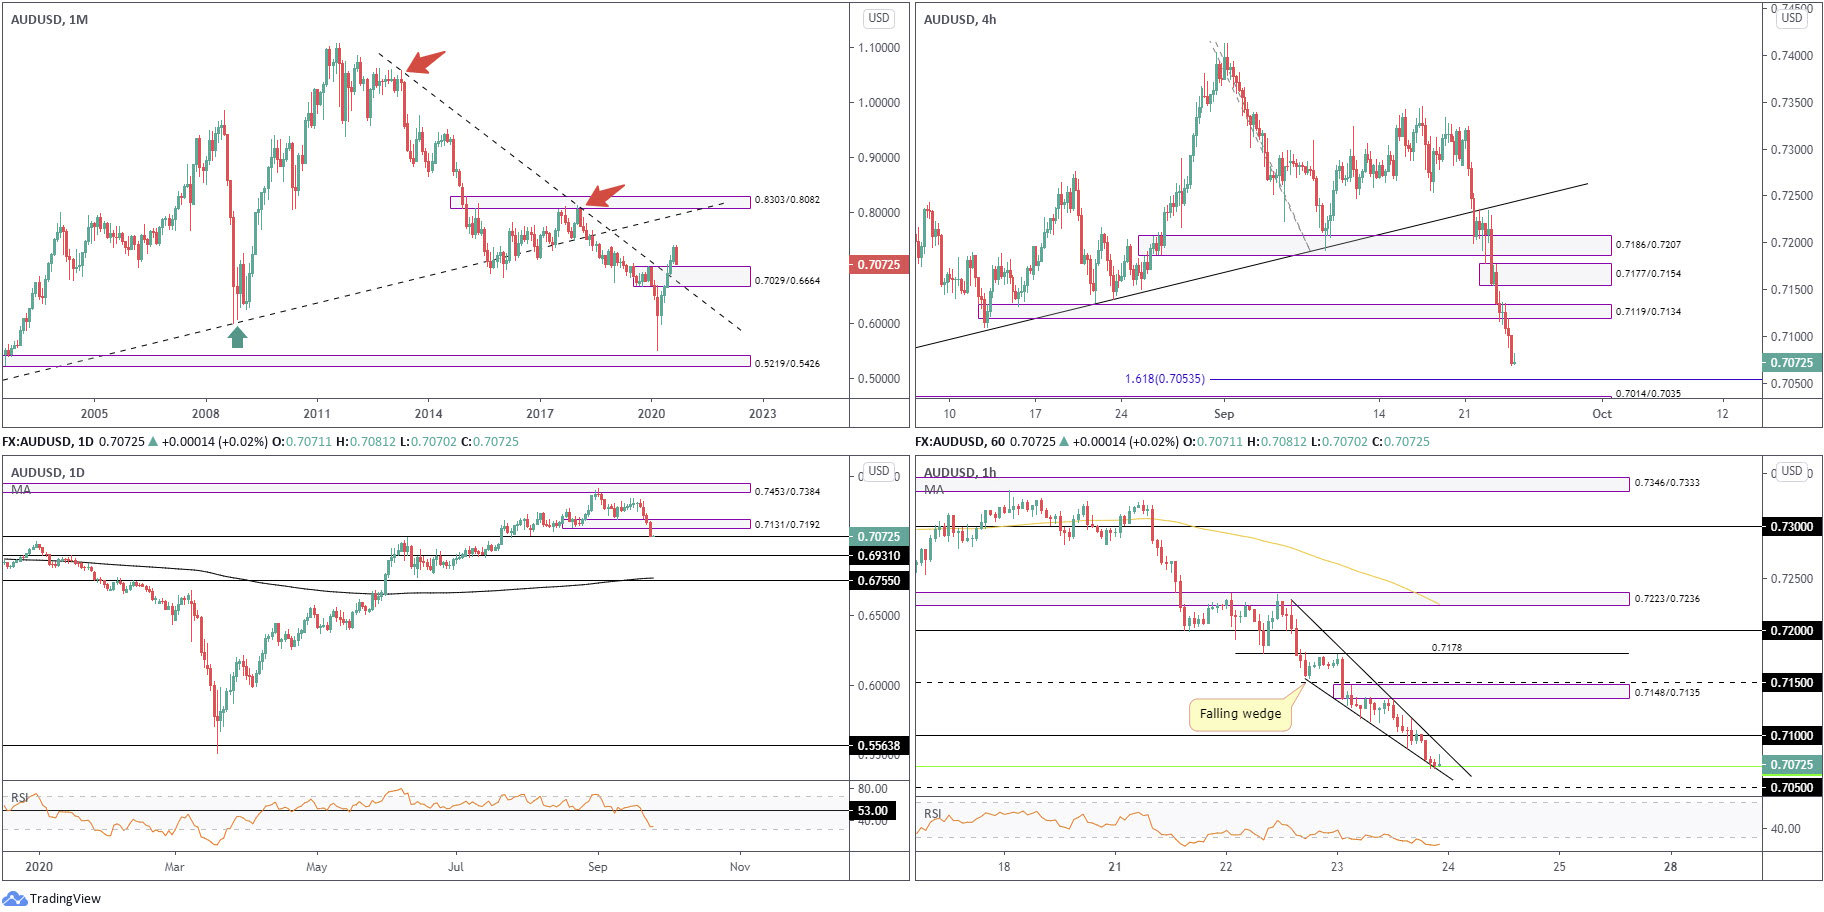
August’s 3.3% gain extended space north of supply at 0.7029/0.6664 and long-term trendline resistance (1.0582). Technically, buyers appear free to explore as far north as 0.8303/0.8082 in the coming months, a supply zone aligning closely with trendline resistance (prior support – 0.4776). The month of September, however, is on track to snap a five-month winning streak and retest 0.7029/0.6664 as demand, currently trading down 4.2 percent.
While price has indeed removed trendline resistance and supply, traders might still want to take into account the primary downtrend (since mid-2011) remains south until breaking 0.8135 (January high [2018]).
Daily timeframe:
Partially altered from previous analysis –
AUD/USD pushed through a fourth successive daily loss on Wednesday, prizing action beyond demand at 0.7131/0.7192 (a drop-base-rally area) to test support at 0.7067.
The trend, according to the daily timeframe, has emphasised a positive tone since bottoming in late March. Traders may also recognise the RSI trades south of 53.00, a clear S/R level since October 2019, and is on track to test oversold space.
H4 timeframe:
Demand at 0.7119/0.7134 failed to put up much of a fight on Wednesday, liberating sellers to lows at 0.7067.
Further losses may force a test at the 161.8% Fib ext. level at 0.7053, with demand at 0.7014/0.7035 welcoming price should additional selling take over.
H1 timeframe:
0.7178 resistance capped upside in the early hours of Wednesday, followed by a sharp slump through 0.7150 support.
After dethroning 0.71, the pair landed at support from 0.7070. Technical pattern traders may also wish to acknowledge we have a falling wedge configuration taking form, drawn from 0.7229/0.7154.
With reference to the RSI, we are trekking within oversold territory right now.
Structures of Interest:
Daily support recently making a show at 0.7067, along with H1 action also receiving support at 0.7070, could invite a recovery today. Should H1 breakout of the current falling wedge (a reversal signal) and take on 0.71, intraday follow-through buying to supply at 0.7148/0.7135 would not be a surprise.
Failure to rally from current price, nonetheless, H4 demand at 0.7014/0.7035 is likely to make an entrance, a zone that aligns with the upper border of monthly demand at 0.7029.
USD/JPY:
Monthly timeframe:
(Technical change on this timeframe is often limited though serves as guidance to potential longer-term moves)
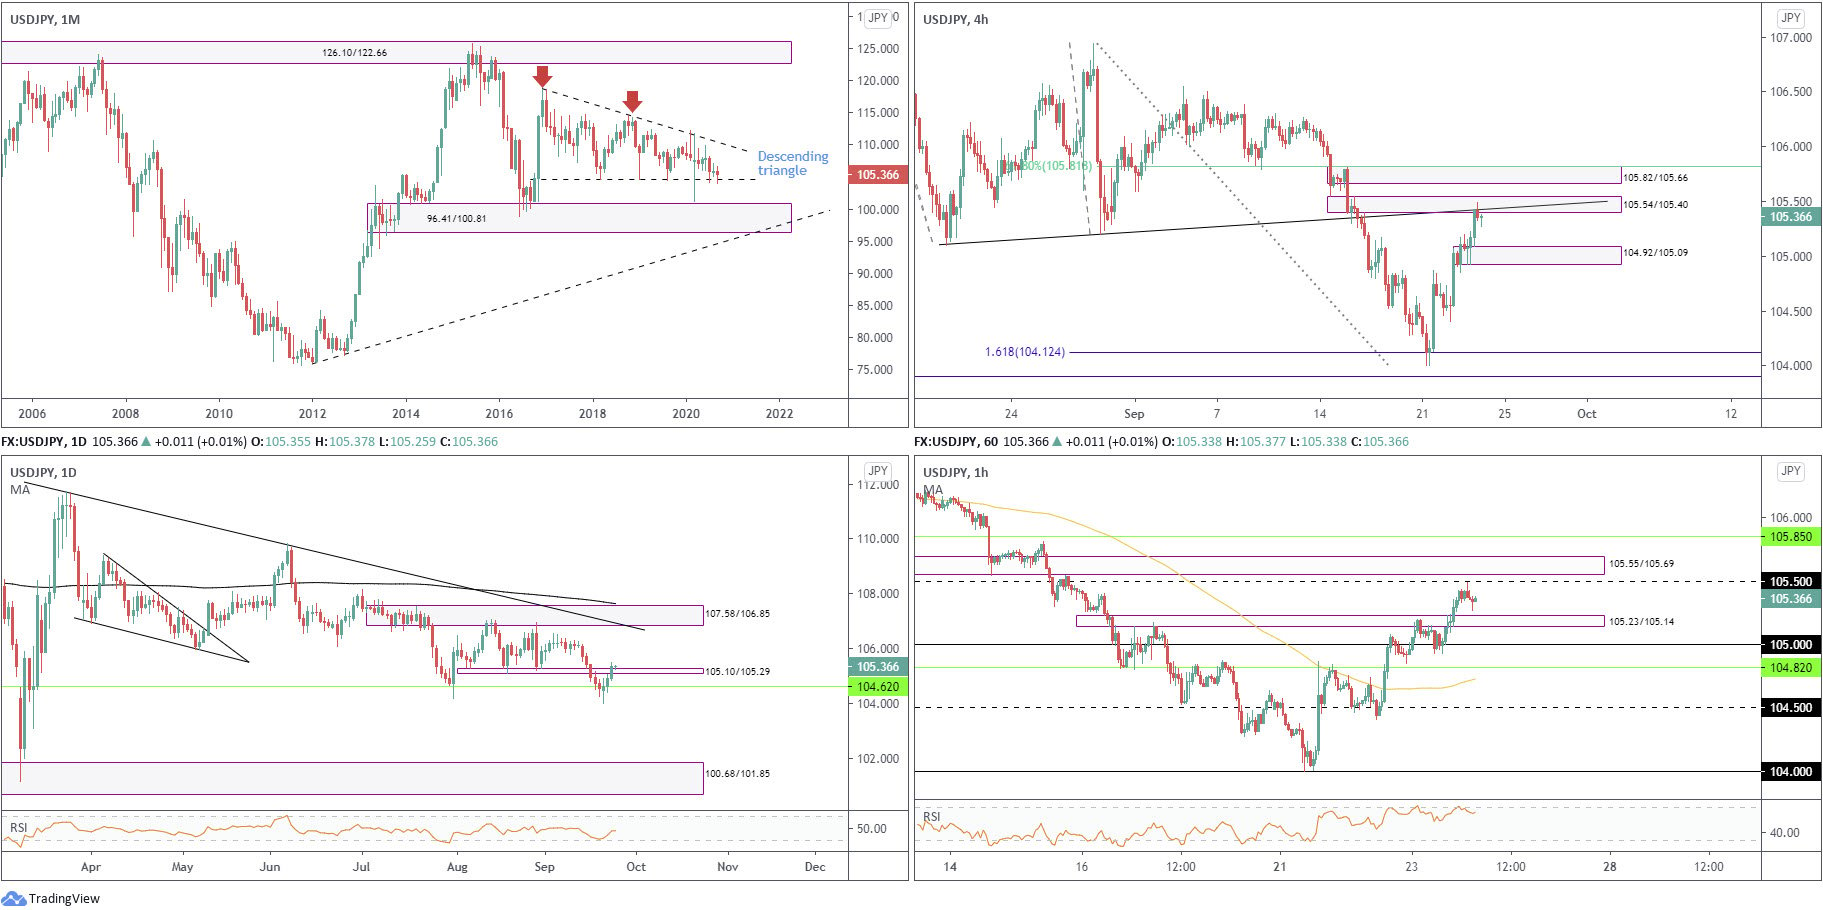
Since kicking off 2017, USD/JPY has been carving out a descending triangle pattern between 118.66/104.62. As you can see, price is currently testing the lower boundary of the aforesaid pattern.
Areas outside of the noted triangle can be seen at supply from 126.10/122.66 and demand coming in at 96.41/100.81.
Daily timeframe:
Extending recovery gains off monthly support at 104.62 (the lower boundary of the monthly descending triangle) shows price now embarking on the possibility of further upside beyond supply at 105.10/105.29.
The RSI recently bottomed ahead of oversold levels and is now on track to test 50.00.
H4 timeframe:
Early week staged an impressive recovery off a 161.8% Fib ext. level at 104.12. Wednesday’s third successive daily advance witnessed price action address supply at 105.54/105.40, an area sharing space with a trendline resistance (prior support – 105.10).
Other areas of interest on the H4 chart are supply at 105.82/105.66 and a 61.8% Fib level at 105.81. In addition, demand can be seen at 104.92/105.09, an area where a decision was made to initially push for current supply.
H1 timeframe:
105.23/105.14 supply entered play in early trading Wednesday, squeezing out mild downside, enough to pull off a 105 retest heading into London. US traders entered a bullish phase and toppled the noted supply to test peaks just ahead of 105.50 resistance (sheltered closely by a supply at 105.55/105.69 [prior demand]).
The RSI indicator, in response to recent buying, has been fading overbought levels.
Structures of Interest:
While the H4 supply at 105.54/105.40 intersects with trendline resistance, downside pressure from this region is unlikely to be anything to write home about. This is largely due to daily price recently upsetting supply at 105.10/105.29 from monthly support at 104.62 (lower base of the monthly descending triangle).
With that in mind, a retest at 105.23/105.14 (demand) on the H1 could be a setup that invites strong buying to potentially derail 105.50 resistance, and test supply at 105.55/105.69 (fastened to the lower edge of H4 supply at 105.82/105.66).
GBP/USD:
Monthly timeframe:
(Technical change on this timeframe is often limited though serves as guidance to potential longer-term moves)
Leaving trendline resistance taken from 2.1161 unopposed, September currently trades lower by 4.8 percent, on track to retest trendline support (prior resistance – 1.7191).
Interestingly, the primary trend has faced lower since early 2008, unbroken until 1.4376 gives way – April 2 high 2018.
Daily timeframe:
Partially altered from previous analysis –
Shaped by way of four successive bearish candles out of supply at 1.3021/1.2844, price is now seen engaging with the 200-day simple moving average at 1.2719, housed within demand at 1.2645/1.2773.
Violating the aforesaid demand potentially charts things back to another demand placed at 1.2192/1.2361.
The RSI indicator is currently drawing up a bottoming phase ahead of oversold levels.
H4 timeframe:
Demand at 1.2646/1.2685 accepted price action on Wednesday after support at 1.2742 abandoned its position.
The reaction out of the aforesaid demand had price approach peaks at 1.2777, though price wrapped up the session back under 1.2742.
H1 timeframe:
Despite a number of downside attempts, buyers defended the 1.27 level Wednesday and tested 1.2750 resistance along with nearby trendline resistance (1.2966), which, as you can see, held ground.
Structures of Interest:
Recognising monthly price showing some room to push lower until testing trendline support (around 1.26ish), and daily price struggling to print anything of meaning out of demand at 1.2645/1.2773 echoes a bearish vibe. In conjunction with the higher timeframes, the failure to overthrow H4 resistance at 1.2742 and H1 reacting from trendline resistance could see intraday flow probe beyond 1.27 today, with H1 support at 1.2649 targeted, followed by the 1.26 level.

DISCLAIMER:
The information contained in this material is intended for general advice only. It does not take into account your investment objectives, financial situation or particular needs. FP Markets has made every effort to ensure the accuracy of the information as at the date of publication. FP Markets does not give any warranty or representation as to the material. Examples included in this material are for illustrative purposes only. To the extent permitted by law, FP Markets and its employees shall not be liable for any loss or damage arising in any way (including by way of negligence) from or in connection with any information provided in or omitted from this material. Features of the FP Markets products including applicable fees and charges are outlined in the Product Disclosure Statements available from FP Markets website, www.fpmarkets.com and should be considered before deciding to deal in those products. Derivatives can be risky; losses can exceed your initial payment. FP Markets recommends that you seek independent advice. First Prudential Markets Pty Ltd trading as FP Markets ABN 16 112 600 281, Australian Financial Services License Number 286354.


 Access +10,000 financial
instruments
Access +10,000 financial
instruments