
Liquidity remains high in Global markets built on cheap money underpinned by the strong jobs reports, a Global economic recovery is underway.
The Nasdaq last week did not confirm an all-time high in line with the Dow and S&P 500, suggesting Tech stocks are now lagging the industrials, this should be monitored in the coming weeks for further divergence.
From a technical perspective there are some early sell divergence signals in all of the Indices’, these only signal caution and can precede the markets’ bullish exhaustion.
Exhaustion signals can also precede simple price consolidation in the form of a trading range.
The key as always is the weekly price chart, this is where Primary trends are acknowledged for beginning and ending. Weekly reversal patterns often take many weeks to form. At the moment the Technicals do not show a top.
Gold and Silver paid the price for a strong NFP report last Friday, with current support levels broken, Gold tests the long term Weekly trendline.
XJO WEEKLY
Price structure
With a strong finish at an all-time high, the Index looks set to reach the first target at 7715. Last week’s breakout is significant following 8 weeks of consolidation above the 7197 (7200) level. Any price retracement would immediately put the trader on alert for a break of the Trendline and support at 7200. The underlying Primary UP trend has resumed.
Indicator: Relative Strength 14
RSI has turned higher, negating the potential momentum divergence signal. The RSI should be monitored for a potential move below the key level of 70 to show a shift in price momentum. RSI can remain above the 70 level for many weeks as it does not necessarily indicate an “over-brought” signal.

Comments from last week: The 7406 point high of 7 weeks ago was briefly exceeded last week with the close last week at 7392 being inside this previous high, this constitutes a “fake out” move. The sellers are waiting above the 7406 level. The Fake Out move often precedes some form of price consolidation as buyers and sellers regroup. The support level of 7197 (7200) remains strong with 9 weeks of trading above this key level.
XJO DAILY
Price structure
The daily chart shows the strength of the buyers, during the past week with no day trading below the low of the previous day with the market closing on the high of the week. 7450 will be the level to defend should price weakness enter this strong price movement.
Indicator: Relative Strength 14
The Relative Strength Indicator 14 shows an increase of price momentum, sometimes this indicator shows the obvious, and in this case would be monitored for a close below the 70 level as the first indicator of a loss of underlying momentum.
Indicator: VOLUME
Trading volumes have decreased suggesting the market is not trading on the fear of missing out, traders should read this signal as a distribution warning.
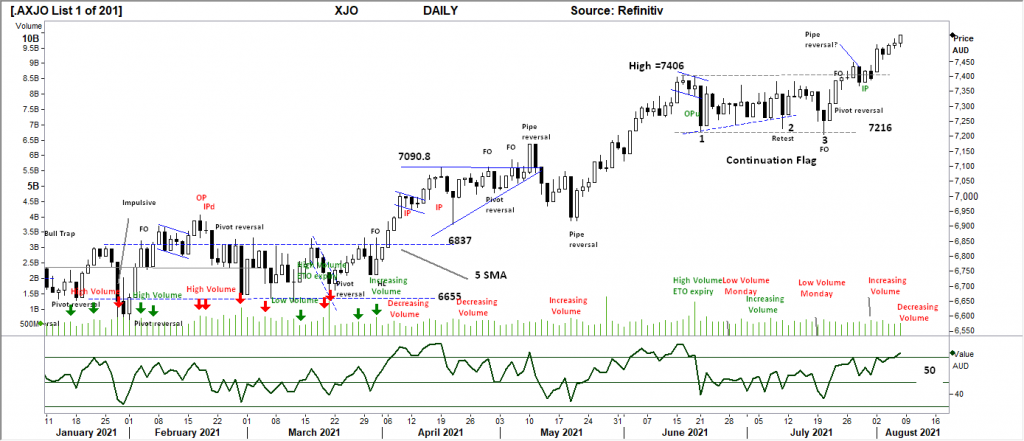
Comments from last week: Last Tuesday – Wednesday the Index set a pipe reversal, the most important observation is last Thursday’s “retest” of the high but failing to follow through higher. This will be classified as a “Bull trap” with the potential to retest the 7216 level and will be viewed as a continuing consolidation flag. The first indication of Buyers re-entering the market will be a close over the 7406 level.
S&P 500 WEEKLY
Price structure
With the 4240 level successfully defended 3 weeks ago the Index has pushed on to set an all-time high, the construction of this index is based on the industrials. The listing of some large tech stocks (AAPL, AMZN and others) having declined for the week have not influenced the overall all time high finish. Traders would monitor the 4240 level as the continued support level to hold.
Indicator: Relative Strength Indicator 14
The Relative Strength Indicator has re-emerged and remains a developing divergence sell signal. The Sell line is shown around the 65 level. It can also be observed that the RSI can track sideways as price consolidation takes place.
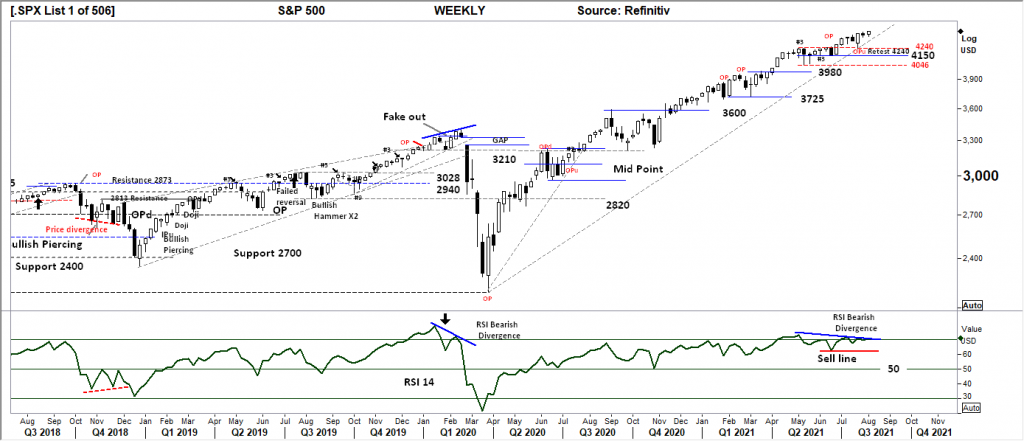
Comments from last week: The small range of last week is not a bullish signal for further gains. With the OPu from 2 weeks ago remaining the dominant range to overcome. 4240 remains the first level of support with 4150 the real key support in this current range. There is no topping pattern in this chart, but traders should monitor the support levels in the coming weeks.
S&P 500 DAILY
Price structure
The 4394 daily support level has held early in the trading week, supporting the breakout higher. With the trendline remaining tentative, traders would monitor a potential retest if the Trendline should sideways consolidation take place. For the coming week look for a continued move higher of 50+ points.
Indicator: Relative Strength 14
The RSI move below the 70 level would show slowing momentum, however the upturn in response to the new highs is a good indicator of continued positive momentum, a move below the 50 level would indicate a loss of price momentum and would be viewed as a signal to retest the support level at 4240.
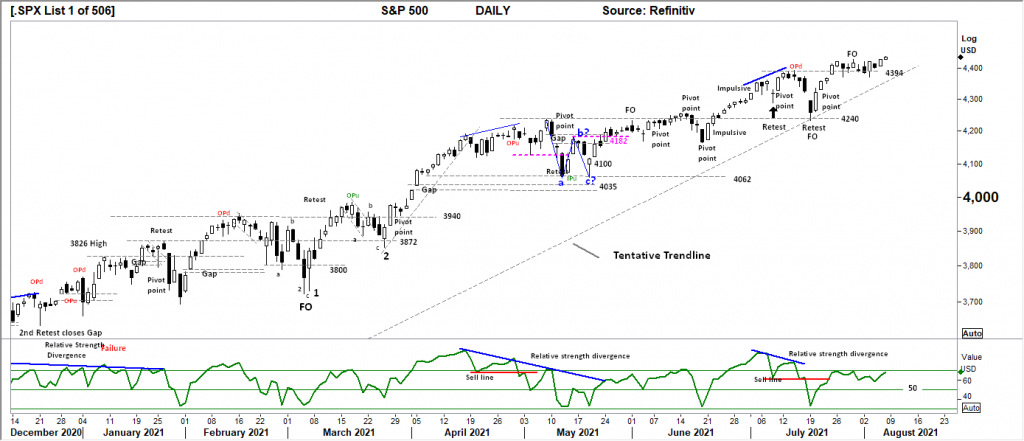
Comments from last week: The Fake Out move last Thursday has the potential to follow through lower in the coming days. The underlying trend line remains as tentative (2 points), as price consolidates at this level a retest of the trendline may occur in the coming days. The chart looks to set up a range trading window between 4240 and resistance of 4394. Traders would look for the first close above 4394 as a bullish signal for the following days.
NASDAQ DAILY
Price structure: This Index is the most concerning for traders
The high last Thursday was not followed thru on Friday, the short term trendline is at risk of being broken with a potential retest of 15,000 level on further weakness. During periods of price consolidation, indicators can give false signals. Price remains the key driver here to keep the Bulls engaged the index needs to regain the 15142 level to remain bullish in the coming days.
Indicator: Relative Strength 14
The Relative Strength Indicator has turned lower following a week registering a reading below the 70 level. A strong BEARISH divergence signal remains in place. The clear picture is the Index must take out the recent highs with an upturn in the RSI value above 68.

Comments from last week: Following the release of results from Amazon. The Nasdaq “gapped” down on Friday. This type of Gap is a buying gap, as no new low has been made on the day as buyers immediately entered the market. The underlying Primary trend in the Nasdaq is up, this remains intact and could be expected to continue with a retest and breakout of last Monday’s highs. (see RSI note) The short term trend line remains in place and may provide some support on any sideways consolidation.
USD Spot GOLD – DAILY
Price structure
Gold has failed every fundamental test, as a store of wealth, as a hedge against inflation. The price continued to range trade with Wednesday’s high retesting the upper price channel with immediate rejection. Friday’s breakdown below support is significant as is the current retest of the WEEKLY Trendline. A breakdown of the current support level at $1764.30 may see the next level at $1725 tested.
Indicator: Relative Strength 14
The Relative Strength is heading back below the 50 level, a signal of decreasing price momentum and should be monitored for a further move lower.

Comments from last week: If only the Gold bulls would look at the Chart! A clear picture of a secondary consolidation taking place. A clear picture of resistance at $1835.0 and support shown at $1785.0 without any indication of a directional move. The range is highly tradeable, closer inspection of the bars at the support level shows a number of lower shadows consistent with buyer support, whereas rejection is immediate at the resistance level. Traders may find a false break of the $1785.0 support level as the signal of a breakout higher is coming. A false break would be a price bar breaking the support level and closing above the support level. The Relative strength is heading back below the 50 level, a signal of decreasing price momentum and should be monitored for a further move lower.
SILVER DAILY
Price structure
Bullish divergence from 2 weeks ago resulted in a shooting star last Wednesday, also rejecting the short term down trendline. Last week Silver extended the Daily downtrend with an impulsive (large range) price movement on Friday. This is an important development with the $23.75 level the next support zone with the bears in full control of price at the moment. The divergent Buy signal is now negated.
Indicator: Relative Strength 14
The Bullish divergence pattern is now complete, the RSI has moved below the inner Buy line (red). Price momentum remains negative until a further cross above the 50 level.

Comments from last week: Last week Silver set up the false break scenario (see Gold notes) with an immediate move higher. With the price now retesting the $25.52 level and the short down trendline, the next move will be decisive for traders. With the positive divergence signal now complete, a breakout higher, is the better probability. The daily trend for Silver remains down, but divergence signals are a very positive setup for trend reversal and further gains.
AUD GOLD DAILY
Price structure
Significant resistance at $2477 has played out with a strong rejection last week. The bullish Cup and Handle pattern is now negated. With the underlying USD Gold price declining, the small 0.5 cent decline in the AUD has not offset the price function of the AUDUSD. Further declines would target the 2326 level.
Indicator: Relative Strength 14
Relative Strength moving back below the 70 and 50 level is in line with price movements. Price momentum is now negative, only a move over the 50 level would change the outlook to positive.

Comments from last week: A very positive development as a CUP and handle begins to show below the $2,477 level following the initial rejection at this level 9 trading days back. The chart picture from the March 2021 lows is a series of higher lows. The larger resistance level at $2541 resistance is the first target on a continued breakout.
COPPER DAILY
Price structure: LME Inventories remain historically low.
The fundamentals remain strong for copper. Last week’s rejection of the $4.50 level is a significant outcome following the Shooting star of two weeks ago. Currently the $4.33 resistance is showing support, a break of this level would immediately target the long term trendline. Copper remains within the consolidation zone following the a, b, c price retracement.
Indicator: Relative Strength 14
Confirmation of a loss of momentum is shown as the RSI moves below the “70” and now testing the 50 level, a further movement below 50 signals a loss of positive momentum and would confirm a potential retest of $4.00 underway. The RSI requires a continued reading above the 50 level to signal positive price momentum. It should be remembered the RSI can track above the 50 -70 level for many months at a time and currently remains a signal of positive price momentum.
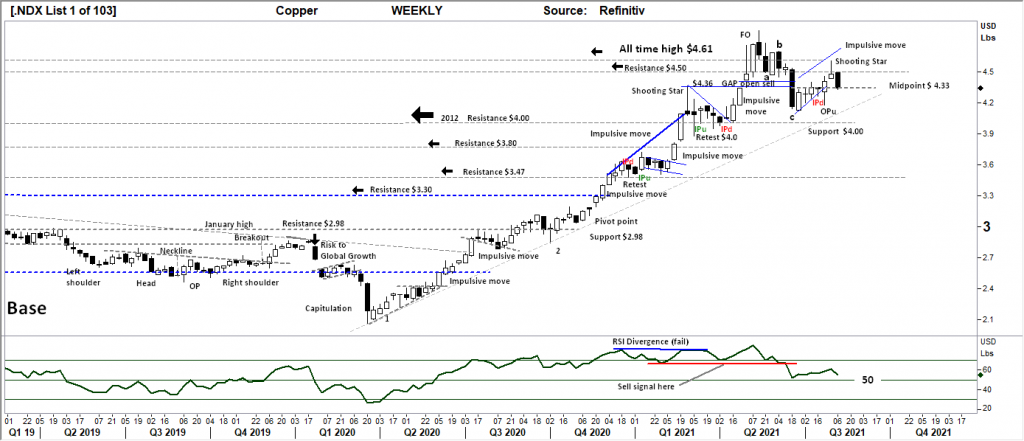
Comments from last week: HGc1 Copper has rejected two significant levels during the past week, the high rejected the historical high at $4.61, it seems the recent move over this level found immediate sellers to set the a,b,c retracement. What’s important from this is the recovery in price is again finding resistance at key levels with the price closing below the $4.50 level. The fundamentals remain strong for Copper in the long term, in the short term a quick retracement back to $4.00 may be required to confirm the sellers are exhausted. In the short term the recent level of $4.33 must hold to remain bullish.
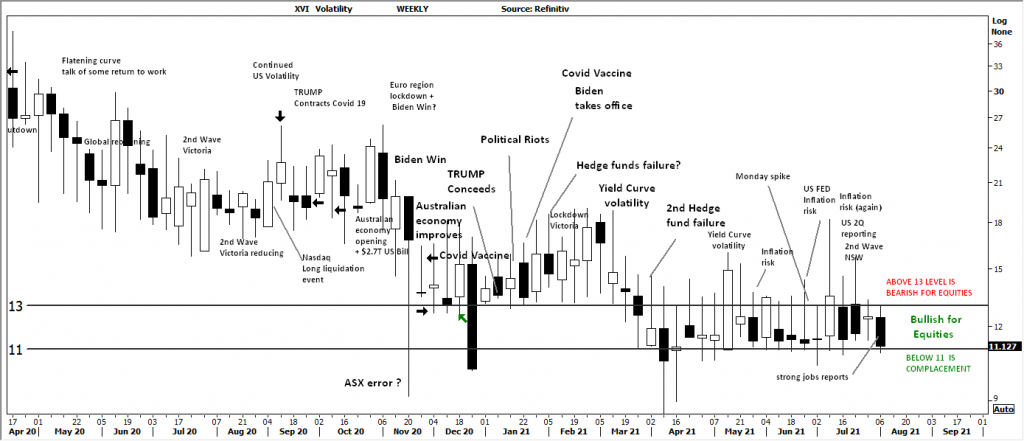
AUSTRALIAN VOLATILITY INDEX
Volatility remains subdued within the “Bullish for equities” range between 11 and 13. The XVI remains bullish for equities as risk has not been priced into forward months PUT options. This consolidation in the XVI from April 2021, suggests a breakout is coming as the adage of low volatility leads to high volatility remains true.
The inferred outcome is that the cost of forward insurance in the form of PUT Option premium remains in line with the underlying time decay calculations. This can change quickly. But it should be noted the weekly close is lower than the previous week.
The XVI is the difference of 1-3 month forward pricing of ETO Options against current month. As markets anticipate events, the forward priced option volatility changes, hence as forward price changes, this “skew” in pricing is measured in this XVI. The XVI value works as an inverse observation to the underlying market.
USD DOLLAR INDEX
Price structure
With the “further gains” observation of last week playing out, it has resulted with an impulsive price range set last Friday. With momentum strong, a retest of the 93.45 level would be expected, this will be the first real test of USD strength.
Indicator: Relative Strength 14
Relative Strength has completed the bearish divergence with the dip below the 50 level. The RSI has made a sharp move higher, and would now be monitored for a continued move higher in line with price gains.

Comments from last week: The trading range between 91.66 and 93.45 continues to develop. The reversal bar set last Friday shows the buyers again entering the market at the support level. The close over the 92.07 level is a bullish signal for further gains to retest the 93.45 level.
WTI CRUDE OIL
Price structure: This commodity is news driven by supply -demand.
Only a price break below the $65.00 level would challenge the Primary up trend in place. Last week the contract failed to trade over the $75.20 resistance level. Also last week WTI set a lower high point, this may be the precursor for a simple a,b,c type corrective move to retest the $61.80 price level. This important level is also the breakout point of many months of consolidation prior to this current price move. The ultimate target remains at $100 bl.
Indicator: Relative Strength 14
The RSI divergence signal has followed through crossing the “sell” level and moving below the “50” level, this is a significant signal showing loss of positive price momentum.

Comments from last week: The hammer bar of 2 weeks ago has followed through with a new pivot point (bar) now in place. At this point the resumption of the up trend is resuming a further price close over the $75.20 level would be an important development. The underlying Primary trend remains intact with a potential +$10 move underway. RSI turning lower below the 70 level, in line with current price moves only confirms the underlying price momentum is slowing.


 Access +10,000 financial
instruments
Access +10,000 financial
instruments