
EUR/USD:
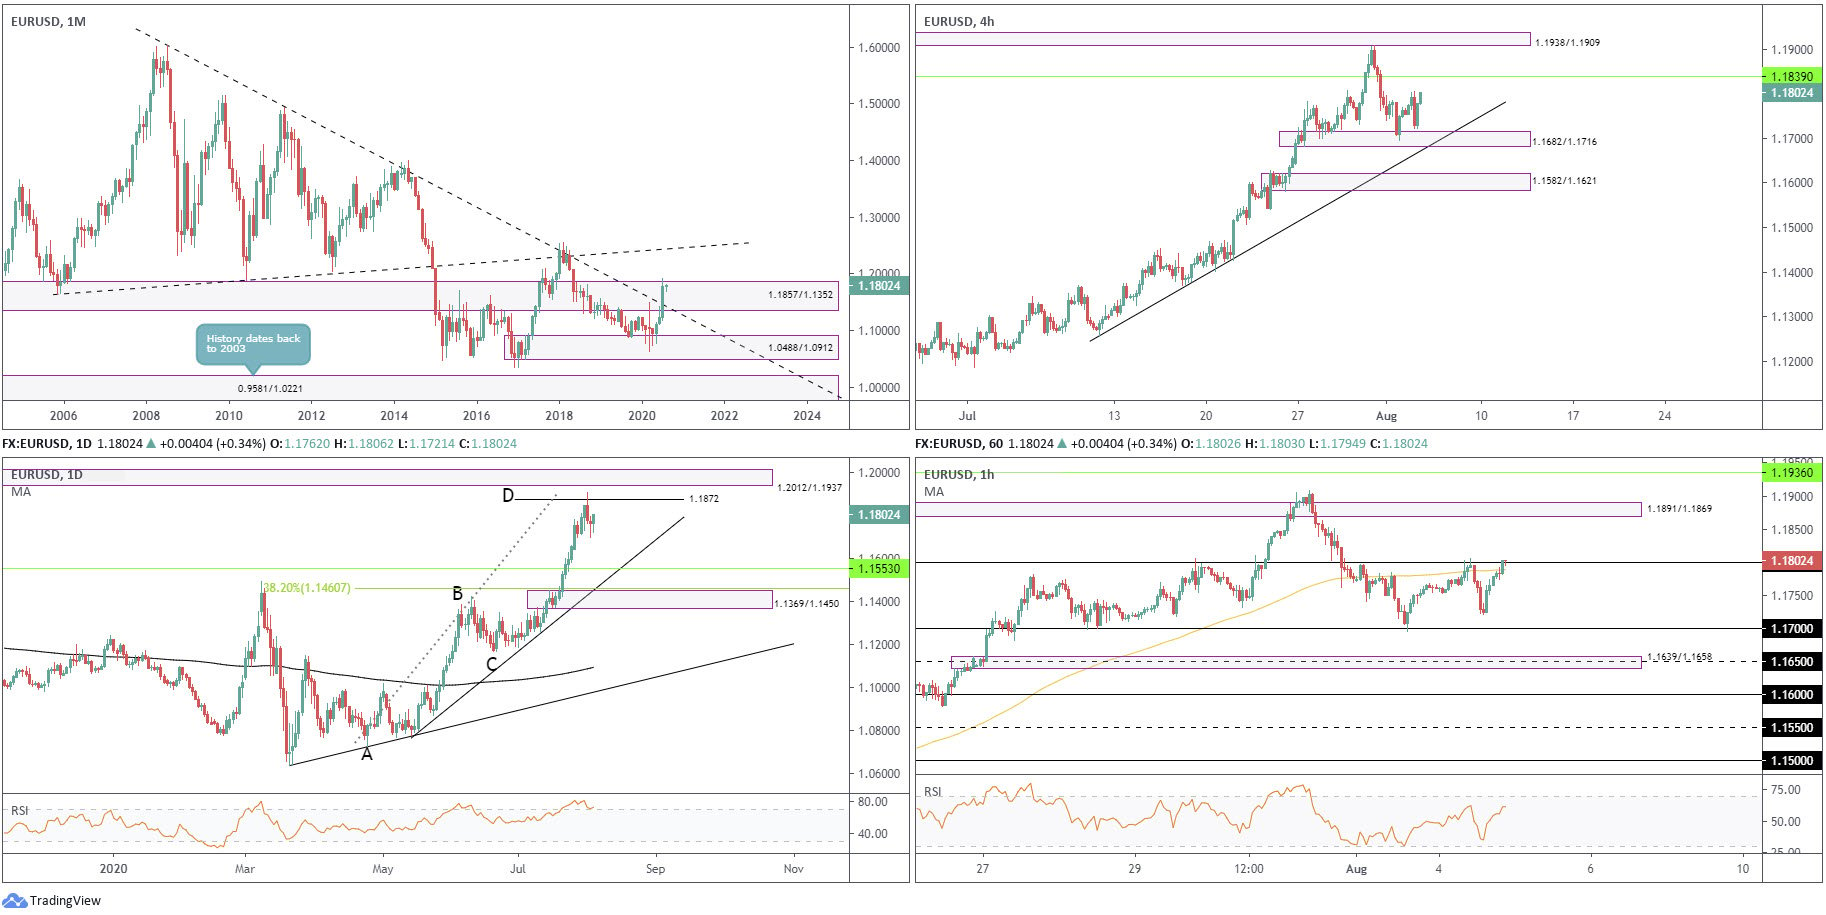
Monthly timeframe:
(Technical change on this timeframe is often limited though serves as guidance to potential longer-term moves)
The euro punched out a third successive monthly gain against the US dollar in July, adding nearly 5 percent. The move toppled long-term trendline resistance (1.6038) and made contact with the upper border of supply from 1.1857/1.1352. This argues a trend change to the upside may be on the horizon, with trendline resistance (prior support – 1.1641) on the radar as the next upside target.
Daily timeframe:
Partially altered from previous analysis –
The ABCD bearish pattern at 1.1872, situated ahead of supply at 1.2012/1.1937, remains a point of interest on the daily timeframe, capping price since Friday.
Downside, should sellers regain consciousness after Tuesday’s mild lift, has support at 1.1553 on the radar, with a breach throwing light on demand at 1.1369/1.1450, as well as a 38.2% Fib level at 1.1460 and trendline support (1.0774). Harmonic traders will note the 38.2% Fib level commonly represents the initial take-profit target out of ABCD configurations.
With respect to the RSI indicator, the value topped around 80.00 last week and exhibits signs of exiting overbought territory.
H4 timeframe:
Demand at 1.1682/1.1716 (trendline support [1.1254] also currently shares space with this area) welcomed a swift rebound Monday, with Tuesday feeding further gains, albeit modest. This shines light on resistance at 1.1839, with a break unmasking 1.1938/1.1909 (a supply area extended from May 2018).
Unwinding through current demand, on the other hand, lands crosshairs at another demand area at 1.1582/1.1621.
H1 timeframe:
1.18 resistance made an entrance mid-way through European trade on Tuesday, closely connected with the 100-period simple moving average. Selling pressure gathered traction heading into the US session, though failed to grip 1.17 before returning to the 1.18 threshold into the close.
Supply from 1.1891/1.1869 is seen as the next upside target north of 1.18, while below 1.17 we have demand at 1.1639/1.1658.
Structures of Interest:
Brought forward from previous analysis –
The monthly timeframe urges traders to consider the possibility of a long-term trend change after overrunning trendline resistance. Clearing monthly supply at 1.1857/1.1352 would help confirm this. However, daily sellers are proving relatively stubborn off a recently completed ABCD bearish pattern at 1.1872, with most sellers likely targeting support at 1.1553.
H4, on the other hand, recently defended demand at 1.1682/1.1716, demonstrating intraday buyers still have a hand in the fight at least until reaching resistance at 1.1839.
A break above 1.18 today signals the possibility of an approach to H4 resistance at 1.1839 and H1 supply at 1.1891/1.1869 (holds daily ABCD reversal point at 1.1872).
AUD/USD:
Monthly timeframe:
(Technical change on this timeframe is often limited though serves as guidance to potential longer-term moves)
May’s extension, together with June and July’s follow-through, witnessed supply at 0.7029/0.6664 and intersecting long-term trendline resistance (1.0582) relinquish ground. Concluding July higher by 3.5 percent, buyers appear free to explore as far north as 0.8303/0.8082, a supply zone aligning closely with trendline resistance (prior support – 0.4776).
Despite taking trendline resistance, the market’s primary trend still points south, demonstrating a series of lower lows and lower highs since mid-2011.
Daily timeframe:
The technical picture reveals price holding above support at 0.7067, yet at the same time pressured by supply coming in at 0.7264/0.7224, stationed beneath another supply close by at 0.7346/0.7282. The latter is formed by way of a demand-turned supply.
With reference to the RSI indicator, we are fading overbought status but appear reluctant to break 60.00 to the downside.
H4 timeframe:
Partially altered from previous analysis –
Monday’s whipsaw to lower levels, as underlined in recent analysis, challenged the mettle of demand at 0.7082/0.7106, though buyers stepped in Tuesday and launched trendline resistance (prior support – 0.7063). A break above the latter today could have price revisit 0.7246/0.7227, a supply drawn from February 2019.
H1 timeframe:
Against the backdrop of higher timeframe activity, price action on the H1 is currently confined within an ascending channel formation between 0.7076/0.7153. What’s also notable is a recent close above 0.7150 resistance and nearby 100-period simple moving average.
Structures of Interest:
Monthly price sweeping through supply and associated trendline resistance has likely aroused interest from longer-term traders. Daily price holds support at 0.7067, though capped close by at supply from 0.7264/0.7224.
On the H4 timeframe, trendline resistance (0.7063) is in motion, along with H1 channel resistance, drawn from 0.7153. Combined, this could be enough to tempt a wave of selling today back through 0.7150 towards channel support (0.7076).

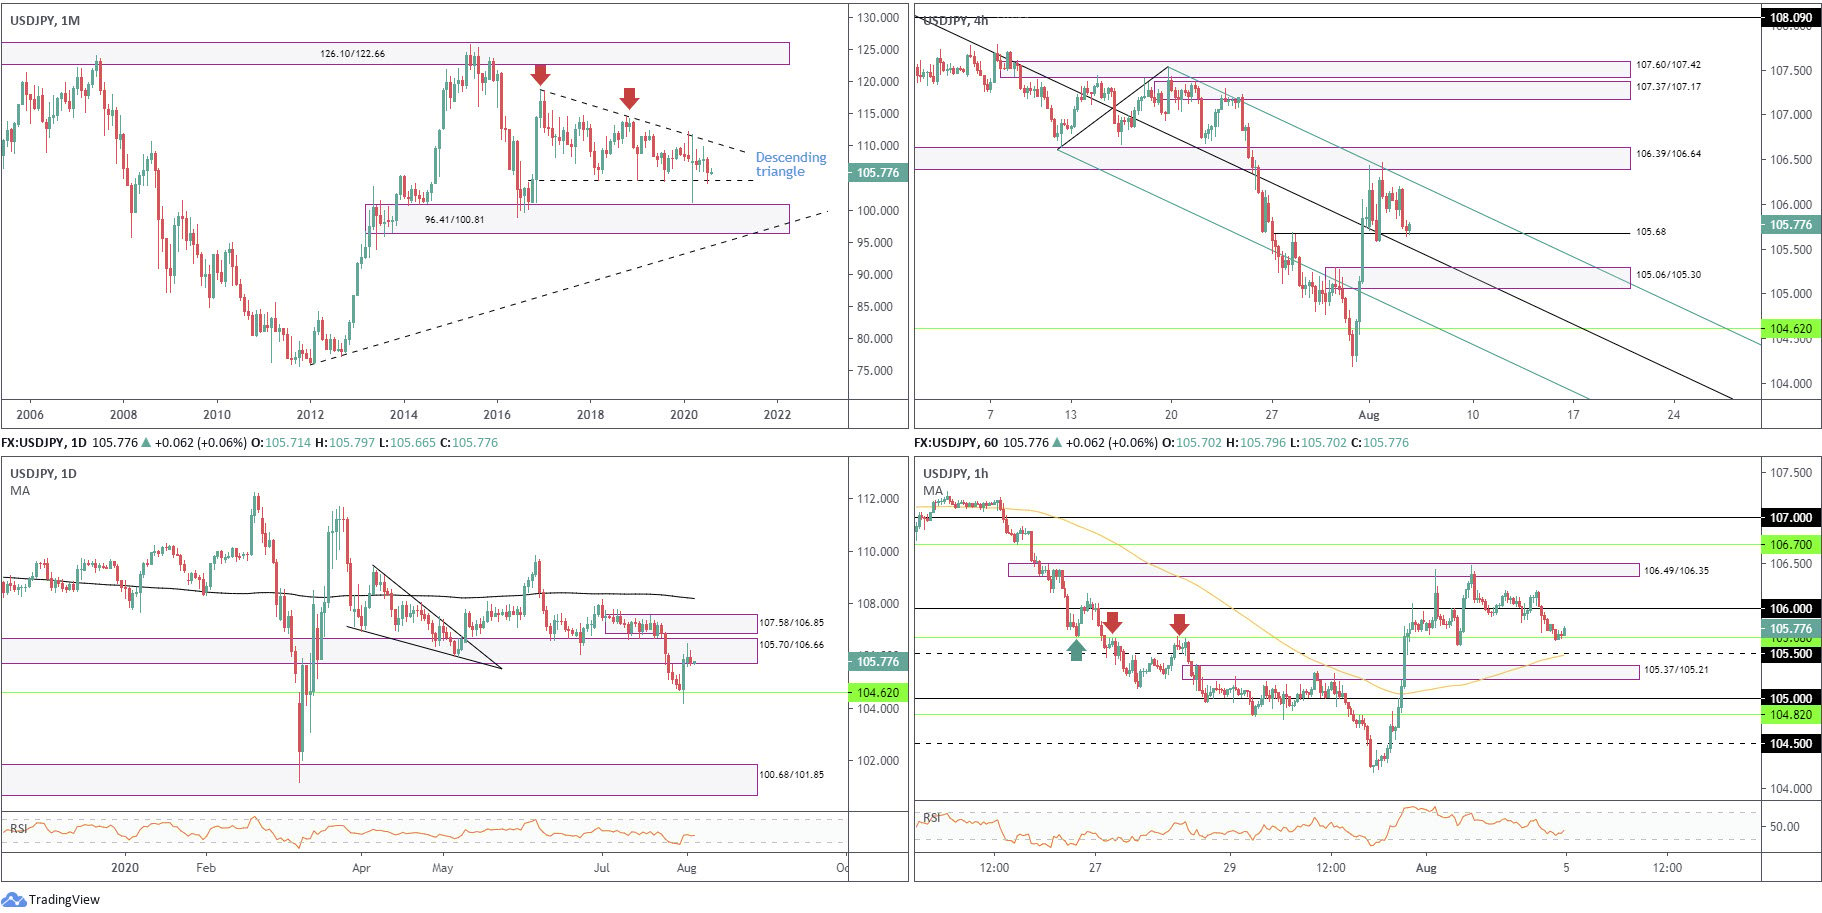
USD/JPY:
Monthly timeframe:
(Technical change on this timeframe is often limited though serves as guidance to potential longer-term moves)
Since kicking off 2017, USD/JPY has been carving out a descending triangle pattern between 118.66/104.62.
April, May and June were pretty uneventful, with the latter wrapping up indecisively in the shape of a neutral doji candlestick pattern. July, nonetheless, sunk nearly 2 percent, consequently testing the lower boundary of the current descending triangle.
Areas outside of the noted triangle can be seen at supply from 126.10/122.66 and demand coming in at 96.41/100.81.
Daily timeframe:
Partially altered from previous analysis –
Having monthly support at 104.62 make a show, daily price ended the week retesting the underside of 105.70/106.66 as possible supply, with Monday settling by way of a reasonably attractive shooting star candlestick pattern, considered a bearish signal at peaks. Tuesday had sellers come forward and display interest, yet whether adequate enough to roll 104.62 back into action is difficult to judge.
Removing 105.70/106.66, on the other hand, may have the pair work its way into the next available supply at 107.58/106.85.
H4 timeframe:
Partially altered from previous analysis –
Supply (prior demand) at 106.39/106.64, as well as resistance derived from the Andrew’s Pitchfork (107.54), made an entrance on Monday, withstanding upside on two occasions. This led to support at 105.68 entering the fight in recent trading.
Additional downside throws light on demand (prior supply) at 105.06/105.30, assuming a break of the (Andrew’s Pitchfork) median line.
H1 timeframe:
Following two decisive downside attempts to override the 106 level, sellers eventually mustered enough force to topple the round number into US trading Tuesday, consequently crossing paths with support at 105.68 (H4 support), a level that’s offered a constructive tone in recent trading.
Downside momentum also took the RSI value under its 50.00 mid-point, bottoming around 37.00ish as support underscored above at 105.68 welcomed price.
Structures of Interest:
The descending triangle’s lower perimeter recently making an entrance at 104.62 has sparked modest interest to the upside, though buyers face considerable structure on the daily timeframe: supply at 105.70/106.66.
Supply (prior demand) at 106.39/106.64 on the H4 timeframe is interesting as it resides within daily supply at 105.70/106.66. Therefore, the 106 violation on the H1 is not a surprise and was a noted change to watch for in recent analysis.
Buyers are currently making a stand from support at 105.68 (H1/H4), in line with monthly price off 104.62. Is this enough to draw price higher, despite daily sellers exhibiting a presence within supply at 105.70/106.66?
DISCLAIMER:
The information contained in this material is intended for general advice only. It does not take into account your investment objectives, financial situation or particular needs. FP Markets has made every effort to ensure the accuracy of the information as at the date of publication. FP Markets does not give any warranty or representation as to the material. Examples included in this material are for illustrative purposes only. To the extent permitted by law, FP Markets and its employees shall not be liable for any loss or damage arising in any way (including by way of negligence) from or in connection with any information provided in or omitted from this material. Features of the FP Markets products including applicable fees and charges are outlined in the Product Disclosure Statements available from FP Markets website, www.fpmarkets.com and should be considered before deciding to deal in those products. Derivatives can be risky; losses can exceed your initial payment. FP Markets recommends that you seek independent advice. First Prudential Markets Pty Ltd trading as FP Markets ABN 16 112 600 281, Australian Financial Services License Number 286354.


 Access +10,000 financial
instruments
Access +10,000 financial
instruments