Experience Trading
on the Go
on the Go
The Forex market is made up of several commercial banks, hedge funds, proprietary trading firms and individual traders. Its fragmented nature operates through electronic platforms on a twenty-four-hour basis, five days a week.
Absent a primary exchange and clearinghouse, measuring real-time foreign exchange volume is impossible. Unlike other financial markets, such as stock markets and futures and options markets, the foreign exchange market is decentralised, often referred to as an over-the-counter (OTC) market. OTC is an off-exchange transaction between two parties.
Consequently, volume data on most MetaTrader 4 (MT4) and MetaTrader 5 (MT5) platforms are broker fed: the trading activity of the broker’s clients and not that of the entire Forex market. This causes different volume readings across brokers.
Market exchanges measure trading volume and are presented in a number of different forms – this data is commonly employed to configure trading strategies.
Higher trading volume indicates a liquid market (willing buyers and sellers), while lower volume suggests decreased liquidity.
In the stock market, volume is a measure of how many shares have been traded. In the futures market, volume is calculated via the number of contracts bought and sold. The Forex market is different. Although retail speculators would expect volume to represent the number of lots traded, the majority of CFD/Forex brokers actually display tick volume, which measures the number of times price moves up and down. This is the reason behind some traders overlooking FX volume studies. Despite this, there is evidence to suggest FX tick volume can be used as a proxy for traded volume in FX markets.
Casper Marney, an experienced Forex trader and technical analyst who served at banks such as HSBC, wrote a paper revealing tick data has been used in FX. Marney states although there are a number of valid reasons why many would expect little or no correlation between traded volume and tick data in FX, research revealed a 90 per cent correlation between tick volume and the movement of actual traded volume. Marney’s study focused on the following currency pairs: EUR/USD, GBP/USD, USD/JPY and EUR/CHF.
A tick in Forex trading (or sometimes referred to as FX trading or currency trading) is the smallest possible unit by which price movement can change: 1 pipette (0.00001 pips). A pip (price interest point), on the other hand, measures a currency pair’s exchange rate fluctuations, equal to 1/100th of 1%. Most currency pairs are usually priced to four decimal places (0.0001). Currency pairs containing Japanese yen (JPY), nevertheless, are priced to two decimal places (0.01).
Standard interpretation of volume can be seen in figure 1. A:
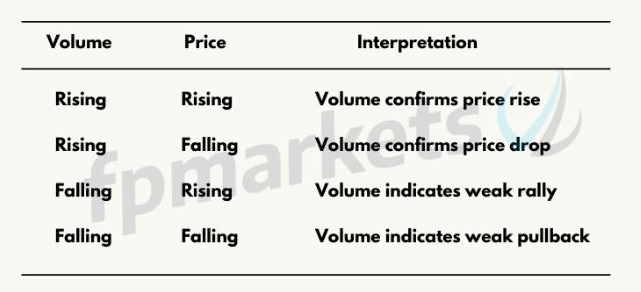
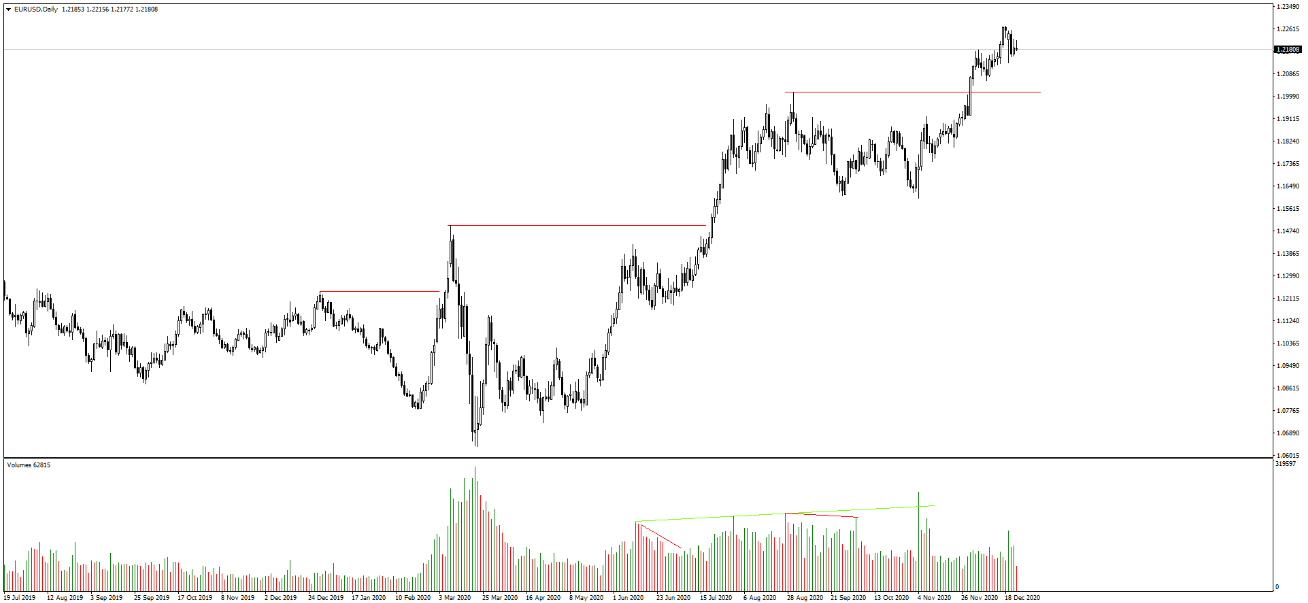
Volume bars are widely used, showing volume change (ticks in the case of retail FX). Volume bars are coloured (default colours) green when tick change is larger than the previous bar and turn red in the case of lower tick volume (colours can be altered to suit personal preference). Figure 1. B displays EUR/USD’s daily chart, exhibiting a defined uptrend since March 2020. Since the end of May, traders will note the market has displayed rising volume alongside a rise in price action. Also evident is the dip in volume on price retracements, suggesting weak pullbacks.
When trading Forex, or any financial instrument, it is important to acknowledge that trading in isolation is difficult. Experienced Forex traders formulate trading plans, often merging fundamental and technical analysis, alongside risk-management systems.
Breakout strategies are popular, particularly around short-term support and resistance levels. Breakouts together with high volume indicate strength behind the move. Limited volume suggests a lack of interest.
Additionally, traders use volume to confirm patterns. As an example, consider the common bullish flag configuration. Volume generally rises on the formation of the flag pole and decreases during the pattern’s consolidation. A subsequent breakout to the upside should be accompanied by strong volume, suggesting continuation.
Aside from the traditional Volume Indicator (shown in figure 1. B), MetaTrader’s packages provide numerous volume indicators, such as On Balance Volume (OBV), Accumulation/Distribution and Money Flow Index (MFI).
 Access 10,000+ financial instruments Auto open & close positions News & economic calendar Technical indicators & charts Many more tools included
By supplying your email you agree to FP Markets privacy policy and receive future marketing materials from FP Markets. You can unsubscribe at any time.
Source - cache | Page ID - 1058
