
Charts: Trading View
(Italics: Previous Analysis Due to Limited Price Change)
EUR/USD:
Heading into the close of London hours Monday, the European Central Bank (ECB) President Lagarde took the spotlight at European Parliament and essentially poured cold water on latest rate hike assumptions. Lagarde said ‘there were no signs that measurable monetary policy tightening would be required’.
In terms of price movement, a modestly sour tone clouded Europe’s shared currency as the US dollar—as measured by the US dollar index—extended Friday’s NFP-induced recovery. This should not raise too many ‘technical eyebrows’ as Monday’s technical briefing highlighted the possibility of profit taking.
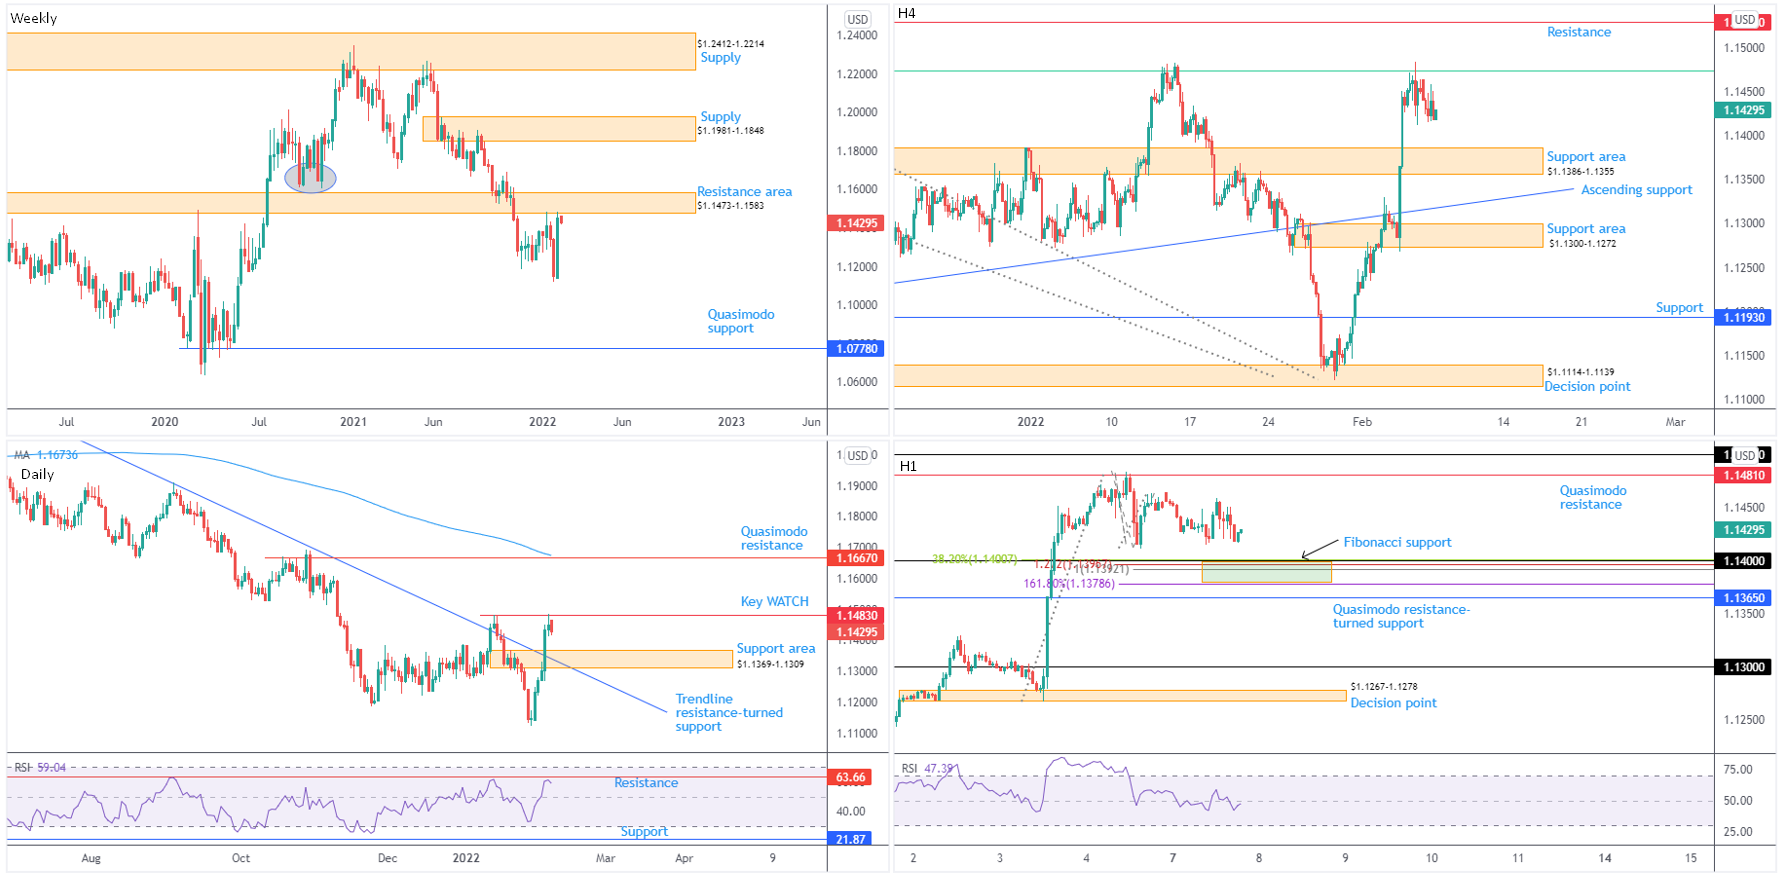
The weekly timeframe is fading the lower side of long-standing resistance at $1.1473-1.1583, a base entertaining active S/R since late 2017. Technicians will acknowledge trend sentiment favours a rejection, communicating a bearish environment since topping at $1.2350 at the beginning of January (2021). This is reinforced by the monthly timeframe’s long-term (some would say ‘primary’) downtrend since mid-2008.
Extending the technical reading to the daily timeframe, we can see the $1.1483 14th January peak (marked key watch) formed a ceiling in this market, aiding the technical presence of current weekly resistance. Further to this, the relative strength index (a popular measure of momentum) has begun rotating lower ahead of 8-month resistance at 63.66. Continued interest to the downside places the $1.1369-1.1309 support zone in sight, which happens to intersect with trendline resistance-turned support, extended from the high $1.2254.
Meanwhile the H4 timeframe reveals price levelling off from the 61.8% Fibonacci retracement ratio at $1.1475, a level sharing chart space with the high $1.1483 highlighted on the daily timeframe. Support at $1.1386-1.1355 (glued to the upper edge of the daily support area at $1.1369-1.1309), therefore, calls for attention. However, sat along the upper boundary of the H4 support is the $1.14 area on the H1, accompanied by a Fibonacci support between $1.1379 and $1.1400. Note the 100% Fibonacci projection represents an AB=CD bullish completion point that’s joined closely by a 1.618% Fibonacci extension at $1.1379. Additional technical observations show a H1 Quasimodo resistance-turned support nearby at $1.1365, of which is also situated within H4 support.
The combination of a soft market since January 2021, as well as the lower side of weekly resistance at $1.1473, the $1.1483 14th January peak (daily), and the H4 timeframe’s 61.8% Fibonacci retracement ratio at $1.1475, signals a bearish market.
With the above, H1 dip buyers between $1.1379 and $1.1400 are urged to approach with caution. Below here, and the H1 Quasimodo resistance-turned support at $1.1365, a drop to $1.13 could develop.
AUD/USD:
Reclaiming a large slice of Friday’s (NFP) decline, AUD/USD bulls entered an offensive phase on Monday and added 0.8 percent. An outperformer on the session, the recent advance was underpinned amid a modest risk-on theme.
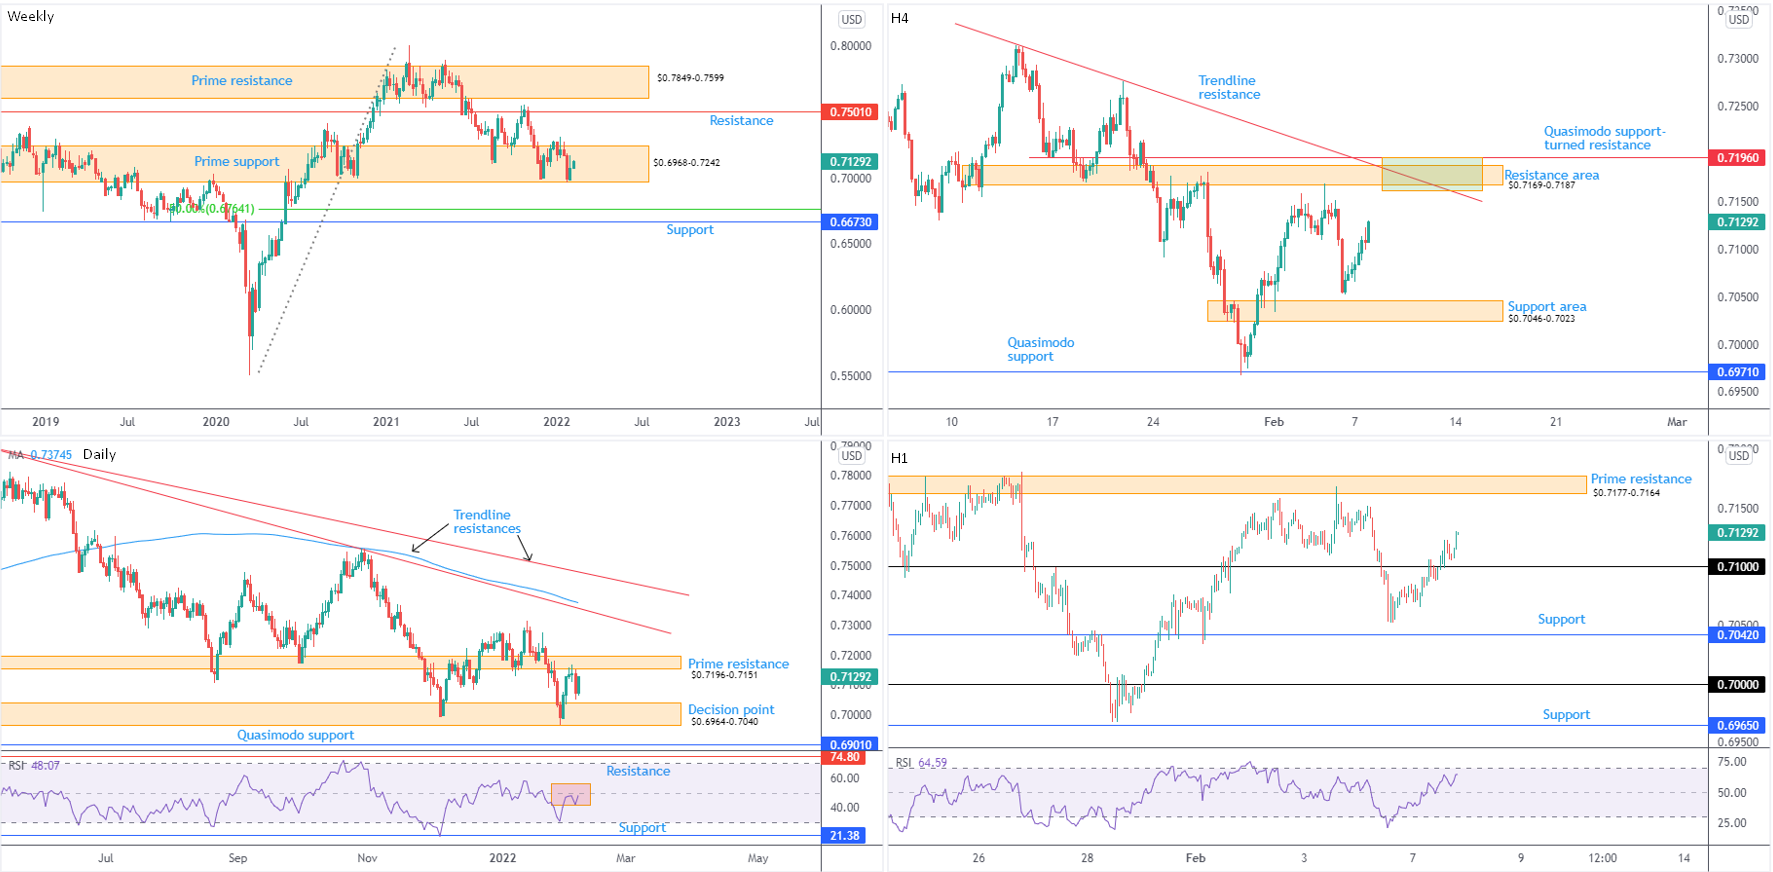
Ultimately, albeit delivering a fragile appearance since late November (2021), prime support at $0.6968-0.7242 remains active on the weekly timeframe. Consequently, until this area is engulfed, longer-term bulls are in immediate control despite the weekly price stepping lower since February 2021 and the long-term monthly trend facing lower since August 2011. Should sellers strengthen their grip and clear $0.6968-0.7242, support is at $0.6673 which is joined closely with a 50.0% retracement at 0.6764.
Supporting sellers, of course, is the daily timeframe’s prime resistance at $0.7196-0.7151, and the H4 timeframe’s resistance zone at $0.7169-0.7187 (strengthened by trendline resistance, drawn from the high $0.7314, and Quasimodo support-turned resistance at $0.7196 [green zone]). We also see H1 crossed above $0.71 and is poised to retest prime resistance at $0.7177-0.7164—fixed to the underside of H4 resistance.
It’s important to note that the relative strength index (RSI) on the daily timeframe is flattening ahead of the 50.00 centreline, and the H1 RSI is on the doorstep of overbought levels.
Blending prime resistance on the daily timeframe at $0.7196-0.7151 together with H4 resistance at $0.7169-0.7187 and H1 prime resistance at $0.7177-0.7164 offers a clear area of resistance to work with between $0.7196 and $0.7151.
USD/JPY:
Monday left behind a muted tone on USD/JPY, following Friday’s spirited advance on the back of a stronger-than-expected payrolls number.
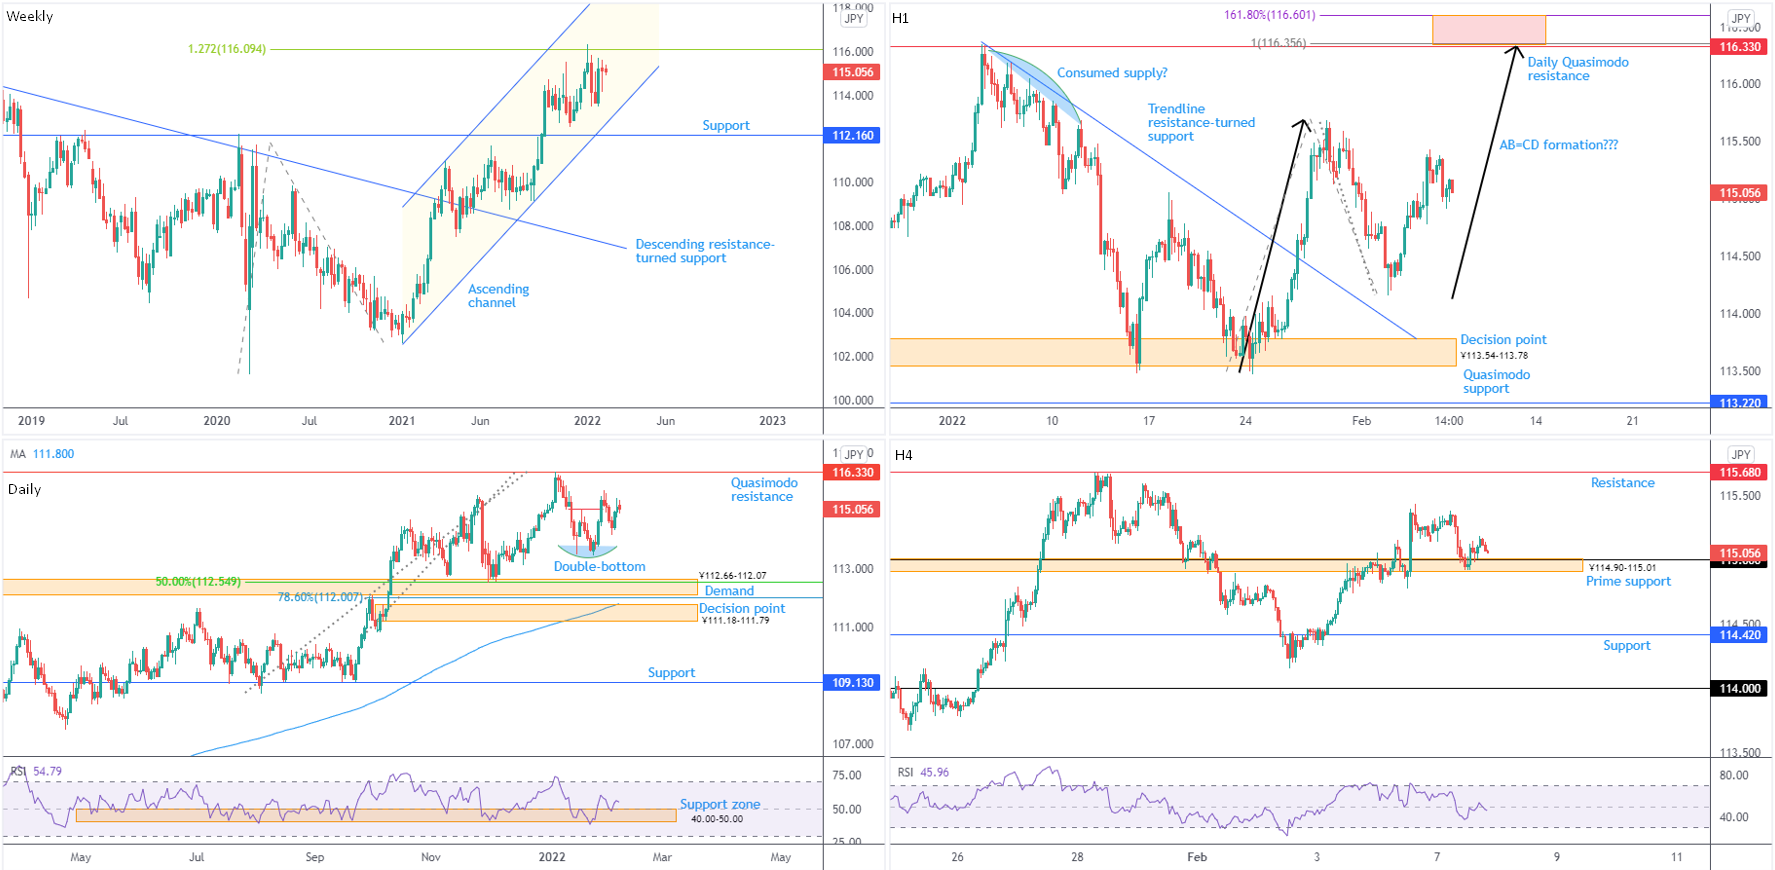
As anticipated, Monday had short-term price action test the mettle of ¥115, complemented by H1 prime support taken from ¥114.90-115.01. Additional buying from this point targets Friday’s peak around ¥115.43, followed by H1 resistance at ¥115.68.
Further buying is reinforced by the following technical components highlighted in previous writing:
- The underlying trend has been advancing since the beginning of 2021. The weekly timeframe also exhibits a little scope to approach the 1.272% Fibonacci projection from ¥116.09. Weekly channel support, therefore, is worth keeping a close eye on, taken from the low ¥102.59.
- The double-bottom pattern on the daily timeframe (¥113.48), despite a recent slump in price, submits the possibility of reaching for daily Quasimodo resistance from ¥116.33, arranged a touch above the weekly timeframe’s resistance of ¥116.09. Also bolstering a bullish appearance is the daily chart’s RSI recoiling from support between 40.00 and 50.00 (a ‘temporary’ oversold range since 10th May—common view in trending markets).
- In addition to weekly and daily timeframes, H4 technical structure signals a potential AB=CD completion in the direction of daily Quasimodo resistance at ¥116.33. This is set close by a 1.618% Fibonacci extension at ¥116.60.
The long-term trend is to the upside; however, the weekly timeframe’s 1.272% Fibonacci projection from ¥116.09 remains a technical headwind to be mindful of. Underpinning the bullish theme, the daily timeframe’s double-bottom pattern (¥113.48) suggests continuation moves higher to daily Quasimodo resistance from ¥116.33.
Shorter-term timeframes are aligned with the bigger picture. The H4 scale shows a possible AB=CD bearish configuration in the direction of daily Quasimodo resistance at ¥116.33. This, therefore, leaves the H1 chart open to further defending ¥115 and the prime support at ¥114.90-115.01.
DISCLAIMER:
The information contained in this material is intended for general advice only. It does not take into account your investment objectives, financial situation or particular needs. FP Markets has made every effort to ensure the accuracy of the information as at the date of publication. FP Markets does not give any warranty or representation as to the material. Examples included in this material are for illustrative purposes only. To the extent permitted by law, FP Markets and its employees shall not be liable for any loss or damage arising in any way (including by way of negligence) from or in connection with any information provided in or omitted from this material. Features of the FP Markets products including applicable fees and charges are outlined in the Product Disclosure Statements available from FP Markets website, www.fpmarkets.com and should be considered before deciding to deal in those products. Derivatives can be risky; losses can exceed your initial payment. FP Markets recommends that you seek independent advice. First Prudential Markets Pty Ltd trading as FP Markets ABN 16 112 600 281, Australian Financial Services License Number 286354.


 Access +10,000 financial
instruments
Access +10,000 financial
instruments