Note—Charts provided by Trading View
EUR/USD:
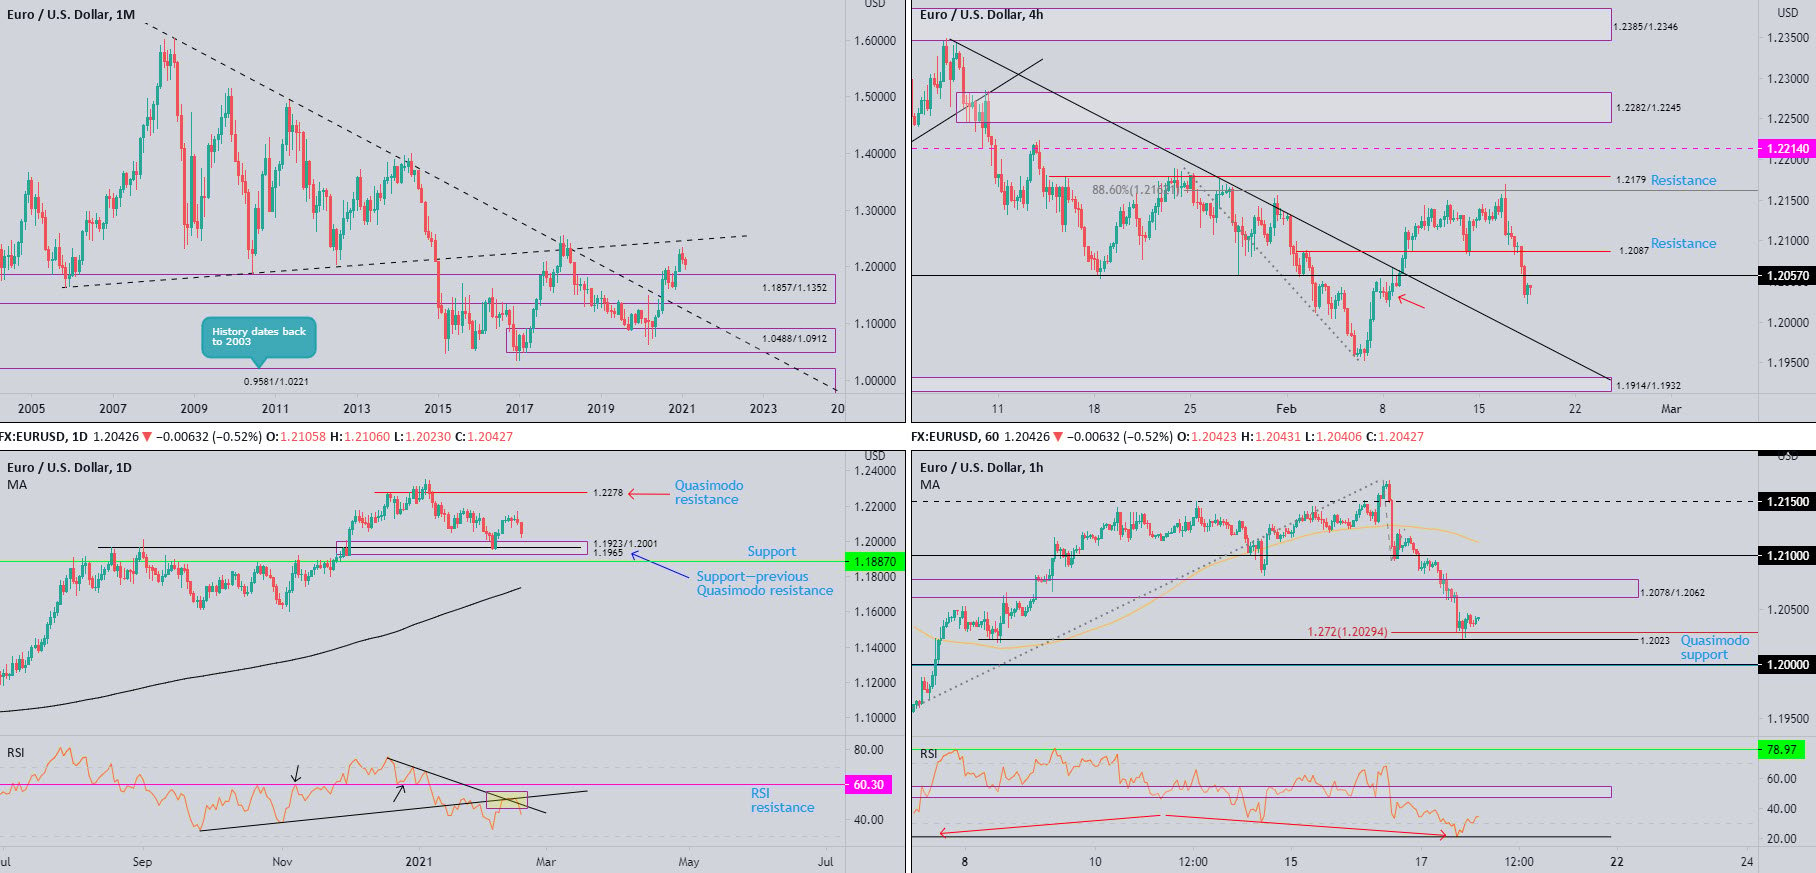
Monthly timeframe:
(Technical change on this timeframe is often limited though serves as guidance to potential longer-term moves)
February, as you can see, remains off session lows, though currently trades 0.8 percent lower.
Downstream, 1.1857/1.1352 represents demand, while northbound shines light on ascending resistance (prior support – 1.1641).
In terms of trend, the primary uptrend has been in play since price broke the 1.1714 high (Aug 2015) in July 2017.
Daily timeframe:
Another spirited USD advance (DXY > 91.00) weighed on Europe’s shared currency Wednesday, consequently shifting the technical spotlight towards demand from 1.1923/1.2001—an area housing support at 1.1965 (previous Quasimodo resistance).
RSI action dipped back under the 50.00 centreline, after shaking hands with two converging RSI trendline resistances (yellow box).
H4 timeframe:
EUR/USD extending losses on Wednesday led price movement through support drawn from 1.2087 and 1.2057. Run-of-the-mill demand resides around the 1.2035 region (red arrow), though bearish bets may take aim at trendline resistance-turned support, extended from the high 1.2349.
H1 timeframe:
Quasimodo support at 1.2023 made an entrance heading into US hours Wednesday, a level accompanied by a 127.2% Fib extension at 1.2029. Further upside off this base will likely make its way towards supply coming in at 1.2078/1.2062, though pushing southbound will bring light to the widely watched 1.20 level, joined by 78.6% Fib level at 1.1998.
RSI recently rebounded off support from 20.64 and exited oversold space.
Observed levels:
Monthly price is on course to perhaps retest 1.1857/1.1352 demand, while daily flow is on the doorstep of demand from 1.1923/1.2001.
Shorter-term flow reveals H4 nudged under support at 1.2057, therefore a bearish theme could emerge until we shake hands with nearby trendline support.
Although H1 is balancing off Quasimodo support at 1.2023, a dip to 1.20 bids is perhaps on the table. This is a level not only linked with a 78.6% Fib level at 1.1998, but also the upper side of daily demand taken from 1.2001.
AUD/USD:
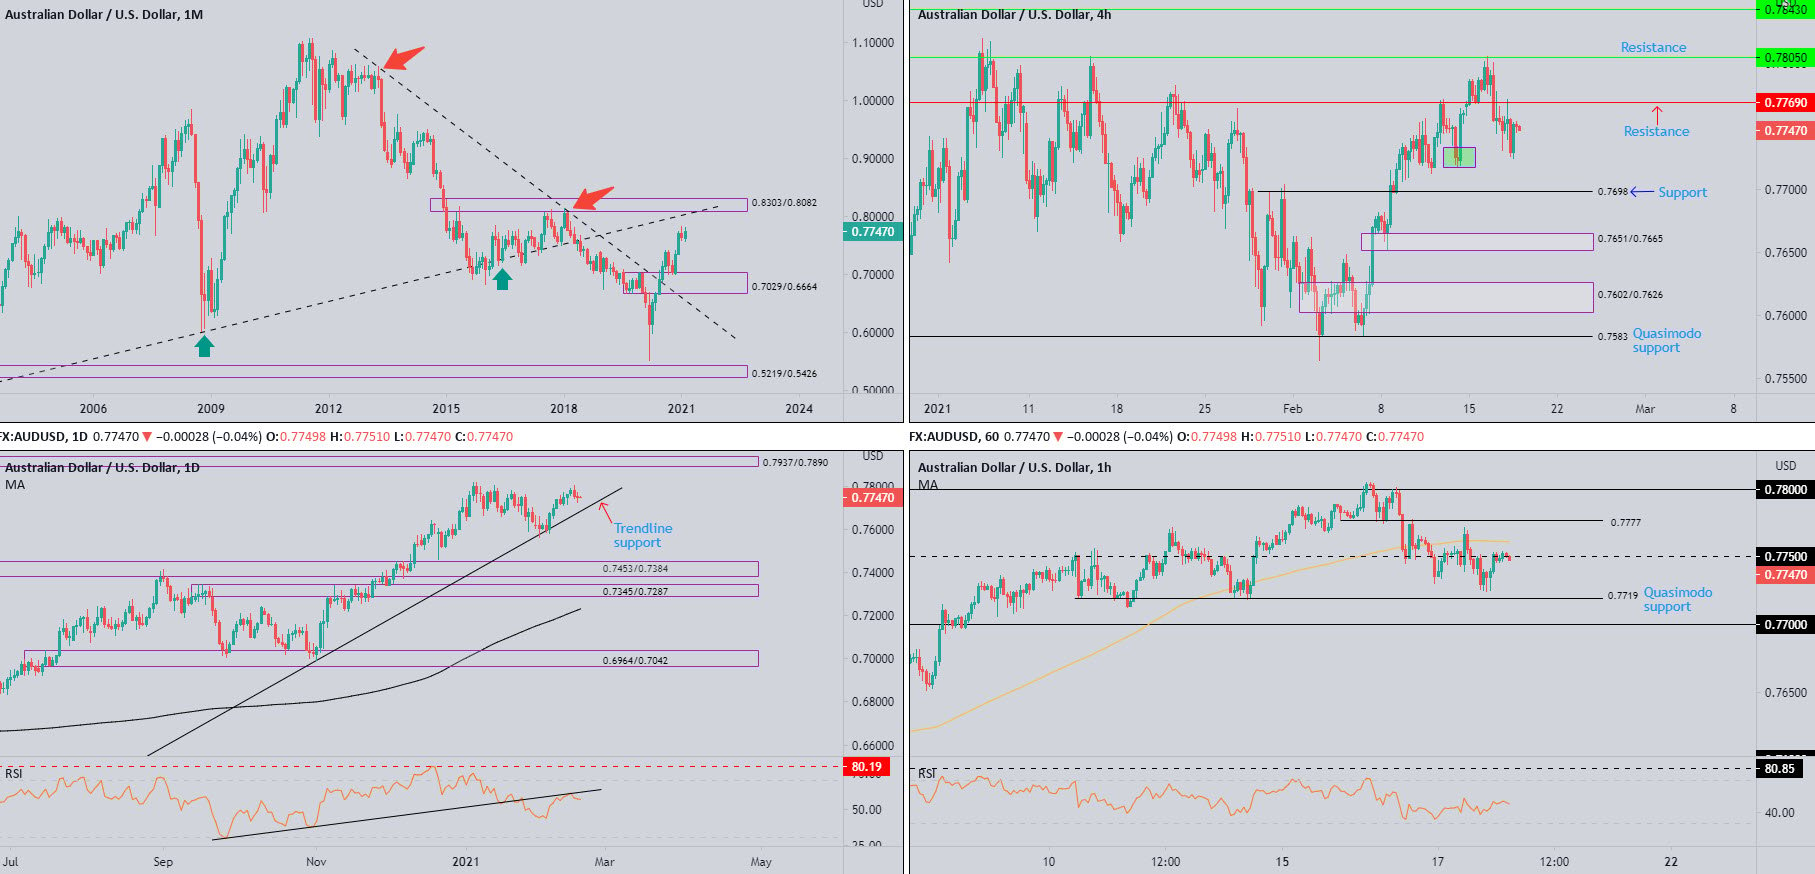
Monthly timeframe:
(Technical change on this timeframe is often limited though serves as guidance to potential longer-term moves)
January’s half-hearted shooting star candle (often construed as a bearish indication at peaks) has so far failed to seduce sellers. February, as you can see, trades a touch off session highs, up by about 1.5 percent.
This brings light to 0.8303/0.8082—a supply zone aligning closely with trendline resistance (prior support – 0.4776). In the event sellers regain consciousness, however, long-term demand resides at 0.7029/0.6664 (prior supply).
In the context of trend (despite the trendline resistance [1.0582] breach in July 2020), the primary downtrend (since mid-2011) remains in play until breaking 0.8135 (January high [2018]).
Daily timeframe:
Partly modified from previous analysis –
AUD/USD concluded Wednesday pretty much unmoved and established an indecision doji candle.
Upriver, beyond 2021 pinnacles at 0.7820, supply inhabits the 0.7937/0.7890 neighbourhood. Calling for attention to the downside, on the other hand, is trendline support, an ascending level drawn from the low 0.5506.
RSI flow is seen touching gloves with RSI trendline resistance. A downside move here has the 50.00 centreline in sight, while moves north could have the value invade overbought space.
H4 timeframe:
Resistance at 0.7769 remains in play. Though traders are encouraged to note the drop-base-rally demand zone at around the 0.7727ish region (green) is also attracting a modest bullish defence.
As evident from the chart, support at 0.7698, a previous Quasimodo resistance, is next in line should sellers take on more of a dominant position today.
H1 timeframe:
The 100-period simple moving average around 0.7761 served well as dynamic resistance on Wednesday, directing the H1 candles south of 0.7750.
Quasimodo support is seen at 0.7719, with a break uncovering the 0.77 figure. Bullish impetus, movement that takes the currency pair north of the 100-period simple moving average, could lead things back to resistance at 0.7777, followed by 0.78.
Observed levels:
Partly modified from previous analysis –
Retesting 0.7750 resistance could spark a short-term bearish scenario towards 0.77 on the H1 (H1 Quasimodo support is potentially fragile having seen the level tested last Friday).
Longer term, the monthly chart shows buyers are likely to eventually take the wheel, though prior to this, daily action could retreat and retest trendline support, perhaps inspiring a wave of dip-buying.
USD/JPY:
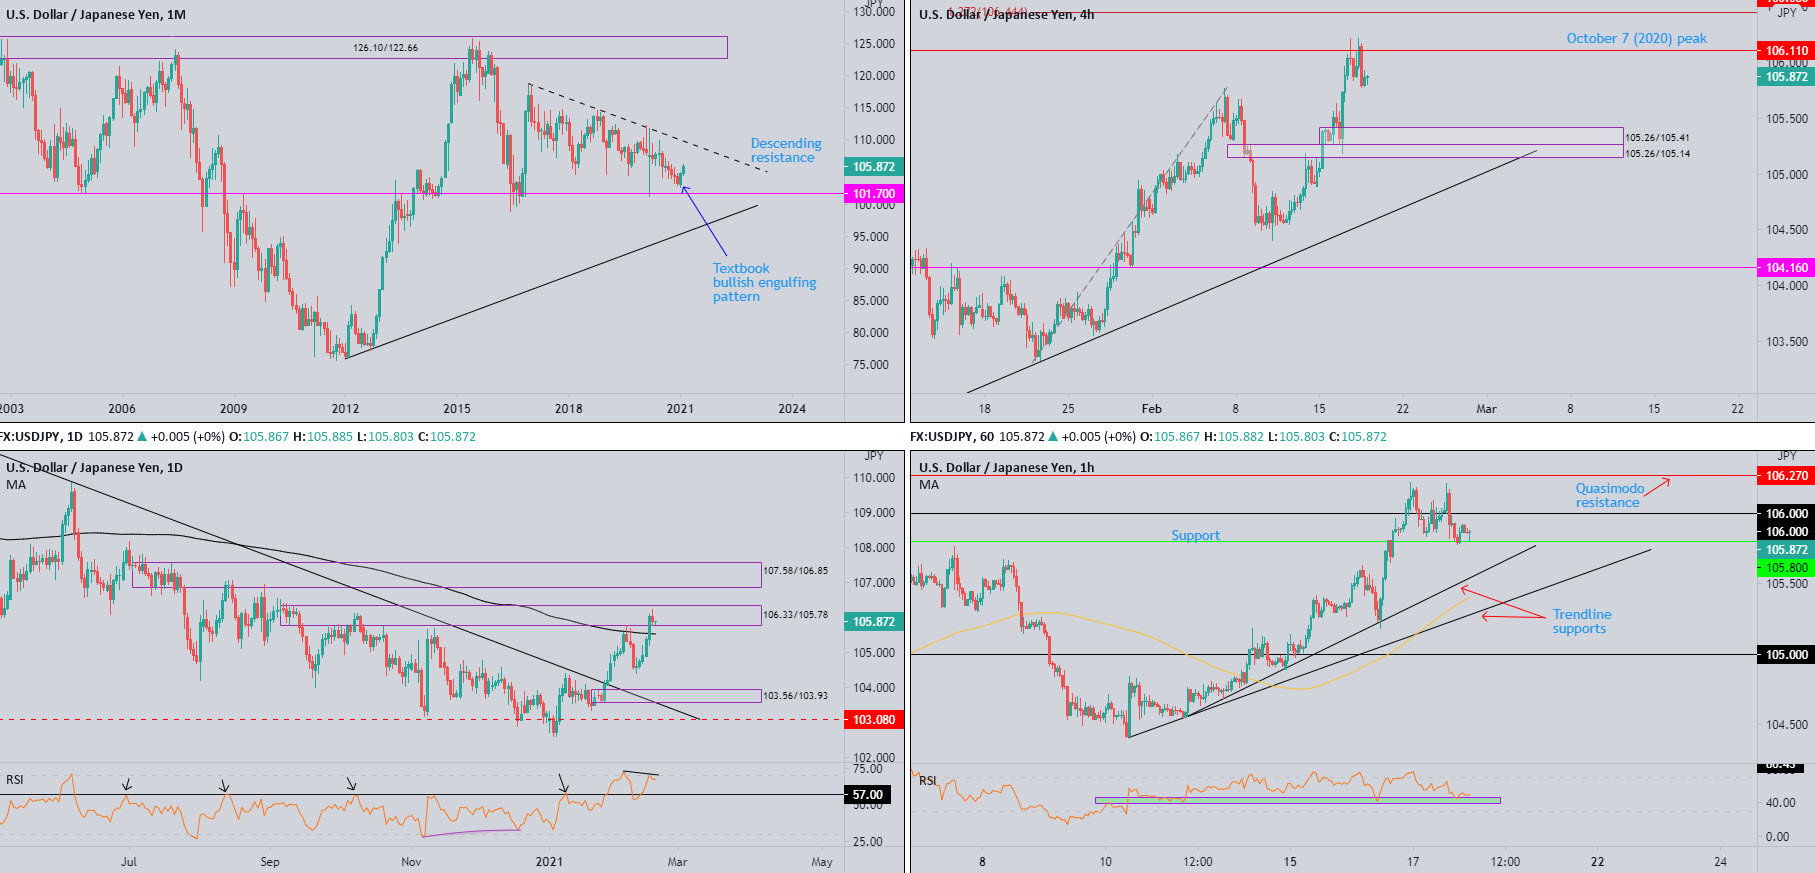
Monthly timeframe:
(Technical change on this timeframe is often limited though serves as guidance to potential longer-term moves)
Buyers are beginning to show life on the monthly scale, following January’s bullish engulfing candle.
Up by 1.2 percent, resistance can be seen in the form of a descending line (not considered traditional trendline resistance), etched from the high 118.66, whereas support continues to inhabit 101.70 in the event sellers make a show.
Daily timeframe:
Wednesday witnessed sellers step forward within the walls of supply from 106.33/105.78, following Tuesday’s dynamic push above the 200-day simple moving average at 105.52. Snapping a five-day winning streak, yesterday’s action could spark a retest at the aforementioned SMA.
The RSI indicator exited overbought waters and produced bearish divergence. Support remains on the table around 57.00.
H4 timeframe:
The October 7 (2020) peak at 106.11 made a show on Wednesday and, as you can see, stimulated a bearish response.
Demand in sight can be seen at 105.26/105.41 and 105.26/105.14 (commonly referred to as stacked demand), while should buyers overthrow 106.11, a 127.2% Fib projection at 106.44 is in view, shadowed by Quasimodo resistance at 106.58.
H1 timeframe:
Partly modified from previous analysis –
106 proved a fragile level yesterday, yet support drawn from 105.80 (previous Quasimodo resistance). South of here, we also have two trendline supports to be mindful of, extended from the low 104.55 and 104.41, along with a 100-period simple moving average.
The RSI indicator, as you might expect, in view of the upside movement since last week, continues to explore overbought territory. Notice that support also formed around the 44.00ish range, a common scenario in a rising market.
Observed levels:
The reaction from daily supply at 106.33/105.78 might tempt sellers to extend the unit lower and retest the 200-day simple moving average around 105.52. Given the monthly timeframe’s bullish position right now (see above), a dip to the SMA could spark a bullish theme. Note the SMA also coincides closely with H4 demand at 105.26/105.41.
GBP/USD:
Monthly timeframe:
(Technical change on this timeframe is often limited though serves as guidance to potential longer-term moves)
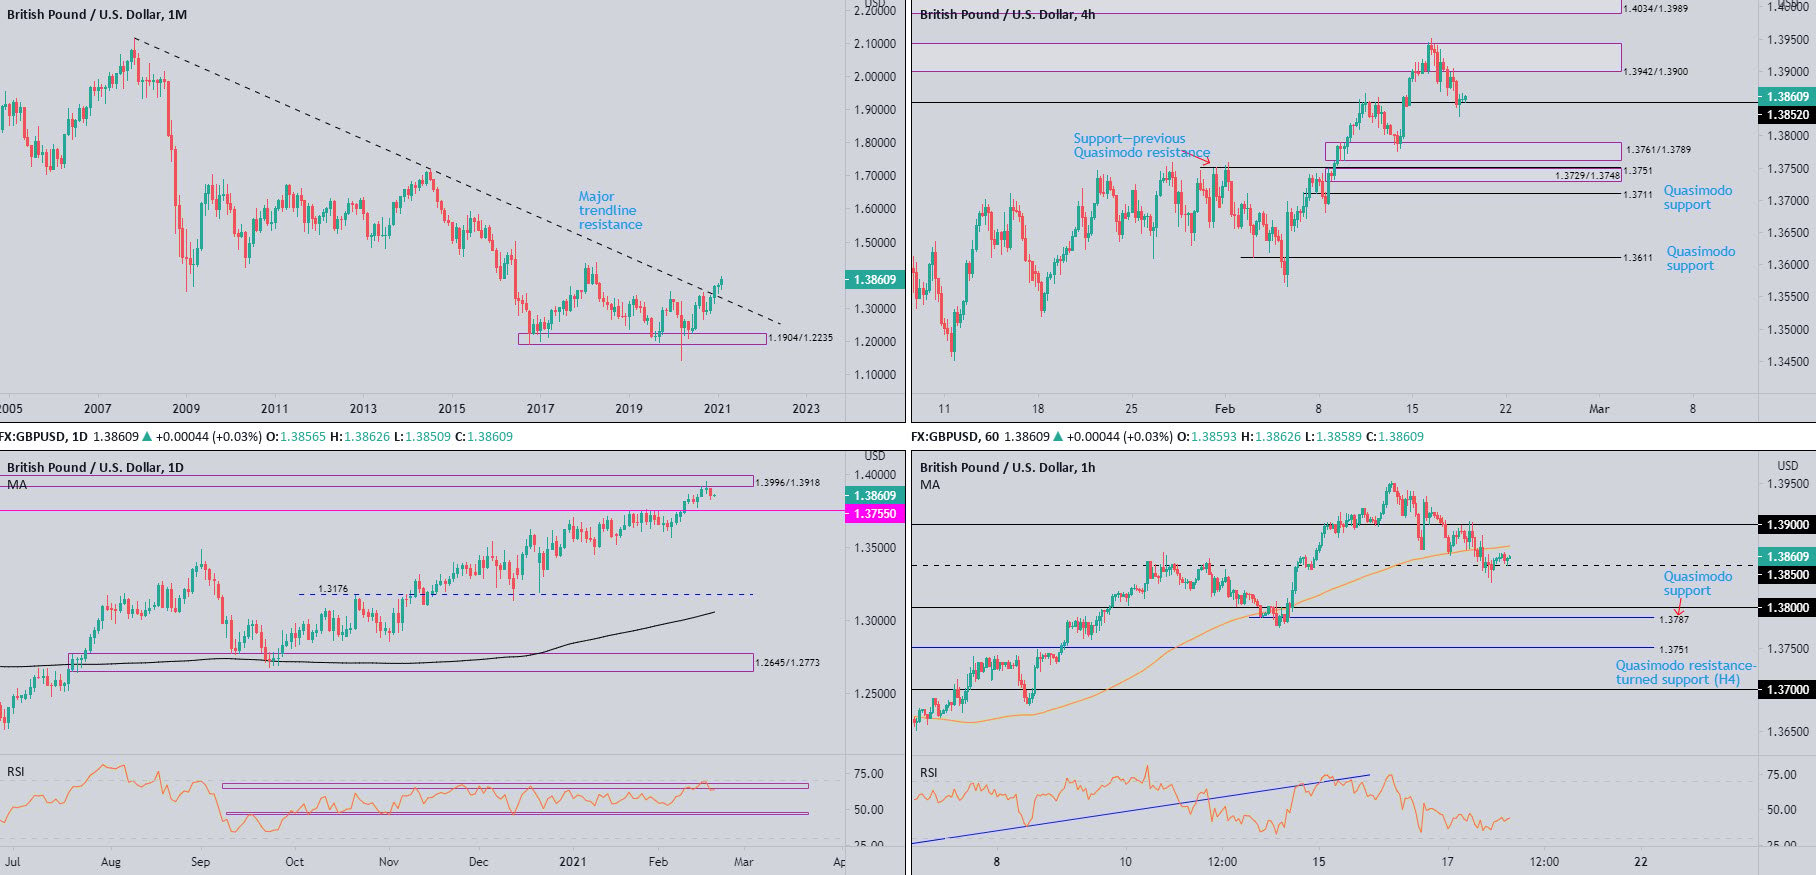
Following December’s 2.5 percent advance—movement that stirred major trendline resistance (2.1161)—February has refreshed multi-month highs at 1.3951.
In terms of trend structure, however, the primary trend has faced lower since early 2008, unbroken (as of current price) until 1.4376 gives way—April high, 2018. In effect, the aforesaid high represents the next upside objective on the monthly chart.
Daily timeframe:
After Tuesday’s indecision candle connected with supply at 1.3996/1.3918 and refreshed 2021 highs, Wednesday saw sellers step forward and shine light on support from 1.3755.
RSI action recently broke above the upper edge of a 3-month range between support around 47.00 and resistance at the 66.00 region (the value stands at 67.67), though recently retreated back into the consolidation after coming within touching distance of overbought levels.
H4 timeframe:
Brought forward from previous analysis –
Early hours Tuesday witnessed price movement puncture the upper side of supply from 1.3942/1.3900 (glued to the lower side of daily supply at 1.3996/1.3918). With many price action traders likely to view this as a bullish cue (sellers consumed at supply), dip-buying could emerge off support from 1.3852.
It should also be noted that a dip below 1.3852 could send price back to demand at 1.3761/1.3789.
H1 timeframe:
As can be seen from the H1 chart this morning, recent flow dived under the 100-period simple moving average and crossed swords with 1.3850 support. Below, 1.38 is on the radar, stationed just north of Quasimodo support from 1.3787. Above the 100-period simple moving average, on the other hand, we can see the 1.39 big figure resistance.
RSI movement bottomed ahead of oversold levels on Wednesday and is within touching distance of the lower side of 50.00.
Observed levels:
In similar fashion to Wednesday’s writing, the monthly timeframe eyeing 1.4376, in addition to H4 price testing support at 1.3852 and H1 1.3850 support, this could have buyers take the spotlight and attempt to bring things over the 100-period simple moving average on the H1 today.
DISCLAIMER:
The information contained in this material is intended for general advice only. It does not take into account your investment objectives, financial situation or particular needs. FP Markets has made every effort to ensure the accuracy of the information as at the date of publication. FP Markets does not give any warranty or representation as to the material. Examples included in this material are for illustrative purposes only. To the extent permitted by law, FP Markets and its employees shall not be liable for any loss or damage arising in any way (including by way of negligence) from or in connection with any information provided in or omitted from this material. Features of the FP Markets products including applicable fees and charges are outlined in the Product Disclosure Statements available from FP Markets website, www.fpmarkets.com and should be considered before deciding to deal in those products. Derivatives can be risky; losses can exceed your initial payment. FP Markets recommends that you seek independent advice. First Prudential Markets Pty Ltd trading as FP Markets ABN 16 112 600 281, Australian Financial Services License Number 286354.


 Access +10,000 financial
instruments
Access +10,000 financial
instruments