
Note—Charts provided by Trading View
EUR/USD:
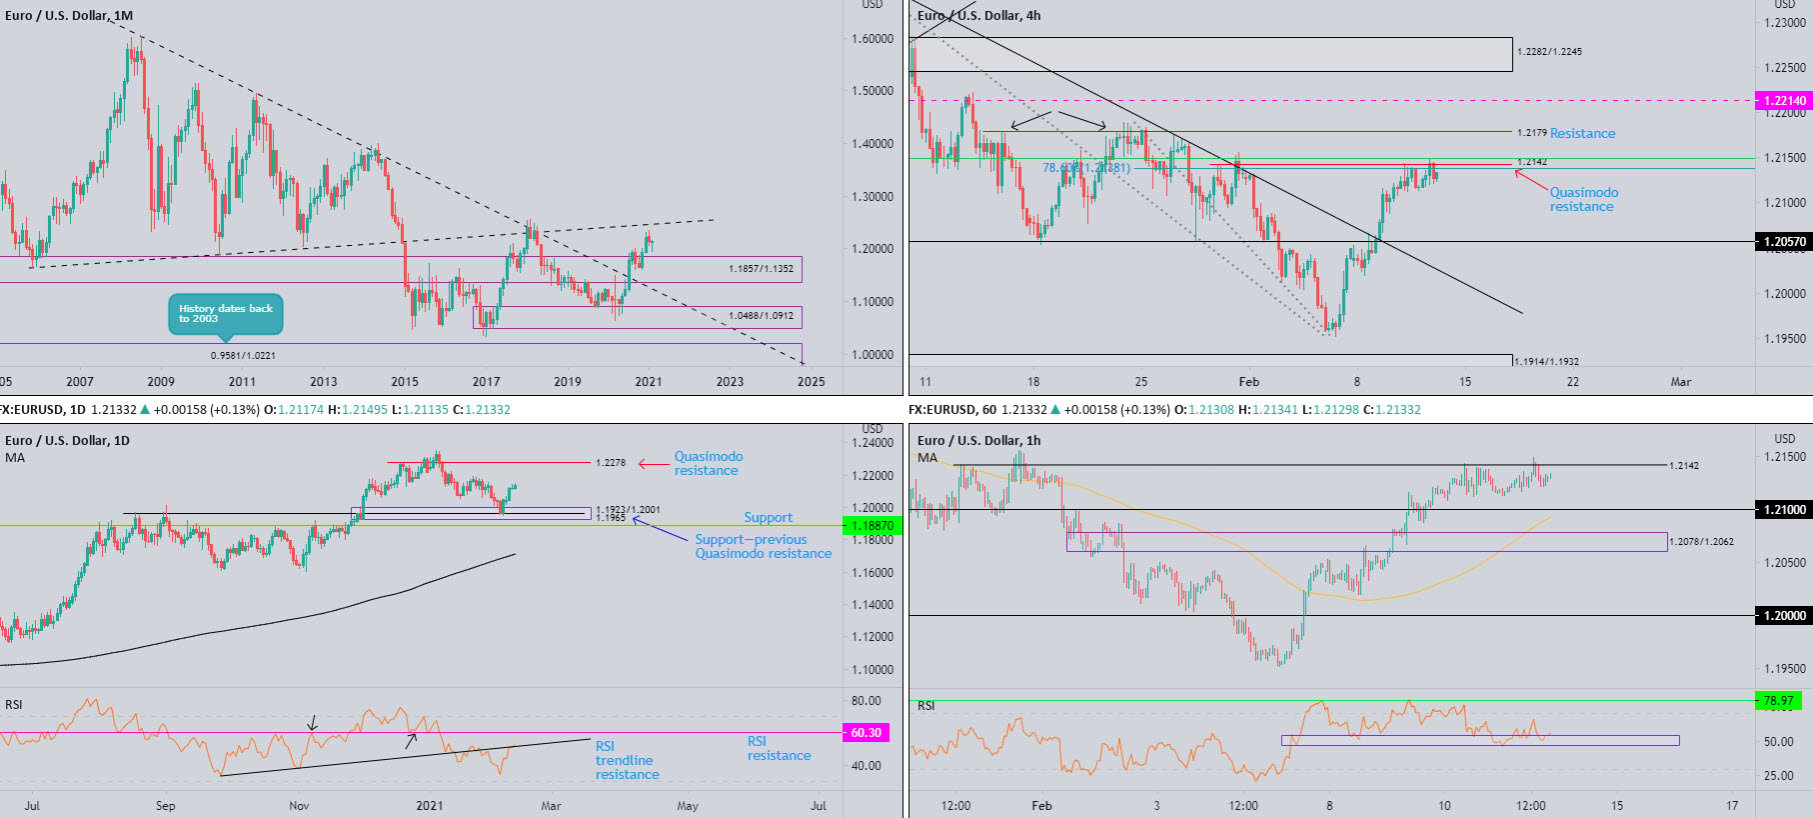
Monthly timeframe:
(Technical change on this timeframe is often limited though serves as guidance to potential longer-term moves)
February has witnessed a healthy floor of bids emerge around the 1.1950 neighbourhood, consequently provoking a hammer formation (though we will not know this until the month concludes).
To the downside, 1.1857/1.1352 represents demand, while northbound shines the technical spotlight on ascending resistance (prior support – 1.1641).
In terms of trend, the primary uptrend has been in play since price broke the 1.1714 high (Aug 2015) in July 2017.
Daily timeframe:
Unchanged from previous analysis –
The combination of demand at 1.1923/1.2001 and support at 1.1965 (previous Quasimodo resistance), has so far served buyers well.
As you can see, Thursday modestly built on recent upside, with price action closing in on 1.2190 tops, followed by Quasimodo resistance from 1.2278.
Technicians are also urged to chalk up support at 1.1887, realised a touch south of the aforesaid demand area.
With reference to the RSI indicator, the value (currently trades at 52.00) is on the doorstep of RSI trendline resistance and neighbouring RSI resistance at 60.30.
H4 timeframe:
Largely unchanged from previous analysis –
H4 remains testing the mettle of Quasimodo resistance priced in at 1.2142, a base aligning with a 78.6% Fib level at 1.2138 and a 50.0% retracement at 1.2149. Space north of here may call for resistance at 1.2179, with subsequent buying to possibly take aim at another resistance plotted at 1.2214.
In the event sellers make a show from current resistance, a dive to support at 1.2057 could be in store.
H1 timeframe:
Quasimodo resistance at 1.2142 noted on the H4 scale is also a prominent fixture on the H1 timeframe. In view of the lacklustre selling seen from 1.2142—unable to puncture 1.2115 and test 1.21 support—moves higher could be in store.
Consumed H1 Quasimodo resistance at 1.2173 signals the 1.22 resistance level could also be in the offing should 1.2142 give way.
47.05/54.20 support is visibly in play out of the RSI indicator, an area withstanding a handful of downside attempts since February 8.
Observed levels:
H4 Quasimodo resistance at 1.2142 is clearly under pressure, with sellers currently exhibiting a non-committal tone.
This—coupled with daily and monthly timeframes demonstrating room to scale higher—could trigger a bullish breakout theme north of 1.2142 today, with H4 resistance at 1.2179 targeted, closely followed by the 1.22 resistance (H1).
AUD/USD:
Monthly timeframe:
(Technical change on this timeframe is often limited though serves as guidance to potential longer-term moves)
January’s half-hearted shooting star candle (often interpreted as a bearish signal at peaks) has so far failed to seduce sellers. February, as you can see, trades a touch off session highs, up by about 1.5 percent.
This brings light to 0.8303/0.8082—a supply zone aligning closely with trendline resistance (prior support – 0.4776). In the event sellers regain consciousness, however, long-term demand resides at 0.7029/0.6664 (prior supply).
In the context of trend, the primary downtrend (since mid-2011) remains south until breaking 0.8135 (January high [2018]).
Daily timeframe:
Amid renewed USD softness, AUD/USD bulls went on the offensive Thursday and reclaimed Wednesday’s tentative bearish phase. Northbound, offers appear relatively thin until 0.7782 tops, along with the 2021 peak at 0.7820.
RSI flow dethroned the 50.00 centreline and landed the indicator within touching distance of RSI trendline resistance, with further upside to possibly touch overbought space.
H4 timeframe:
Latest developments on the H4 scale yesterday saw a breach of Quasimodo resistance drawn from 0.7747. Note price movement recently retested the level as support and, for now at least, is holding. Sustained strength to the upside could shift focus to resistance at 0.7805 as Quasimodo resistance at 0.7781 appears to have already been taken.
H1 timeframe:
Retreating from 0.7771 session peaks led AUD/USD back to retest the grip of 0.7750 support. Buyers and sellers are currently squaring off around the aforesaid level, with buyers poised to take control and throw light on a potential advance to Quasimodo resistance at 0.7777, with a break uncovering the 0.78 figure.
Recent movement out of the RSI indicator reveals the value balancing off 53.60 after an earlier push to highs ahead of overbought terrain.
Observed levels:
All four timeframes show buyers may be eyeballing higher ground. The combination of H4 support at 0.7747 and 0.7750 support could provide buyers a platform to work with today and push for at least H1 Quasimodo resistance at 0.7777.

USD/JPY:
Monthly timeframe:
(Technical change on this timeframe is often limited though serves as guidance to potential longer-term moves)
Since January snapped a four-month bearish phase in the shape of a bullish engulfing candle, buyers have struggled to find acceptance at higher levels. Consequent to this, February currently trades off best levels.
Resistance can be seen in the form of a descending line (not considered traditional trendline resistance), etched from the high 118.66, whereas follow-through weakness shifts focus to support at 101.70.
Daily timeframe:
Largely unchanged from previous analysis –
Wednesday exhibited a pretty much even session, with Thursday, albeit modestly higher on the day, unable to generate sufficient energy to breakout of Wednesday’s range.
Current movement follows the recent rejection from the lower side of supply at 106.33/105.78 and 200-day simple moving average at 105.55. Further selling could eventually pull things to trendline resistance-turned support, pencilled in from the high 111.71.
With reference to the RSI indicator, the value is testing the lower side of a support-turned resistance at 57.00. RSI fans may also note the recent trendline support break.
H4 timeframe:
Partly modified from previous analysis –
Tuesday’s downside move, as underlined in previous writing, landed Wednesday at the 38.2% Fib level taken from 104.50—a level representing the initial take-profit objective from the alternate AB=CD resistance at 105.63 (the 127.2% Fib extension).
As you can see, Thursday saw buyers maintain a somewhat cautious defence off the 38.2% Fib. South of here shines the technical spotlight on nearby trendline support (102.59), together with support at 104.16.
H1 timeframe:
104.50 continues to provide buyers with a supportive platform on the H1 scale, with price closing in on the 100-period simple moving average from 104.88, and possibly the 105 figure and 105.14 resistance.
What also remains interesting on the H1 is demand forged from 104.21/104.37. A whipsaw beneath 104.50 into the aforesaid demand could spark a short-term bullish scenario.
The RSI indicator has observed upside momentum level off just south of overbought territory.
Observed levels:
The daily timeframe’s downside flow implies longer-term sellers still have the upper hand until crossing swords with trendline support around the 103.70 neighbourhood.
With that in mind, a bearish theme may develop should H1 shake hands with the 100-period simple moving average from 104.88, or even the 105 figure and 105.14 resistance (between 105 and 105.14 we also see a H1 50.0% retracement at 105.08).

GBP/USD:
Monthly timeframe:
(Technical change on this timeframe is often limited though serves as guidance to potential longer-term moves)
Following December’s 2.5 percent advance—movement that stirred major trendline resistance (2.1161)—February refreshed multi-month highs at 1.3866.
In terms of trend, the primary trend has faced lower since early 2008, unbroken (as of current price) until 1.4376 gives way—April high, 2018. In effect, the aforesaid high represents the next upside objective on the monthly chart.
Daily timeframe:
Partly modified from previous analysis –
As you can see, buyers have so far failed to find grip north of 1.3819, despite Tuesday’s strong-willed advance above resistance at 1.3755. Candlestick enthusiasts will note two back-to-back shooting star candle patterns formed—structure generally interpreted as a bearish signal.
Follow-through moves to the downside could retest 1.3755 as support, though a bounce higher has supply at 1.3996/1.3918 to target.
Interestingly, the RSI indicator is seen touching gloves with the upper edge of a 3-month range between support around 47.00 and resistance at the 66.00 region (the value stands at 64.80). It is common to see higher oversold support areas form in an uptrend.
H4 timeframe:
Resistance at 1.3852, a previous Quasimodo support, remained a reasonably forceful ceiling on Thursday, threatening a possible dip to support at 1.3751 (prior Quasimodo resistance) and nearby demand at 1.3729/1.3748.
H1 timeframe:
Partly modified from previous analysis –
In conjunction with the H4 timeframe, the H1 chart also recently crossed paths with a modest Fib cluster (resistance) around 1.3850 (made up of a 161.8% Fib projection at 1.3850 and a 100% Fib extension at 1.3855).
Holding off the Fib arrangement guided a 1.38 retest on Thursday, a level which sparked modest intraday bullish interest. Traders will also note the 100-period simple moving average circling close by at 1.3789.
From the RSI indicator, the value nudged beneath trendline support and prompted a swift retest which held into Thursday’s close.
Observed levels:
Monthly price remains optimistic. Though given the daily bearish candlestick formations, a 1.3755 support retest may have to occur before buyers make an entrance.
In tandem with the daily scale, H4 also shows room to retreat as far south as support at 1.3751, located a touch under daily support at 1.3755.
Does this imply H1 buyers around the 1.38 figure are on thin ground? As a push south of here also directs focus to H4 support at 1.3751.

DISCLAIMER:
The information contained in this material is intended for general advice only. It does not take into account your investment objectives, financial situation or particular needs. FP Markets has made every effort to ensure the accuracy of the information as at the date of publication. FP Markets does not give any warranty or representation as to the material. Examples included in this material are for illustrative purposes only. To the extent permitted by law, FP Markets and its employees shall not be liable for any loss or damage arising in any way (including by way of negligence) from or in connection with any information provided in or omitted from this material. Features of the FP Markets products including applicable fees and charges are outlined in the Product Disclosure Statements available from FP Markets website, www.fpmarkets.com and should be considered before deciding to deal in those products. Derivatives can be risky; losses can exceed your initial payment. FP Markets recommends that you seek independent advice. First Prudential Markets Pty Ltd trading as FP Markets ABN 16 112 600 281, Australian Financial Services License Number 286354.


 Access +10,000 financial
instruments
Access +10,000 financial
instruments