
Charts: Trading View
(Italics: Previous Analysis)
EUR/USD:
The highlight of Thursday’s session was inflation figures out of the US. January’s consumer price index (CPI), on a month-on-month basis, rose 0.6 percent (versus 0.5 percent in December). The year-on-year figure for January, nonetheless, jumped 7.5 percent, beating economists’ forecasts of 7.3 percent and December’s 7.0 percent reading. Core year-on-year inflation, excluding food and energy, rose 6.0 percent.
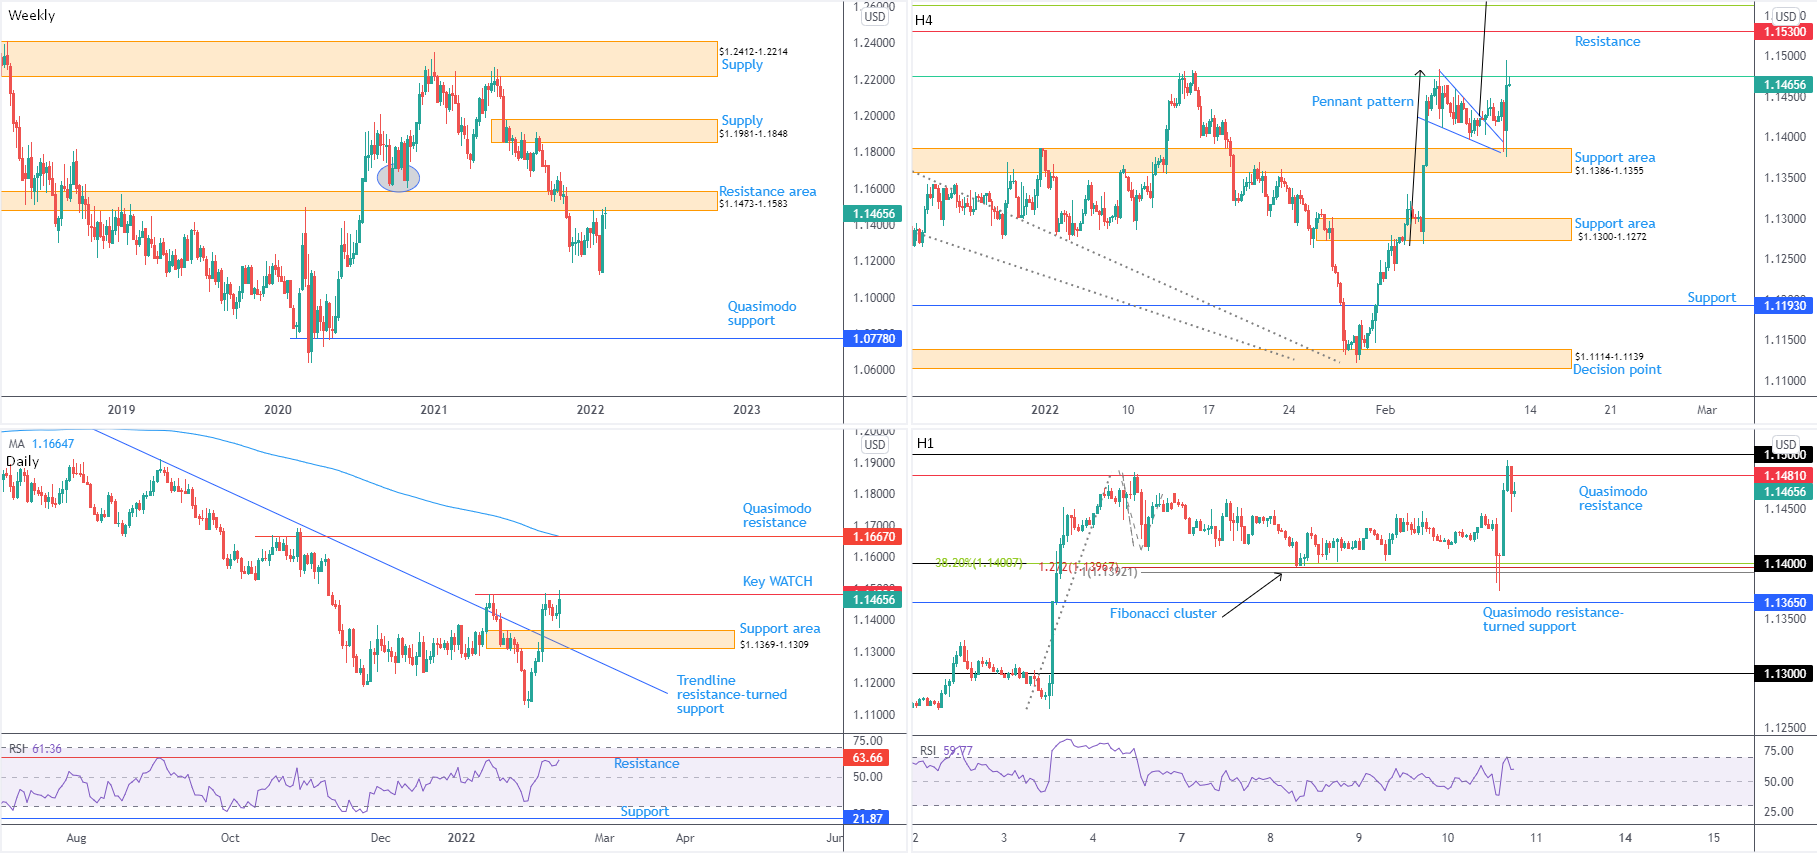
The US dollar index (USDX) immediately navigated higher territory, clocking a peak of 96.00 before withdrawing and erasing earlier gains. This elevated EUR/USD heading into Thursday’s US cash open, technically reinforced by the H1 timeframe shaking hands with $1.14 (complemented by a Fibonacci cluster between $1.1392 and $1.1400) and the H4 connecting with support from $1.1386-1.1355. H1 is now testing Quasimodo resistance at $1.1481, organised under $1.15.
Pattern traders may recall Thursday’s technical briefing:
The H4 timeframe breached the upper boundary of a pennant formation, drawn from the high $1.1484. This implies a test of the H4 61.8% Fibonacci retracement at $1.1475 (green), followed by H4 resistance at $1.1530.
As you can see, $1.1475 entered the frame, with the possibility of reaching for $1.1530 on the H4 scale.
Upstream, the weekly timeframe has witnessed limited change since previous analysis:
The weekly timeframe is attempting to fade the lower side of long-standing resistance at $1.1473-1.1583, a base entertaining active S/R since late 2017. Technicians will acknowledge current trend sentiment favours the rejection, communicating a bearish environment on the weekly timeframe since topping at $1.2350 at the beginning of January (2021). This is reinforced by the monthly timeframe’s long-term (some would say ‘primary’) downtrend since mid-2008.
From the daily timeframe, the $1.1483 14th January peak (marked key watch) remains active. Support is present at $1.1369-1.1309, which happens to intersect with a recently breached trendline resistance, taken from the high $1.2254; a $1.1483 breach swings the technical pendulum in favour of further upside towards Quasimodo resistance at $1.1667 and the 200-day simple moving average, currently circling $1.1665. Supporting $1.1483, however, is RSI (relative strength index) resistance at 63.66.
While the higher timeframes test resistances, traders who read recent writing might also recall the following:
The profit objective derived from the H4 pennant is somewhat ambitious considering the unit trades from higher timeframe resistance (see above). By extending the ‘pole’ distance (black arrows) and adding this value to the breakout point, the pattern’s upside target is within close range of $1.1650 (above current weekly resistance at $1.1473-1.1583 and nearby daily resistance coming in at $1.1667).
Technically this is a difficult market. Higher timeframes pushing out a bearish tone weighs on the bullish vibe currently observed on the lower timeframes (H4 and H1).
A daily close materialising north of $1.1483 is likely to be viewed as bullish, and unlocks the possibility of a run to daily Quasimodo resistance at $1.1667, which would complete the H4 timeframe’s pennant profit objective at $1.1650. Short-term traders, therefore, may monitor for a $1.15 breach to the upside to help validate a bullish showing.
AUD/USD:
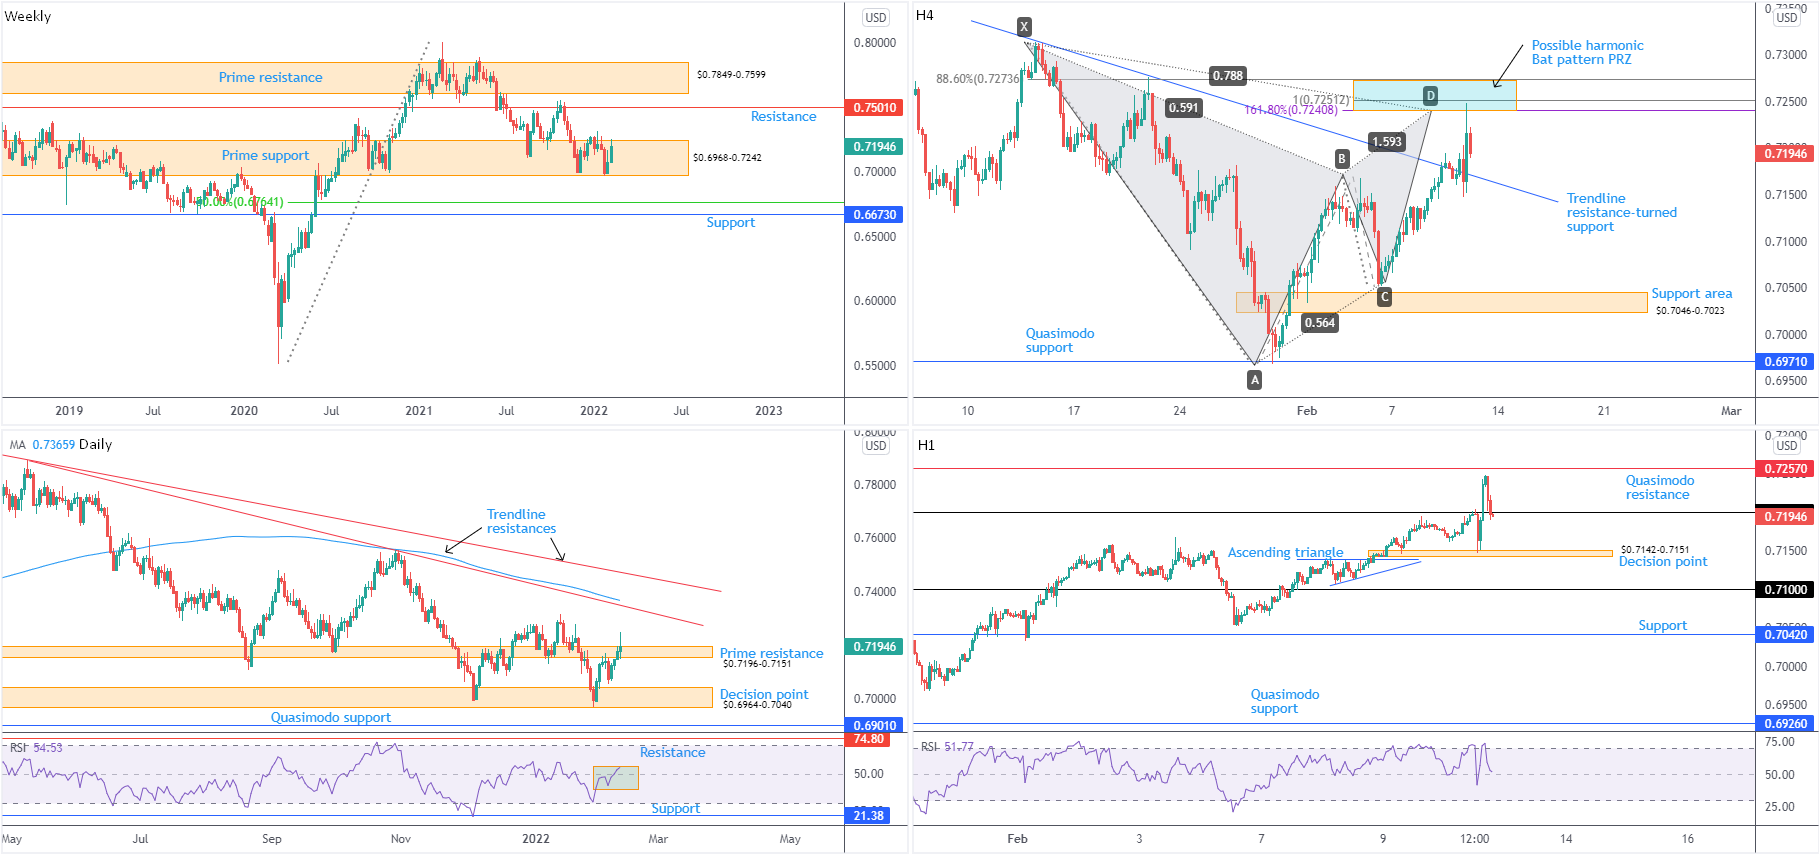
In the immediate aftermath of Thursday’s inflation data—US year-on-year inflation for January rose to levels not seen since 1982—AUD/USD voyaged lower and crossed swords with a H1 decision point from $0.7142-0.7151. Subsequent movement reclaimed $0.72+ status but failed to address neighbouring Quasimodo resistance at $0.7257, as the H4 timeframe’s harmonic Bat pattern’s PRZ between $0.7274 and $0.7241 put in an appearance. Follow-through downside places $0.72 in the light, while further south directs attention to H4 trendline resistance-turned support, extended from the high $0.7313.
Out of the higher timeframes, prime support on the weekly timeframe remains in play at $0.6968-0.7242. This casts light on weekly resistance at $0.7501, despite the immediate trend/correction (since $0.8007) suggesting upside momentum could wane. Recent downside is further emphasised on the monthly timeframe, stepping lower since 2011.
The daily timeframe’s prime resistance at $0.7196-0.7151 came under siege in recent trading, having its upper boundary challenged which likely tripped a number of stops in the process. Overthrowing this area would help confirm buyer intent within the weekly prime support, zeroing in on daily trendline resistance, taken from $0.7891, and the 200-day simple moving average at $0.7366. It may also interest traders to note the relative strength index (RSI) journeyed above the 50.00 centreline, a move highlighting positive momentum (average gains exceeding average losses).
From a technical perspective, the H4 timeframe’s trendline resistance-turned support, extended from the high $0.7313, is likely to be watched, as well as the H1 decision point at $0.7142-0.7151. The rationale behind this is the weekly timeframe showing strength within prime support at $0.6968-0.7242 and daily prime resistance hanging by a thread at $0.7196-0.7151. As such, a rebound from the aforementioned H1 and H4 technical structure could be seen.
USD/JPY:
Stronger-than-expected US year-on-year inflation underpinned US Treasury yields on Thursday, lifting the benchmark 10-year note above 2.0 percent, levels not seen since August 2019.
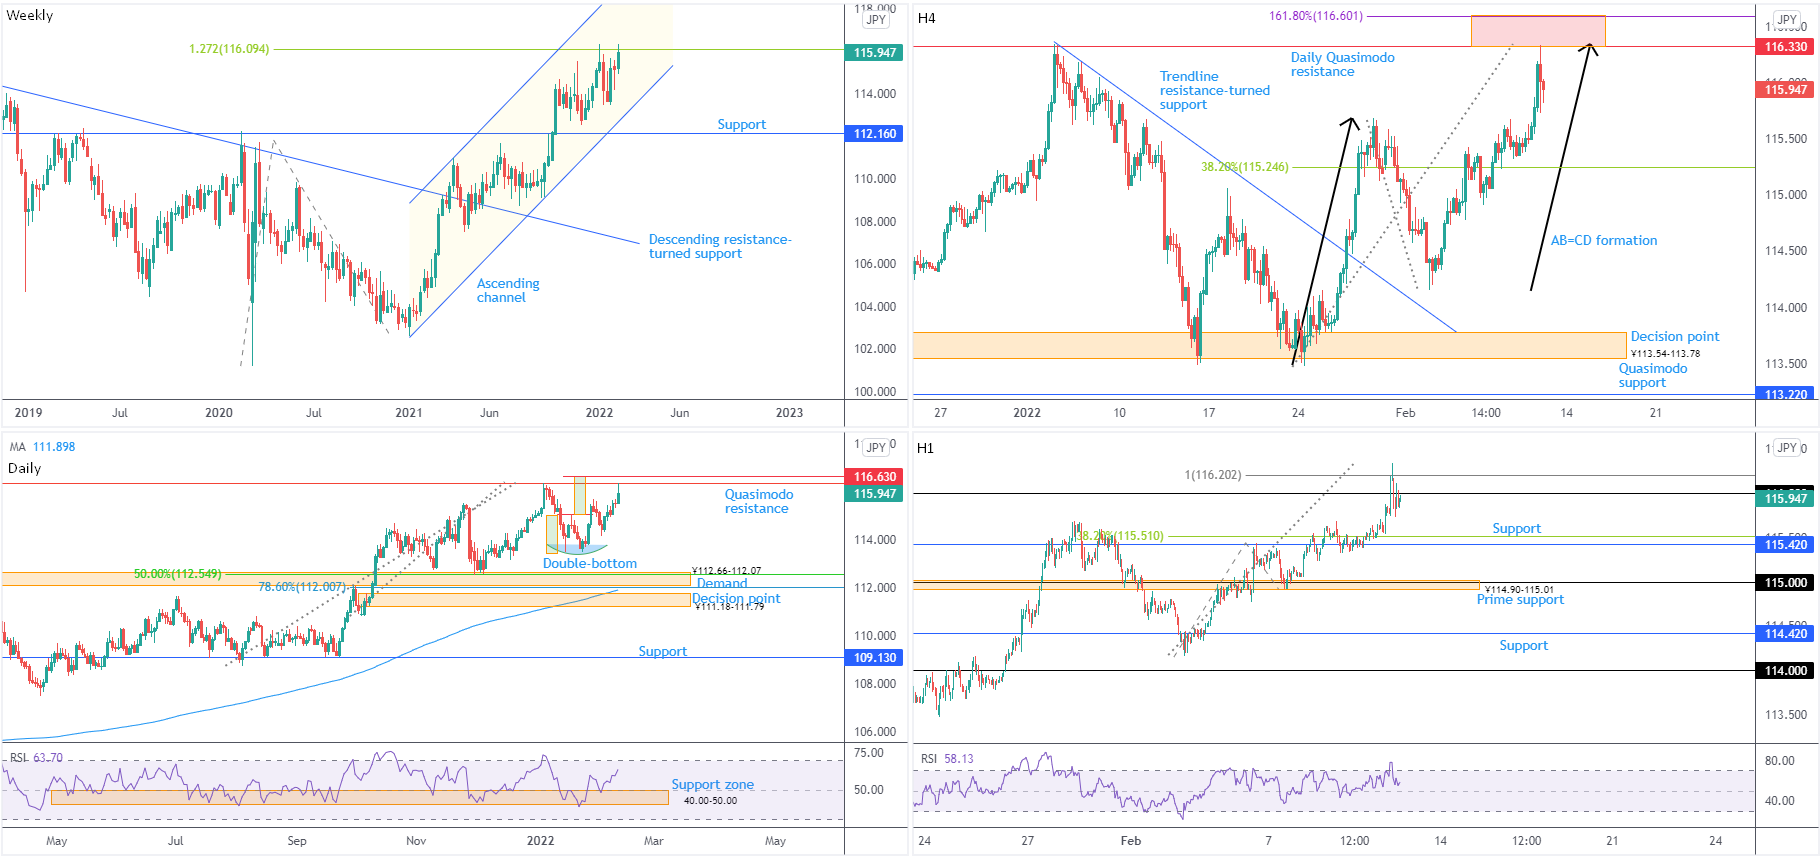
The inflation release provided an immediate bid for USD/JPY, whipsawing north of ¥116 to test the H1 timeframe’s 100% Fibonacci projection at ¥116.20 (AB=CD structure), together with the daily timeframe’s Quasimodo resistance at ¥116.33, the H4 timeframe’s AB=CD structure (black arrows) and the weekly timeframe’s 1.272% Fibonacci projection from ¥116.09. Technicians will also note the daily Quasimodo resistance is plotted just under the double-bottom’s pattern (¥113.48) profit objective at ¥116.63.
Despite the currency pair trending higher since 2021, the noted resistance confluence has clearly attracted attention and sellers are beginning to show interest. The caveat, of course, is the daily timeframe’s relative strength index (RSI) displaying scope to extend north of the 50.00 centreline to connect with overbought territory. This follows a bounce from support between 40.00 and 50.00 (a ‘temporary’ oversold range since 10th May—common view in trending markets).
Technically, the AB=CD structure out of the H1 and H4 timeframes deliver initial downside objectives in the shape of 38.2% Fibonacci retracements (derived from A-D legs) at ¥115.51 and ¥115.25, respectively. Note, the H1 level sits just north of H1 support from ¥115.42.
While the trend faces north, the gathering of resistance in this market could lead H1 candles lower to connect with the 38.2% Fibonacci retracement at ¥115.51 and H1 support at ¥115.42, followed by the H4 timeframe’s 38.2% Fibonacci retracement at ¥115.25.
GBP/USD:
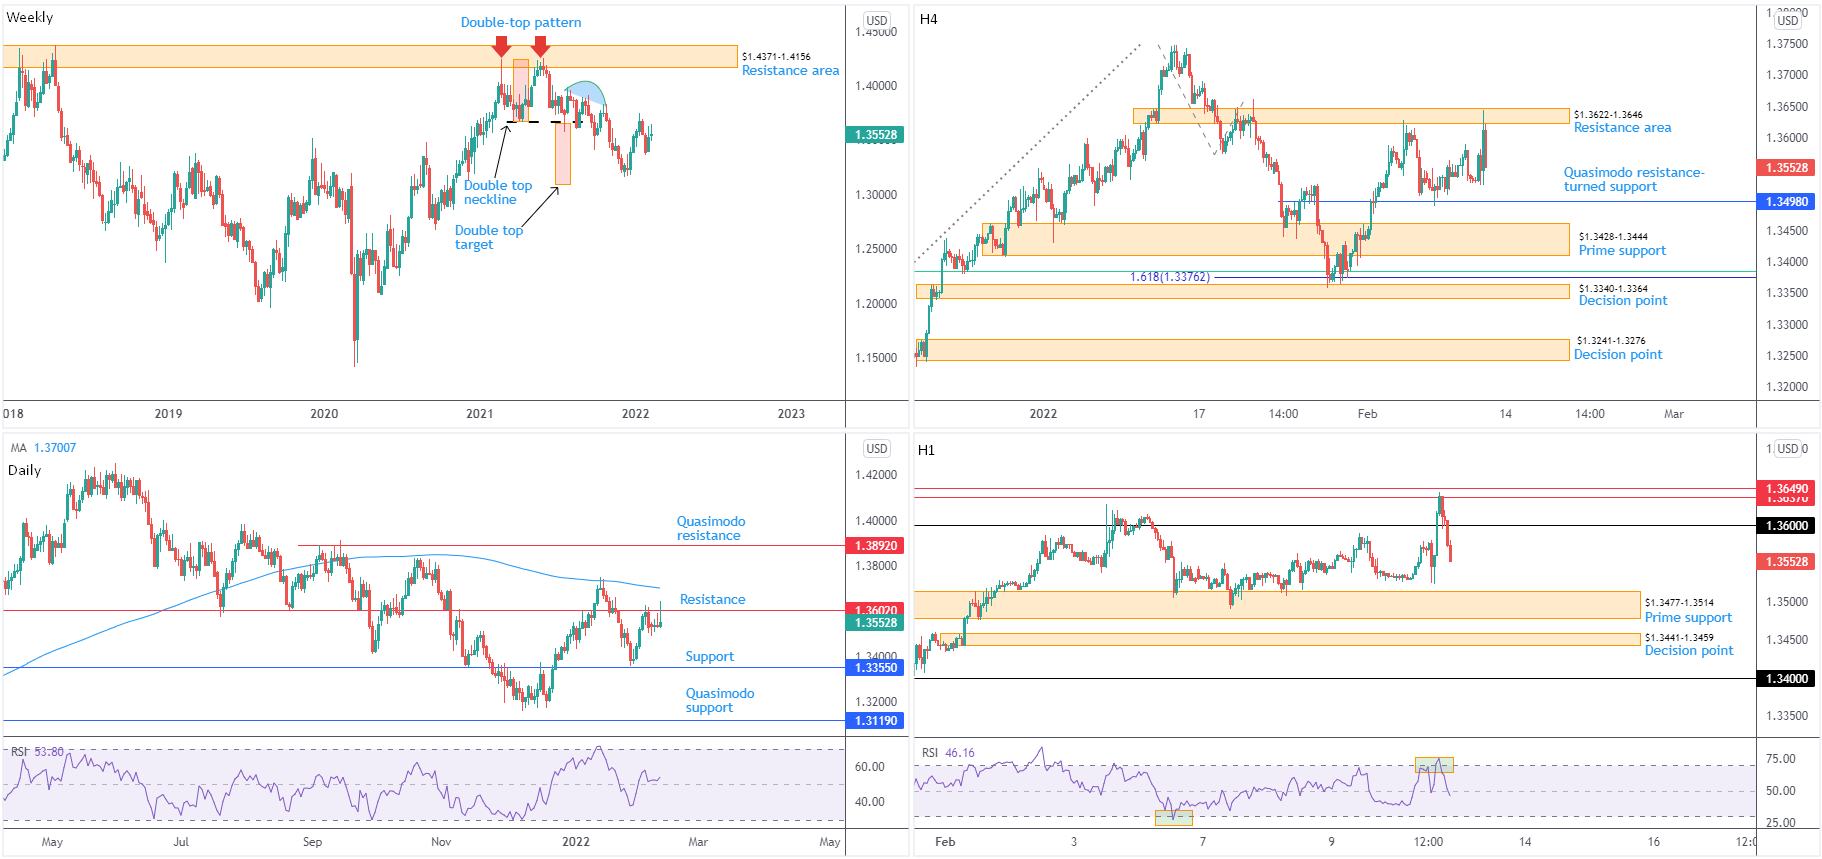
Versus the dollar, the British pound sunk 40+ pips in response to stronger-than-anticipated year-on-year US inflation in early US hours on Thursday. Leaving H1 prime support at $1.3477-1.3514 unchallenged, however, GBP/USD discovered a floor at $1.3523 and aggressively whipsawed above $1.36 to test H1 Quasimodo resistance at $1.3637 (arranged just south of another layer of Quasimodo resistance at $1.3649). $1.3477-1.3514 is now back on the hit list, closely shadowed by the H1 decision point from $1.3441-1.3459.
Aiding H1 Quasimodo resistance yesterday was the H4 timeframe’s resistance area at $1.3622-1.3646. Downside targets on the H4 reside at Quasimodo resistance-turned support at $1.3498 (sat within H1 prime support) and prime support at $1.3428-1.3444 (houses the H1 decision point at $1.3441-1.3459).
Moving out to the bigger picture, aside from Thursday’s shooting star candlestick pattern on the daily timeframe, technical structure remains unchanged:
Technical observations draw attention to daily resistance at $1.3602, a base entering the fight at the tail end of last week. Weakness from here shines the technical spotlight on support at $1.3355, with follow-through downside perhaps throwing Quasimodo support into the mix at $1.3119. Of note, the aforementioned support shares chart space with the weekly timeframe’s double-top pattern’s ($1.4241) profit objective at $1.3090. If daily action moves above current resistance, traders are urged to pencil in the 200-day simple moving average at $1.3701.
Technically, trend studies remain unchanged. Despite the 7.5 percent dip from ‘double-top’ peaks at 1.4241, the weekly timeframe has been higher since early 2020. However, it’s important to recognise that while the trend on the weekly timeframe demonstrates an upside bias, the monthly timeframe’s long-term trend has been lower since late 2007 and the daily price trades beneath its 200-day simple moving average.
Chart studies imply a continuation lower until reaching H4 prime support at $1.3428-1.3444 and the H1 decision point at $1.3441-1.3459. This is due to daily resistance maintaining position at $1.3602 and H4 Quasimodo resistance-turned support at $1.3498 (and H1 prime support at $1.3477-1.3514) already being tested.
DISCLAIMER:
The information contained in this material is intended for general advice only. It does not take into account your investment objectives, financial situation or particular needs. FP Markets has made every effort to ensure the accuracy of the information as at the date of publication. FP Markets does not give any warranty or representation as to the material. Examples included in this material are for illustrative purposes only. To the extent permitted by law, FP Markets and its employees shall not be liable for any loss or damage arising in any way (including by way of negligence) from or in connection with any information provided in or omitted from this material. Features of the FP Markets products including applicable fees and charges are outlined in the Product Disclosure Statements available from FP Markets website, www.fpmarkets.com and should be considered before deciding to deal in those products. Derivatives can be risky; losses can exceed your initial payment. FP Markets recommends that you seek independent advice. First Prudential Markets Pty Ltd trading as FP Markets ABN 16 112 600 281, Australian Financial Services License Number 286354.


 Access +10,000 financial
instruments
Access +10,000 financial
instruments