
Reading Time: 8 Minutes
Technical analysts, or ‘chartists’, employ charts to evaluMain Types of Forex Chartsate the real-time price movements in financial markets, such as foreign exchange (Forex—think currency pairs), equities, indices, commodities and cryptocurrencies (note each of the aforementioned markets can be traded through CFDs, or contract for differences). A chart shows the collective investment choices of all market participants over a certain time period in an easy-to-read graphic format. Hourly time periods (or time frames) are made up of hourly data points that give users a more detailed picture of how the market is moving. A daily chart is made up of intraday data that’s been condensed to demonstrate each day as a single data point. So, charts are used by short-term (think day trading) and long-term traders (position traders).
The use of a chart is primarily to assess price action to help identify potential trend structure and patterns.
MT4 charts deliver a user-friendly interface, making them a fantastic choice for beginner traders. Assuming time-series data, date and time are located across the horizontal panel (x-axis) at the bottom of the chart, with the vertical panel (y-axis) located on the right side of the chart that contains price data. Navigating to the left of the chart, traders can observe historical prices. Dates and hours, of course, will vary based on how far you scroll back, consequently displaying historical price fluctuations.
The line chart, bar chart, and candlestick chart are three of the most widely used charts among the technical community, each offering unique characteristics.
Line Chart
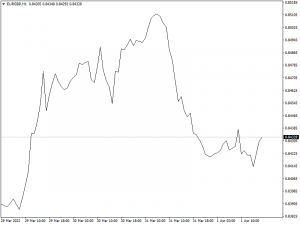
(Source: MetaTrader 4 EUR/GBP Line Chart)
A line chart also referred to as a line graph, presents a series of data points, usually via closing price points. That means high, low and opening price data are filtered out. But a line chart can be formed of any data series, as long as data form a consecutive series.
Closing prices are important. As a result, having a way of charting closing prices in an easy-to-read format is desirable for many traders and investors. Line charts are also particularly useful to help identify (and track) long-term trends (uptrends and downtrends), as well as locating support and resistance levels (horizontal lines).
Bar Chart

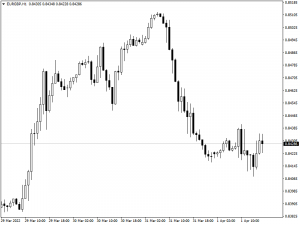
(Source: MetaTrader 4 EUR/GBP Bar Chart)
Differing from the line chart, another alternative is the bar chart—or ‘western bar chart’. Individual bars are composed of open, high, low and close data, presented over selected time periods (daily bars, weekly bars, five-minute bars, for example). For instance, the chart depicted above shows the hourly bars, meaning a bar is formed (closed) each hour (24 bars within a day).
- Open is the beginning of a bar’s creation.
- High is the highest price a bar traded during its life, a point buyers were not willing to ‘bid beyond’. Note this may also be called ‘upper shadow’ or ‘wick’.
- Low is the lowest point a bar traded during its life, a point sellers were not willing to commit. It’s important to also be aware that traders also refer to the low as either a ‘lower shadow’ or ‘wick’.
- Close is simply the price level at the bar closed.
Sometimes called the ‘OHLC’ chart, this enables chartists to visually depict more information than a line chart. By way of an example, a bar chart portrays volatility, generally seen through the range (between the high and low of the bar’s price range). A wider (larger) bar indicates higher volatility; quieter trading sessions will contain smaller bars.
Bar charts are good for not only applying support and resistance but also good for highlighting pattern structures, such as double-bottom patterns and head and shoulder formations.
Candlestick Chart
(Source: MetaTrader 4 EUR/GBP Candlestick Chart)
The candlestick chart is by far the most popular of the three charts shown. As you can see from the image below, an individual candlestick offers a similar view to a western bar, containing open, high, low and close points. The key difference is the real body—the difference between the open and close. With a western bar, it’s essentially void of a body and shown by way of a vertical line.
A green candle highlights a bullish setting whereas a red coloured body represents a bearish environment. However, colours are trader dependent and can be modified through the trading platform (the chart above shows a bullish candle in white and a bearish candle in black).
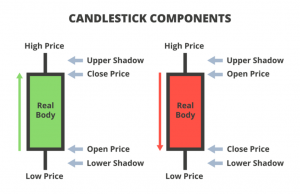
The great thing about candlestick charts is they offer everything a bar chart does but allows for more straightforward visualisation due to the real body of the candle. Japanese candlestick patterns, such as bullish and bearish engulfing configurations and hammer patterns are just some of the formations traders and investors can use within an FX trading strategy.
Technical Analysis—Forex Trading Charts
Both western bar charts and Japanese candlestick charts permit traders and investors to apply a wide array of technical indicators and allow for chart pattern recognition. However, as alluded to in the article, candlestick charts are the more preferred choice among technical analysts.
Consider opening a demo account with FP Markets today and test your trading knowledge with our cutting-edge trading platforms. FP Markets is a one-stop destination for trading and investing, opening the door to a wide range of tradable financial instruments.


 Access +10,000 financial
instruments
Access +10,000 financial
instruments