
Continuing confidence in a recovering economy is driving the markets higher (and FED money) with all-time highs achieved in the major US indices with the Australian XJO about 120.0 points away from a new all-time high.
Technically markets are in an early stage of a price movement with the potential to reach higher before any meaningful retracement.
Copper sets a new bullish pennant breakout signal on the Weekly chart.
Both Gold and Silver are challenging their respective higher resistance levels, as is WTI Oil.
XJO WEEKLY
Price structure:
Last week saw the second bar outside of the Bollinger bands. With the bands now starting to expand.
The resistance level of 7130 remaining in play, there is no evidence of price reversal.
It is important to acknowledge where this analysis would be incorrect, in this case a close below the key level of 6737, would signal a false breakout and a bearish move underway.
Indicator: Relative Strength
The RSI indicator has remained over the key 50 level, last week turned higher again, this is a good signal of improving price momentum. The potential divergence signal has been negated, so the indicator remains a bullish signal for further positive price momentum.
The RSI should be monitored for a potential move below the key level of 50 to show a shift to bearish momentum.
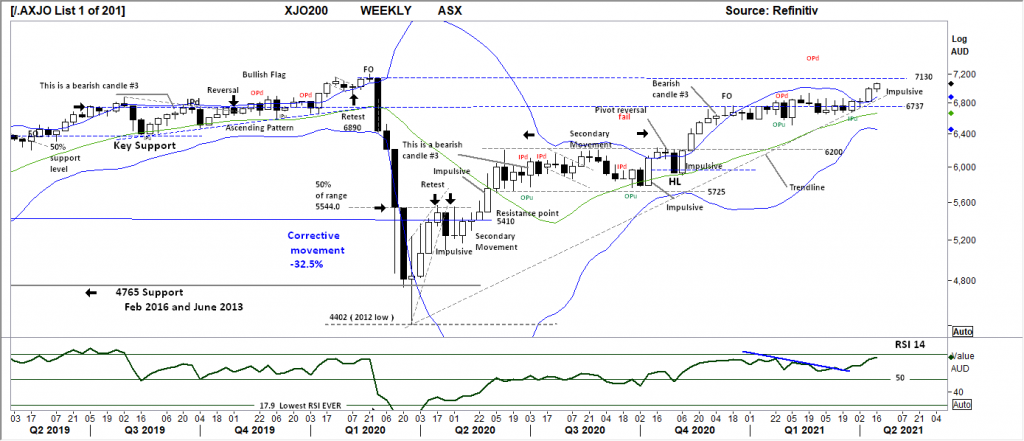
Comments from last week: Last week the breakout arrived with a strong open to close price range above the consolidation of the past 19 weeks. The 7130-resistance level is now in play. The chart has the Bollinger Band overlay, a measure of “relative” price volatility, currently showing a narrowing Bollinger Band “squeeze” indicating volatility was relatively low. Last week’s range is outside of the band, this type of early breakout often leads to a continuation movement as “relative” price volatility expands.
XJO DAILY
Price structure:
The XJO Daily shows the closing price towards the high of the week as an inside period (IP), indicating the market is in balance at this current level, very similar to the previous weeks Friday close. (marked)
Using the 5-period simple moving average, the market can be described as conducting an extended move with continuing closing price above the average line.
Indicator: Relative Strength
With RSI making a new move above the key 50 and 70 level bodes well for further gains with a move above the 70 a signal of very strong price momentum. The RSI can remain above the key 70 level for many weeks and should be monitored for a Bearish divergence signal. Currently a divergence signal will is not in play as the RSI made a new high last week in line with the market movement.
Indicator: VOLUME
Overall volume has been increasing as price rallies, Last Fridays inside period (IP) high was not outstanding leading into the weekend. Further price gains would again need strong volumes to confirm broad market participation.
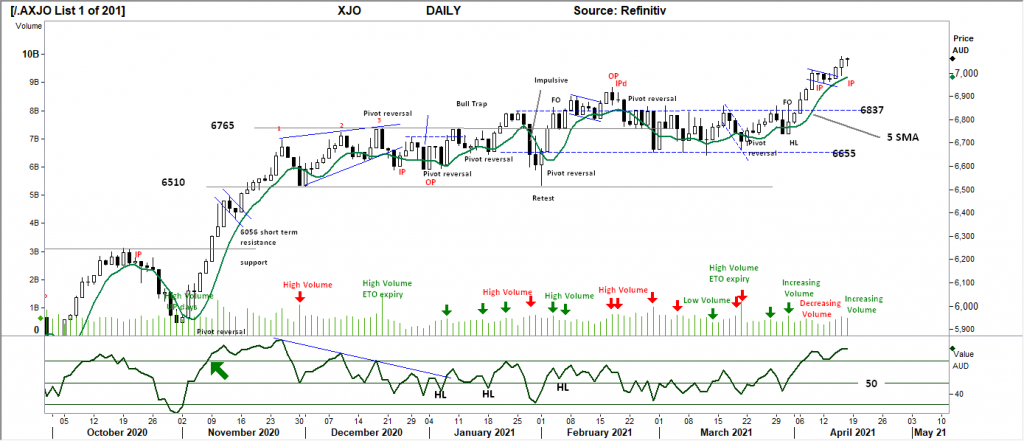
Comments from last week: Strong daily price ranges leading into Fridays inside period (IP). Follow through higher could be expected, the first signal would be a close above the current high of 7012.0.
The intraday key reference for support is now the 7000 points level.
The daily trend has now resumed to UP, with last week’s larger price range days shown on
Tuesday and Thursday the impulsive price movement should continue into early this week.
S&P 500 WEEKLY
Price structure:
A very strong price movement underway wit continuing low to high closing bars.
The 3980 is now the key short-term level to hold on any retracement.
The underlying primary trend remains very strong.
Last week’s low of 4114.0 should be used as the first intimate support level, traders should be aware of a potential close below this level as the first reversal signal.
Indicator: Relative Strength Indicator
Overall, the RSI is currently reflecting stronger price momentum as the indicator moves higher to the 70 level, this is not a level of over brought, and only indicates very strong momentum, and can last for many weeks. (This type of momentum is often a precursor to profit taking.)
Should the RSI show a movement below the 50 level, this would signal strong bearish price momentum.
It should be acknowledged the RSI has also remained above the 50 level for the past 12 months.
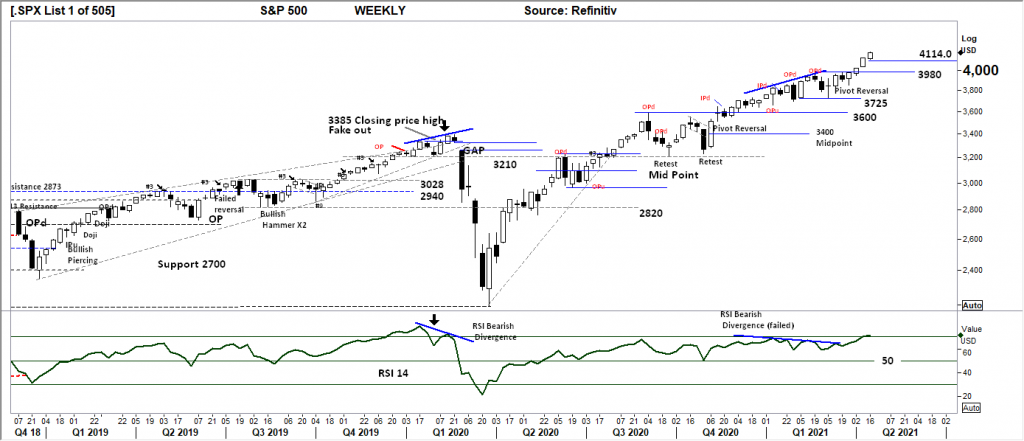
Comments from last week: The very strong price range of last week the third week of gains, may end with an exhaustion move this week. Following 3 weeks of strong gains, some profit taking would be expected.
The recent Weekly highs of 3980 provides the immediate support level to hold should a profit taking retracement occur.
It important to note, the Primary Price trend remains UP and there are NO price reversal signals.
S&P 500 DAILY
Price structure:
The Daily chart shows a short term trendline developing. For short term traders a reversal would gain weight with a close below the 4100 level (this would also confirm the Weekly reversal).
Friday has traded as a short range day and may introduce some price consolidation at this level in the coming days.
Support levels will be the key observation this coming week.
Indicator: Relative Strength
Relative strength short term has turned sharply higher above the 70 level. The RSI should be monitored for a movement and continuing close above the 70 level.
As upward price momentum may be subject to some profit taking a sideways movement could be expected, this would now be monitored for a Bearish divergence signal.
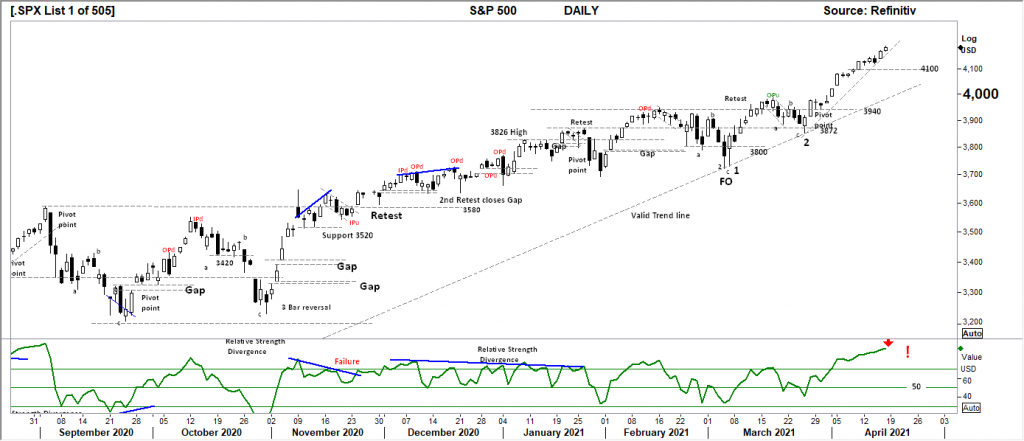
Comments from last week: The daily price chart can only be described as an extended move underway. Last Friday’s strong close should see some early follow through this week.
Doing a count back there have been 10 days of relative price gains without a meaningful retracement. A quick study of the chart shows this is an extended move and often leads to some form of retracement or consolidation.
This could be expected later this week.
USD Spot GOLD – DAILY
Price structure:
A new Primary trend is now underway.
There is a significant price movement underway. Importantly the resistance level of $1764.30 has been crossed. Any price retracement should use this key level as a continuing support level.
Both the Australian and US GDX ETF is showing early signals of an emerging UP trend.
This a particularly good signal for major Gold mining stocks to show price gains in the coming week.
The smaller Australian speculative stocks will remain news dependant and price dependant on the AUDXAU price chart. (see below).
Indicator: Relative Strength
Relative Strength turns higher to remain above the key “50” level. This is an early signal of changing momentum and should be monitored for a further close above this level.
Look for a continued upturn in the RSI to confirm any potential price rally getting underway.
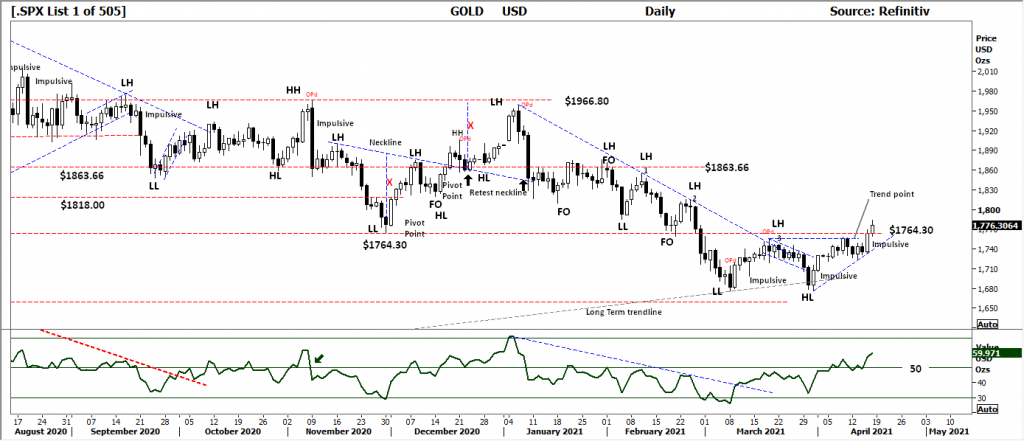
Comments from last week: The upside target mentioned last week should remain the key resistance level in the coming week.
The daily chart shows a lower “shadow” on Friday’s bar, a sign of support following the recent price gains.
A breakout above $1764.30 would be a very bullish signal for Gold stocks and further gains in the underlying metal.
This daily Gold chart is on the verge of entering a Primary UP trend, the current “trend point” is marked, a close over this level would signal the UP trend in place.
AUD GOLD DAILY
Price structure:
The AUDUSD Gold price is moving away from the Primary down trend into a new UP trend.
Two potential resistance down trendlines are broken with a new closing high on Friday.
Currently the AUDUSD is at a 2-month closing high and set the stage for price recovery in Australian listed Gold producers.
The smaller Australian speculative explorer stocks will remain news dependant.
Indicator: Relative Strength
This momentum indicator has continued a swing higher over the key 50 level in line with price gains to reconfirm a valid RSI buy signal.
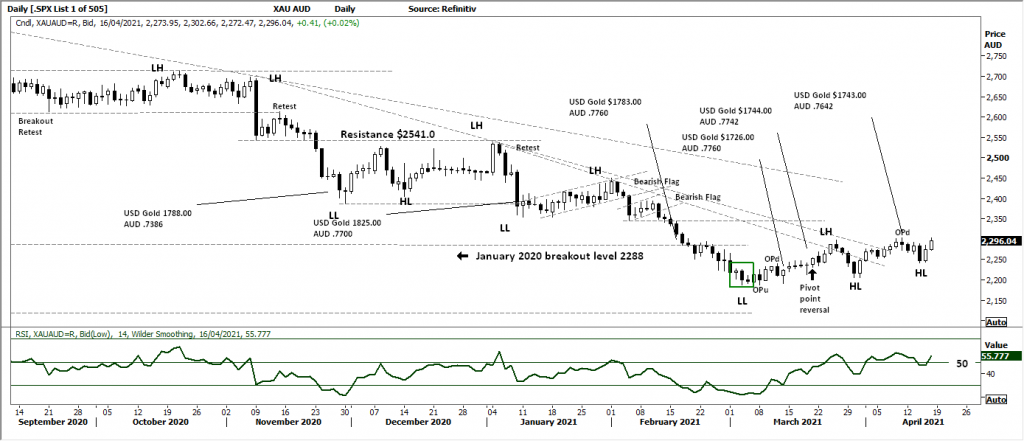
Comments from last week: The AUDUSD Gold price remains constructive for further gains, this will underpin advances in the Australian listed Gold producers gains of the past week and sets a strong signal of further gains in the Gold miners / producers.
Although the price chart has yet to show real strong price momentum change, the continuing consolidation along these levels offers strong evidence the base is building for a continued move higher.
SILVER DAILY
Price structure:
The support resistance level of $26.00 has been an important level for the past 10 months.
Silver has again recovered to this level, the important observation is the recent Higher low (HL) point prior to the breakout.
Silver now targets the $27.70 level in any continued price move.
In the coming week $26.00 could provide the support level, with $24.60 as key support should a price retracement occur.
Indicator: Relative Strength
Relative Strength has turned higher over the 50 level, operating in line with the underlying advancing price movement. A good signal for further improvement in price momentum would be a continued move above the 50 level.
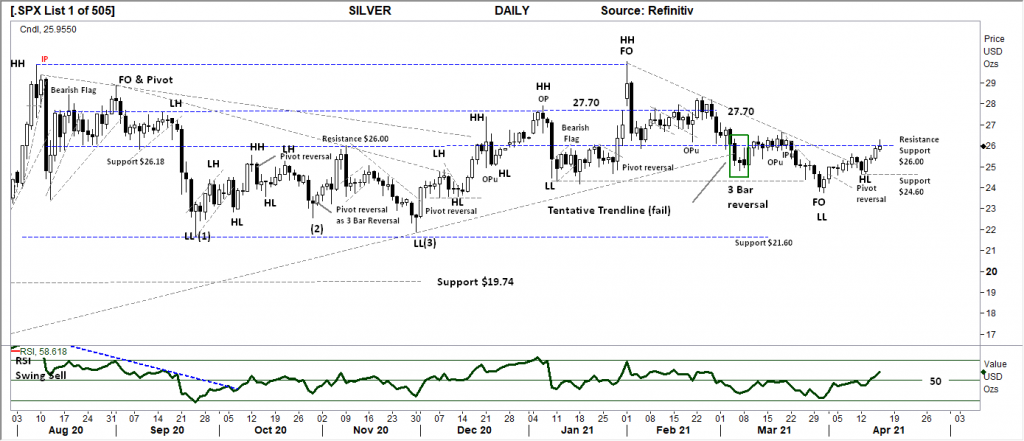
Comments from last week: Last week prices have moved higher over the short down trend line. The key resistance level of $26.00 remains.
Silver remains within the definition of a Primary Down trend. And it should be acknowledged the potential is for further declines.
So what’s changed? the last “FO,LL” point is the third leg down and is a shorter overall range than the previous 2 legs down from February/ March, this has been followed by last week’s short trendline break, this may an early sign of changing momentum.
COPPER DAILY
Price structure: Inventories under pressure.
Copper has set a Pennant breakout bar noted as an impulsive move as the range exceed the previous 5 weeks.
This is a very good setup for further gains within the current primary UP trend.
Of concern is the Relative strength indicator not setting a new high. (see note)
Indicator: Relative Strength
Relative Strength has moved just above the 70 level.
An early BEARISH divergence signal has continued to develop. Further confirmation will shown as a move below the “70” level and below the internal low set during February. The highlighted level in red.
It should be remembered the RSI can track above the 50 -70 level for many weeks at a time and currently remains a signal of very strong price momentum.
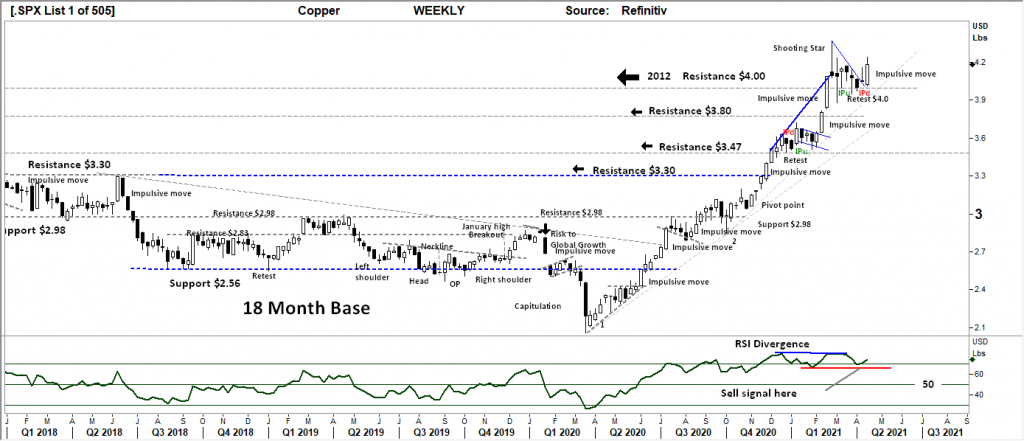
Comments from last week: The continuing consolidation above the $4.00 level remains a strong sign of trader support at this level.
Last week bar showing a higher shadow indicates buyers willing to take the price higher, but with no conviction as sellers lowered the price for the week.
The current “pennant” remains a continuation pattern for higher prices.
The underlying fundamentals for remain extremely bullish for the coming 12 months with the potential for supply shortages.
AUSTRALIAN VOLATILITY INDEX:
Current volatility reading remains positive for further gains within the Australian equities sector.
Traders should be aware of the old adage that low volatility leads to high volatility and visa versa as we are currently seeing after many years of elevated readings.
The XVI is the difference of 1-month forward pricing of ETO Options against current month.
As markets anticipate events, the forward priced option volatility changes, hence as forward price changes, this “skew” in pricing is measured in this XVI.
The XVI value works as an inverse observation to the underlying market.
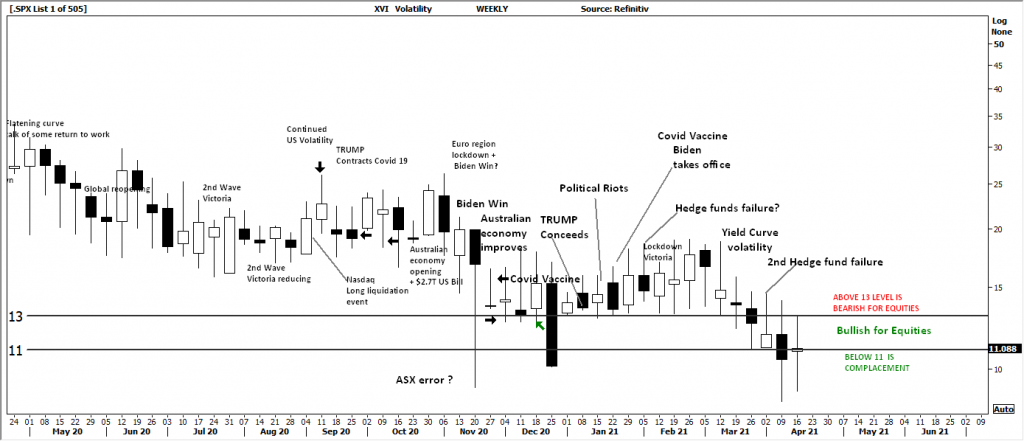
Comments from last week: Forward price volatility has remained low last week, this is a good signal for further gains in the Equities market as the cost of “insurance” via PUT Options has declined. A continuing close below the “13” level would be ideal for the bullish view to remain in place.
USD DOLLAR INDEX
Price structure:
The recent observations of price action indicated a Bullish flag building; however the continuing price grind lower is now testing the 91.66 level. This is not a bullish signal as a breakdown below this level would set a bearish signal for further declines.
This current decline remains supportive of the commodities complex, and traders should see continuing gains in metals.
Indicator: Relative Strength
While the RSI has made a sharp recovery above the 50 level and moved over the 70 level only to decline below the 50 level again, a more significant loss of momentum is currently unfolding.
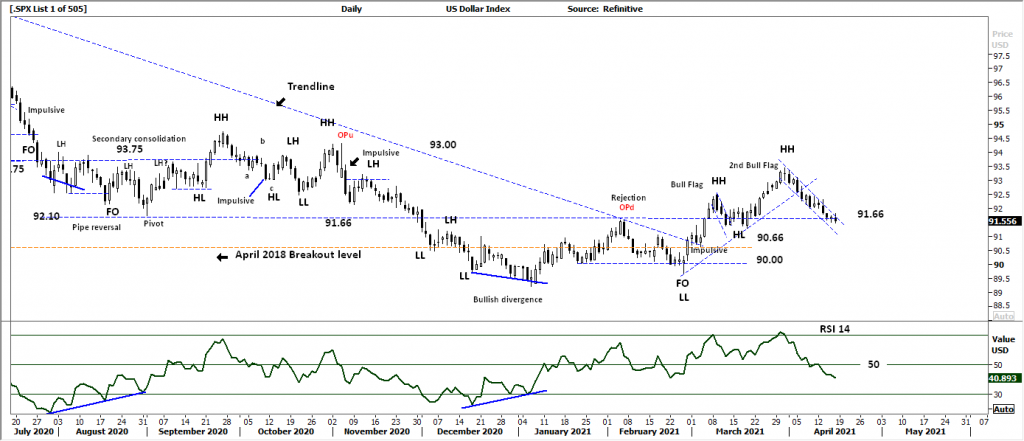
Comments from last week: The 2nd Bullish flag continues to develop, this is not a good signal to remain bullish on price as this current “grind” lower could simply fail to breakout higher. The 91.66 level remains the target for further price weakness within this PRIMARY UP TREND.
WTI CRUDE OIL
Price structure: This commodity is news driven by supply -demand.
A new tentative trendline is now in place as last week’s bar has set a new bullish pivot point following the Bullish flag formation.
The closing price above the key $61.80 level is important and can be viewed as an early move towards the $66.00 resistance level with $75.20 remaining the upside target.
WTI remains in a Primary UP trend.
Indicator: Relative Strength
RSI turning higher over the 50 level and has now moved below the 70 level, momentum remains positive until a move below the key 50 level.
The indicator is turning higher in line with current price consolidation closing towards the high of the week.
As the indicator moved over 70 and has now dipped below 70, this should also be monitored for a potential bearish divergence signal in the coming weeks.
Comments from Last week The “tentative” trendline for last week has broken as WTI develops a Bullish flag continuation pattern.
The primary trend remains UP for Oil, but it should be noted the current price structure is sitting with in the large consolidation zone set back in 2018 and 2019.
$75 .20 remains the upside target of WTI in the coming weeks.


 Access +10,000 financial
instruments
Access +10,000 financial
instruments