
EUR/USD:
Monthly timeframe:
(Technical change on this timeframe is often limited though serves as guidance to potential longer-term moves)
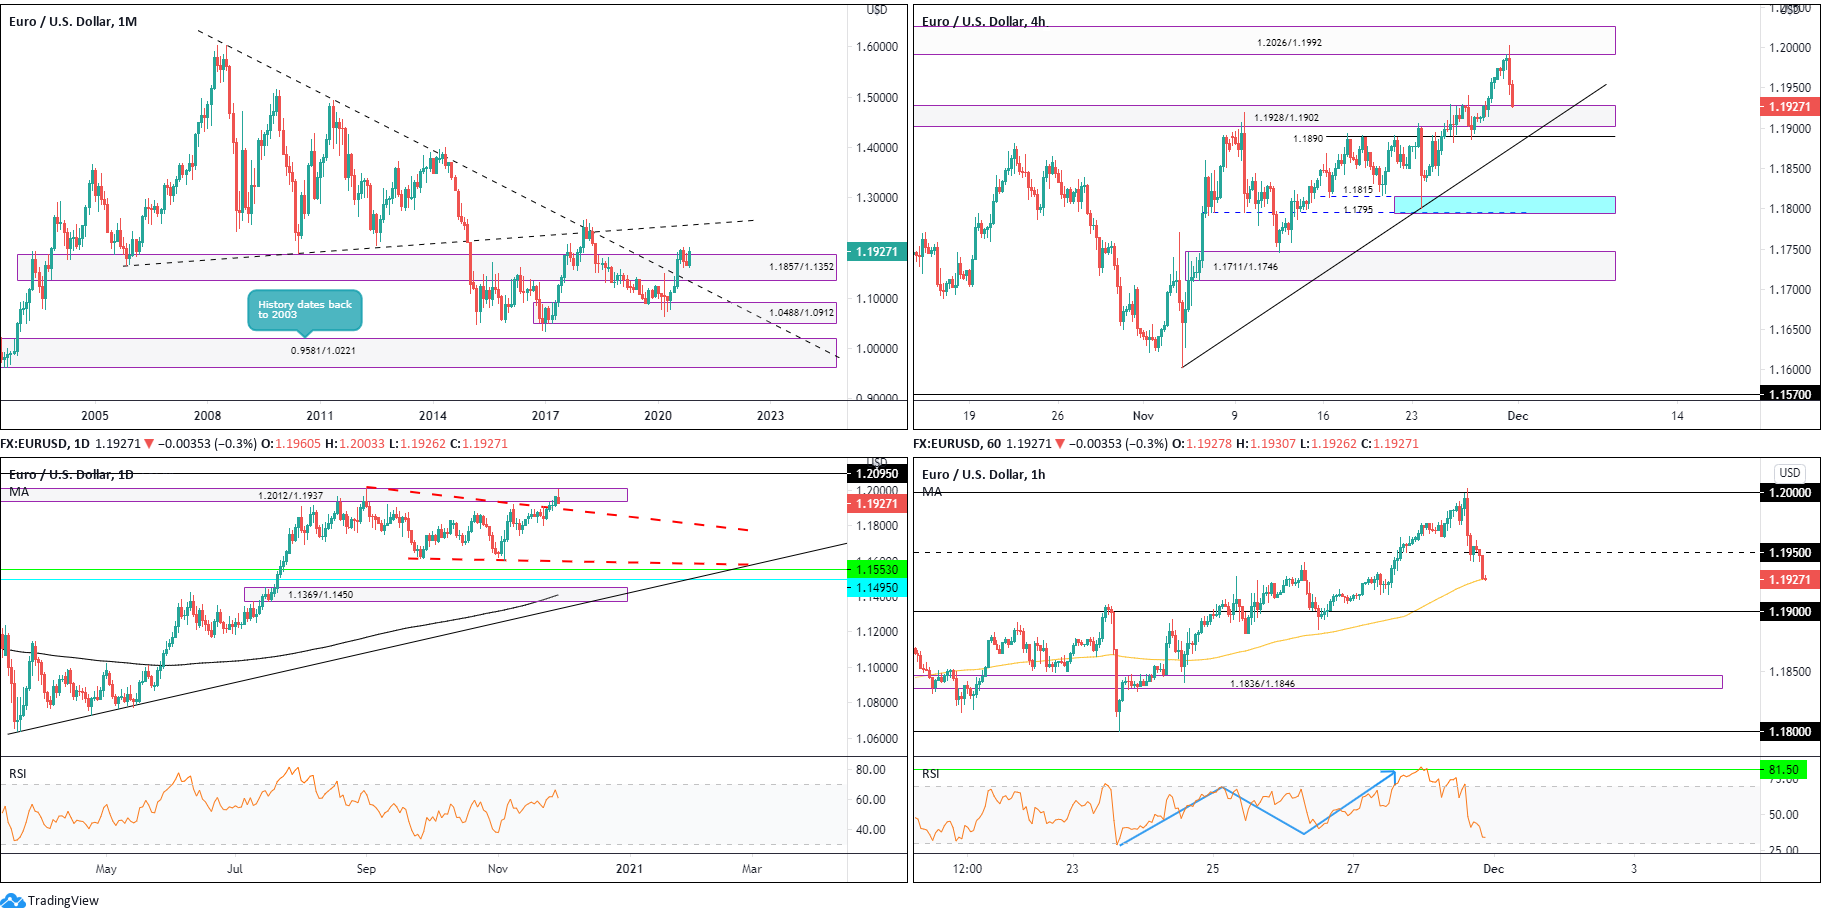
Following the break of long-term trendline resistance (1.6038) in July, and subsequent break of supply from 1.1857/1.1352 in August, buyers made an entrance in November, up by 2.5 percent.
Though this argues additional upside may be on the horizon, with ascending resistance (prior support – 1.1641) perhaps targeted, a dip to retest the recently penetrated trendline resistance (support) is also still on the table.
The primary downtrend (since July 2008) remains intact until 1.4940 is engulfed (May 2 high [2011]).
Daily timeframe:
Partly modified from previous analysis –
After squeezing through the upper perimeter of an early descending wedge pattern (correction) between 1.2011 and 1.1612 (some may interpret this arrangement as a descending triangle pattern), sellers stepped forward from within supply at 1.2012/1.1937 Monday (active since May 2018).
EUR/USD trading northbound since early 2020, together with monthly price showing promise to the upside, signals buyers still have the upper hand. Therefore, could a retest of the descending wedge pattern be enough to tempt continuation buying?
RSI fans will note the value remains comfortably above 50.00, and on track to cross paths with overbought space.
H4 timeframe:
The clearance of 1.1928/1.1902 threw light on supply at 1.2026/1.1992, an area fastened to the top edge of daily supply at 1.2012/1.1937. As you can see, 1.2026/1.1992 received sellers Monday and, in the space of two heavy-handed bearish candles, called price action back to the 1.1928/1.1902 area, which could introduce a bullish scene.
The consumption of bids around 1.1928/1.1902, however, shines light on familiar support at 1.1890, a hurdle uniting with trendline support (1.1602).
H1 timeframe:
With the DXY, or US dollar index, retrieving earlier losses off year-to-date lows, this sparked a EUR/USD corrective slide from the widely watched 1.20 level on Monday (housed inside H4 supply at 1.2026/1.1992). Traders will also note the RSI faded overbought resistance at 81.50 by way of an ABCD pattern.
Bearish flow recently toppled 1.1950 support and crossed paths with the 100-period simple moving average at 1.1927. Through the 100-period simple moving average leans towards a test of the 1.19 level (arranged just beneath H4 demand at 1.1928/1.1902).
Observed levels:
Partly modified from previous analysis –
The monthly chart shows scope to climb, following the breach of supply at 1.1857/1.1352. This also communicates a bullish position behind the daily descending wedge breach last week. Daily supply at 1.2012/1.1937, therefore, is potentially in a vulnerable setting.
1.19 may serve as a magnet to price on the H1 and draw things below the 100-period simple moving average. As such, H4 support at 1.1890, as well as H4 trendline support and the 1.19 level, may be an area buyers watch today.
AUD/USD:
Monthly timeframe:
(Technical change on this timeframe is often limited though serves as guidance to potential longer-term moves)
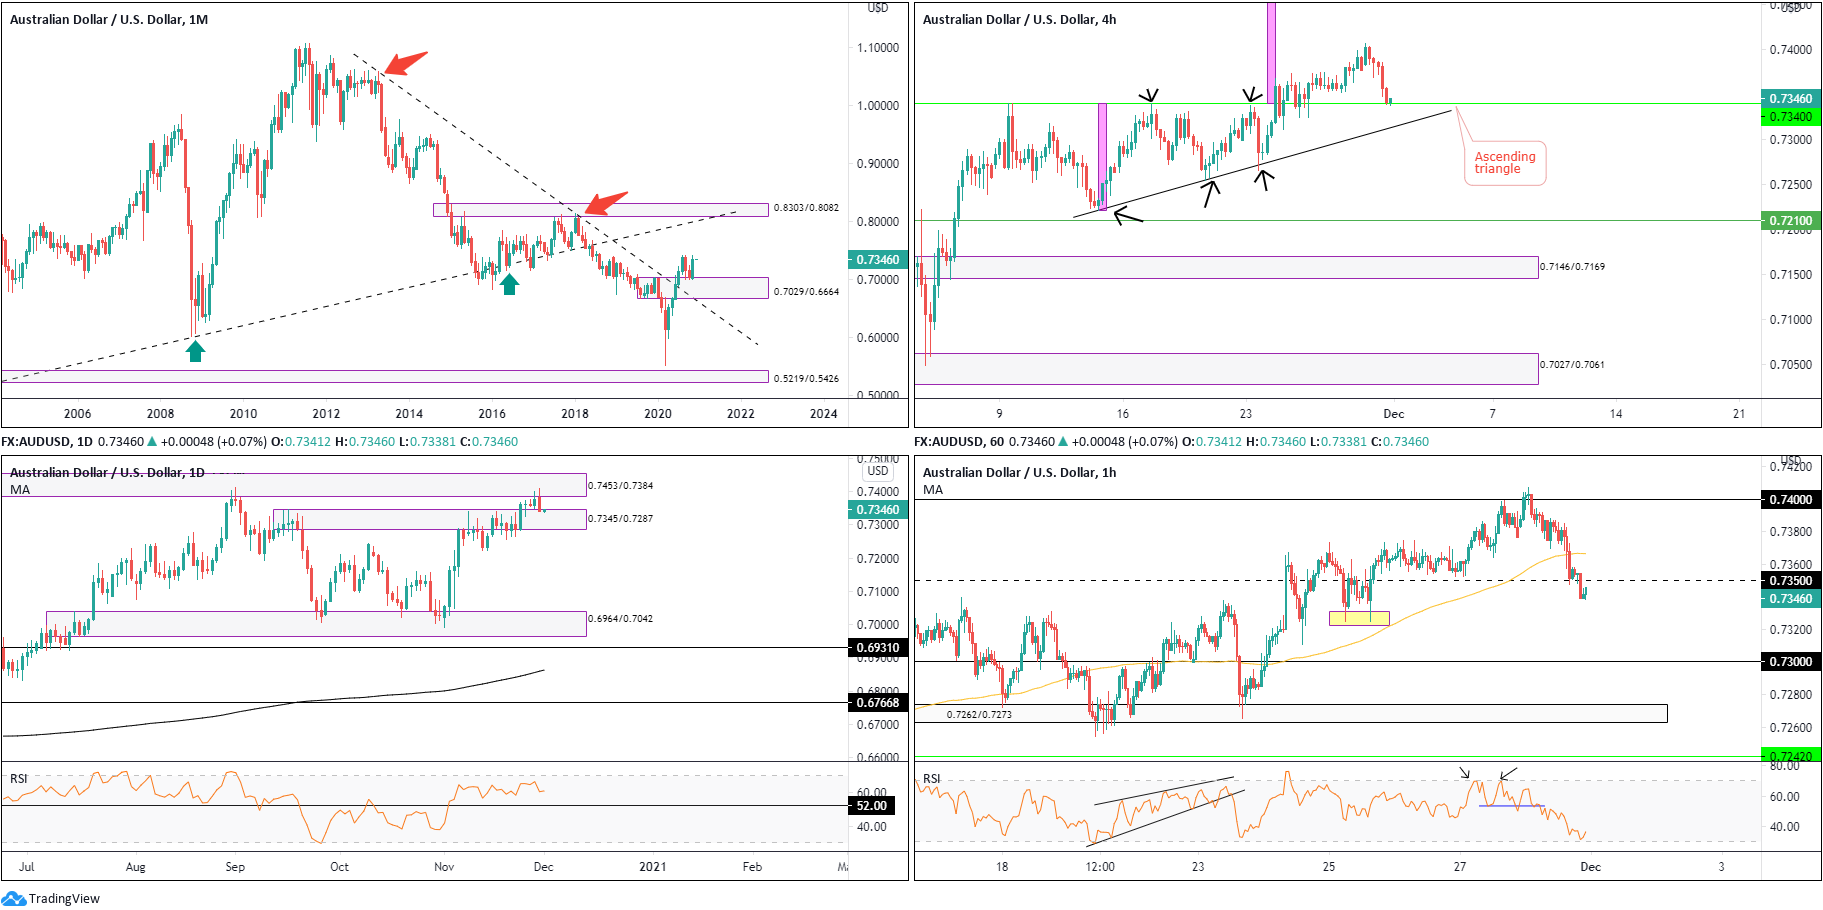
Following a mild correction that addressed the upper border of demand at 0.7029/0.6664 (prior supply), buyers have so far responded well. Up by 4.5 percent in November, buyers appear to be free to explore as far north as 0.8303/0.8082 in the coming months, a supply zone aligning closely with trendline resistance (prior support – 0.4776).
In terms of trend, the primary downtrend (since mid-2011) remains south until breaking 0.8135 (January high [2018]).
Daily timeframe:
Partly modified from previous analysis –
Supply at 0.7345/0.7287, an area that’s remained in the frame since November 9, resigned last week, with the second half of the week greeting nearby supply at 0.7453/0.7384, extended from August 2018.
The trend on this timeframe has remained to the upside since March 2020, in spite of the lengthy correction since September. Therefore, Monday’s selling out of 0.7453/0.7384 (by way of a bearish engulfing candle) may be short-lived.
The RSI indicator continues to consolidate beneath overbought space, following the removal of 52.00 resistance at the beginning of November.
H4 timeframe:
Last week had H4 take over the upper boundary of an ascending triangle, made up between resistance at 0.7340 and trendline support from 0.7221.
Monday’s retracement, as you can see, has carried price action back to retest 0.7340, gifting traders a chance to potentially buy this market. Those initially long the 0.7340 breakout have likely tied up stops beneath the pattern’s associated trendline support (0.7221)
Buying off 0.7340 throws light on yesterday’s peaks at 0.7407 and the September peak at 0.7413.
H1 timeframe:
Following the formation of an RSI double-top pattern off overbought levels, intraday price activity submerged the 100-period simple moving average and eventually dethroned 0.7350 support. This leaves sellers with double-bottom support around 0.7325 (yellow) to contend with and the 0.73 level.
RSI traders may also acknowledge that the value is seen moderately rotating higher ahead of oversold terrain.
Observed levels:
Monthly price flexing its financial muscle off demand at 0.7029/0.6664, along with daily price trending higher, places a question mark on yesterday’s daily bearish outside day reversal.
Daily demand at 0.7345/0.7287, along with H4 ascending triangle support at 0.7340 and the monthly chart’s position, could spark a H1 attempt to reclaim 0.7350 to the upside to attract additional bullish flow.
USD/JPY:
Monthly timeframe:
(Technical change on this timeframe is often limited though serves as guidance to potential longer-term moves)
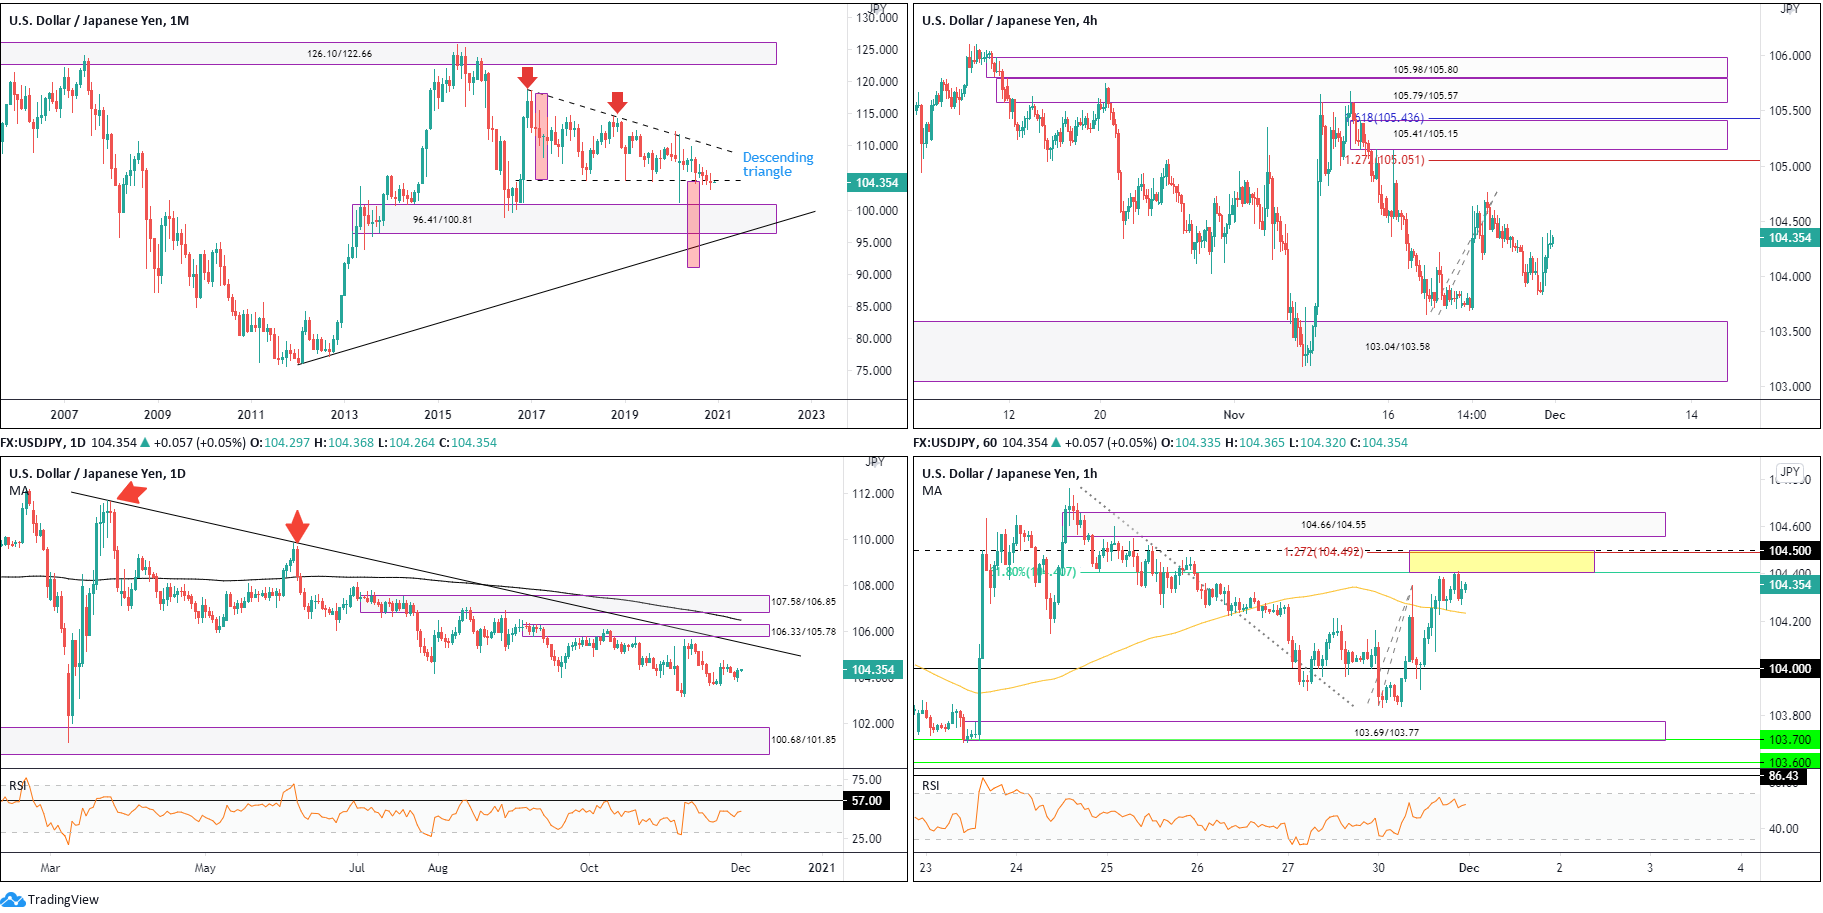
Since kicking off 2017, USD/JPY has been carving out a descending triangle pattern between 118.66/104.62.
November, as you can see, worked with the lower edge of the aforesaid pattern and finished the month down by 0.3 percent – a third successive monthly loss.
104.62 ceding ground shines light on demand from 96.41/100.81, followed by trendline support (76.15) and the descending triangle’s take-profit level at 91.04 (red).
Daily timeframe:
Partly modified from previous analysis –
Aside from Monday developing a bullish engulfing candle that snapped a two-day losing streak, technical levels remain unchanged.
Supply from 106.33/105.78 and trendline resistance (111.68) are prominent areas north of price
Light falls on demand at 100.68/101.85 (fixed to the upper base of monthly demand and drawn from September 2016) if sellers make a push.
RSI enthusiasts will note the unit has remained under 57.00 resistance since July.
H4 timeframe:
Areas of consideration on the H4 chart are demand from 103.04/103.58, extended from March 2020. Additionally, traders are likely watching 104.76 highs (November 24) and supply at 105.41/105.15, closely fitted with 127.2% and 161.8% Fib projection levels at 105.05 and 105.43, respectively.
H1 timeframe:
Feeding off the bearish rotation from the 100-period simple moving average, H1 established a dragonfly doji candlestick pattern off the 104 handle and rallied into US trading. Taking out the SMA, traders were greeted with a 61.8% Fib level at 104.40, joined closely (yellow) by a 127.2% Fib projection level at 104.49 and the 105.50 resistance.
104.66/104.55 supply is next in line if buyers maintain a bullish course today.
Traders may also note the RSI indicator surfing just beneath overbought levels, recently prompting mild bearish divergence.
Observed levels:
Monthly price appears to be on the verge of breaching descending triangle support at 104.62, emphasising a weak market. Though this is somewhat offset by Monday’s bullish engulfing candle formed on the daily timeframe.
In addition to the monthly chart’s position, H4 is dealing with some relatively formidable resistance right now between 104.50/104.40 and supply from 104.66/104.55.
GBP/USD:
Monthly timeframe:
(Technical change on this timeframe is often limited though serves as guidance to potential longer-term moves)
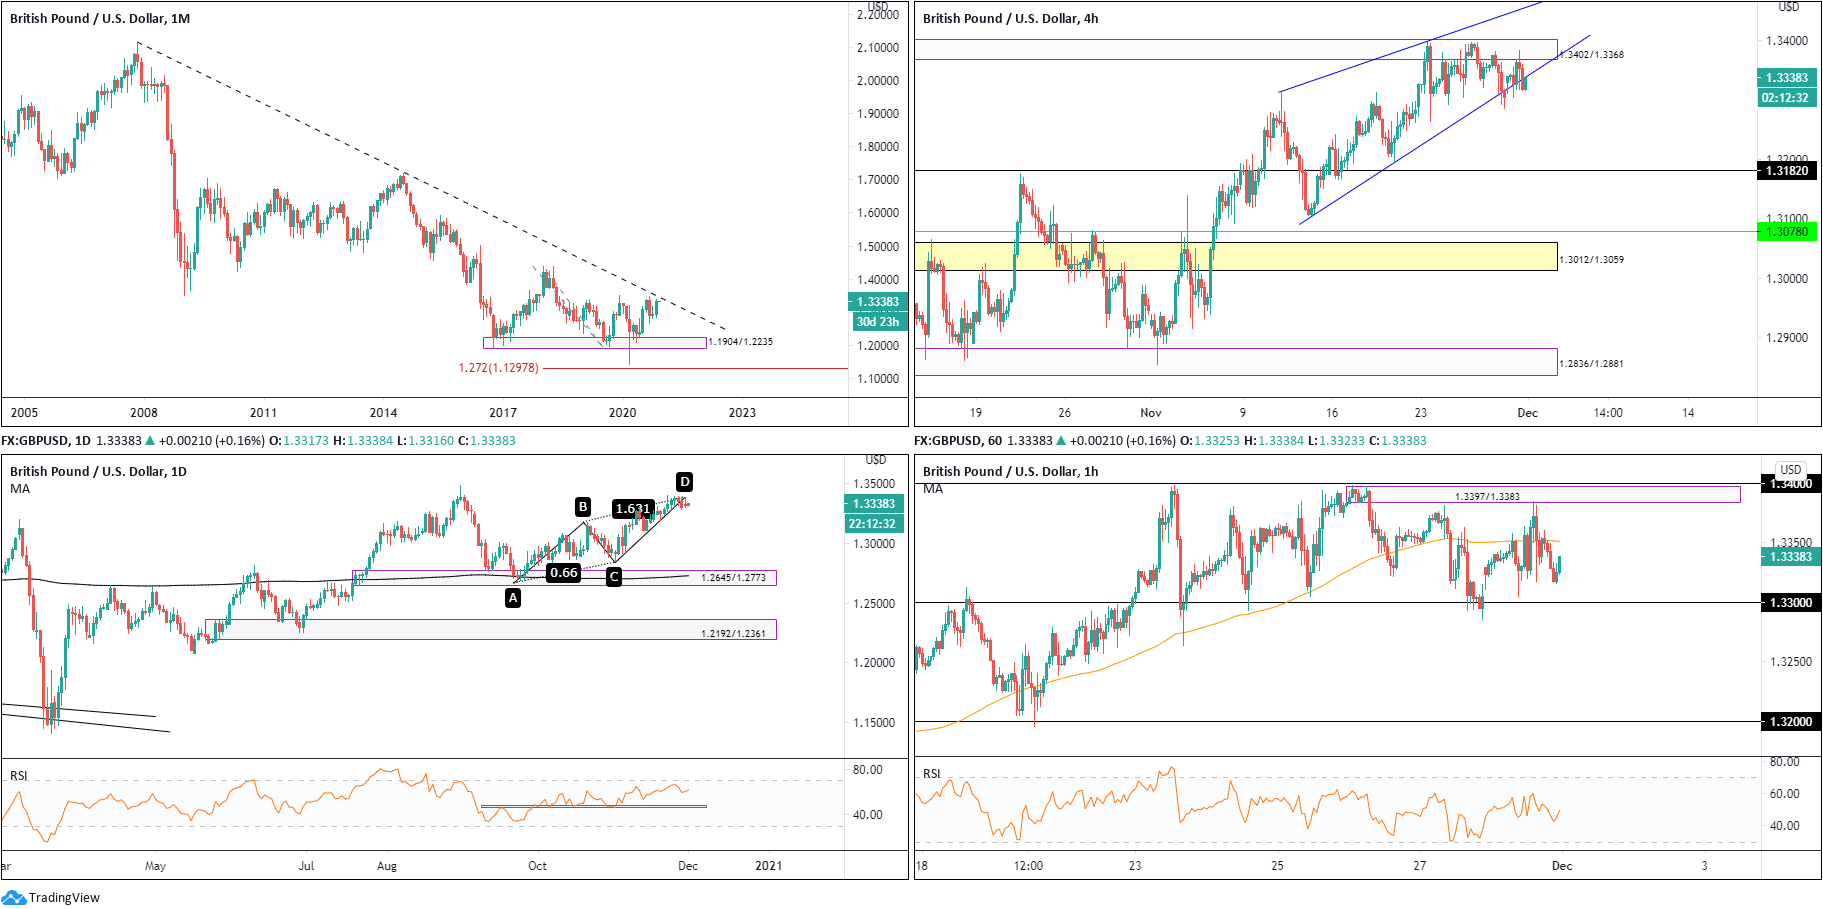
November traded higher by 2.9 percent and seated trendline resistance (2.1161) in the line of fire on the monthly chart.
In terms of trend, the primary trend has faced lower since early 2008, unbroken (as of current price) until 1.4376 gives way – April high 2018.
Daily timeframe:
Brought forward from previous analysis –
Since crossing paths with demand at 1.2645/1.2773 and the 200-day simple moving average in late September, GBP/USD has displayed a gradual interest to the upside and generated an AB=CD pullback concluding at 1.3392. The pattern also forms just ahead of the 1.3483 September peak, which if a break comes to pass will confirm the current uptrend on this timeframe (since early 2020).
RSI followers will also see the line has produced a series of higher highs and lows since late September, on course to welcome overbought conditions.
H4 timeframe:
Brought forward from previous analysis –
Supply at 1.3402/1.3368 moved into position in recent trading, with price now threatening to topple the lower side of an ascending wedge between 1.3105/1.3313. Fracturing its lower edge brings light to 1.3182 support.
H1 timeframe:
Supply at 1.3397/1.3383 (located just beneath 1.34 resistance) made a show heading into US trading on Monday, forcing H1 flow beneath the 100-period simple moving average to within close range of the 1.33 level.
Beneath 1.33, the lack of obvious support suggests 1.32 could make an entrance.
Observed levels:
Daily price greeting AB=CD resistance at 1.3392 is interesting. This may be sufficient to guide H4 beneath ascending wedge support (1.3105) and target 1.3182 support.
1.33 support on the H1, therefore, appears vulnerable. Not only are daily and H4 sellers possibly changing gear, room for sellers to stretch their legs south of 1.33 is possibly there to 1.32.
DISCLAIMER:
The information contained in this material is intended for general advice only. It does not take into account your investment objectives, financial situation or particular needs. FP Markets has made every effort to ensure the accuracy of the information as at the date of publication. FP Markets does not give any warranty or representation as to the material. Examples included in this material are for illustrative purposes only. To the extent permitted by law, FP Markets and its employees shall not be liable for any loss or damage arising in any way (including by way of negligence) from or in connection with any information provided in or omitted from this material. Features of the FP Markets products including applicable fees and charges are outlined in the Product Disclosure Statements available from FP Markets website, www.fpmarkets.com and should be considered before deciding to deal in those products. Derivatives can be risky; losses can exceed your initial payment. FP Markets recommends that you seek independent advice. First Prudential Markets Pty Ltd trading as FP Markets ABN 16 112 600 281, Australian Financial Services License Number 286354.


 Access +10,000 financial
instruments
Access +10,000 financial
instruments