
Charts: Trading View
(Italics: previous analysis due to limited price change)
EUR/USD:
Weekly timeframe:
Since mid-November, buyers and sellers have been squaring off around support at $1.1237-1.1281—made up of a 61.8% Fibonacci retracement at $1.1281 and a 1.618% Fibonacci projection from $1.1237.
‘Harmonic’ traders will acknowledge $1.1237 represents what’s known as an ‘alternate’ AB=CD formation.
Any upside derived from current support will likely be capped by resistance at $1.1473-1.1583; navigating lower, on the other hand, throws light on Quasimodo support as far south as $1.0778.
Interestingly, the pair took out 2nd November low (2020) at $1.1603 in late September. This suggests the beginnings of a primary downtrend on the weekly timeframe, reinforced by the monthly timeframe trending lower since mid-2008.
Daily timeframe:
Quasimodo support drawn from mid-June at $1.1213 (positioned beneath the weekly timeframe’s Fibonacci structure) made an entrance on 24th November and remains committed for the time being.
Continued interest to the upside points to a run back to trendline resistance, extended from the high $1.2254. Establishing a decisive close beneath $1.1213, however, exposes support on the daily timeframe at $1.0991 (not visible on the screen).
Regarding the relative strength index (RSI), the value recently recovered from oversold territory and is now on the doorstep of the 50.00 centreline. Crossing above here helps validate bullish interest: average gains exceeding average losses.
H4 timeframe:
Resistance at $1.1379 calls for attention on the H4 scale, a level accompanied by a 38.2% Fibonacci retracement at 1.1380 and a 100% Fibonacci projection from $1.1383.
Support at $1.1235 also deserves notice. Withstanding two downside attempts, the level also brings a 78.6% Fibonacci retracement to the table at $1.1230.
H1 timeframe:
Mid-way through yesterday’s London morning session, short-term action ventured north of $1.13 and likely tripped a large pool of buy-stops from traders attempting to fade the psychological level. The breach will have also drawn interest from breakout buyers.
Missing prime resistance by a whisker at $1.1339-1.1328, price shifted back under $1.13 to a decision point from $1.1262-1.1274. This caused what’s known as a ‘bull trap’ above $1.13.
$1.1262-1.1274 experienced a modest breach on Monday, indicating weakness from the zone. Downstream, another decision point falls in at $1.1230-1.1244, though also recently faced a minor breach and consequently unlocks the technical door to as far south as $1.12 (not visible on the screen).
Out of the relative strength index (RSI), the value crossed under the 50.00 centreline, movement implying a downside vibe: average losses exceeding average gains.
Observed Technical Levels:
Short term, the H1 timeframe’s decision point at $1.1262-1.1274 is hanging by a thread, according to chart studies. Ultimately, pulling south of here opens a possible break of $1.1230-1.1244 (also echoing a fragile tone on the H1 [see above]) to $1.12. However, technicians will note H4 support from $1.1235 aligns with $1.1230-1.1244, therefore an attempt to hold here is not out of the question.
With the above, nevertheless, a bearish scenario below $1.1262 to $1.1240ish is immediately clear.

AUD/USD:
Weekly timeframe:
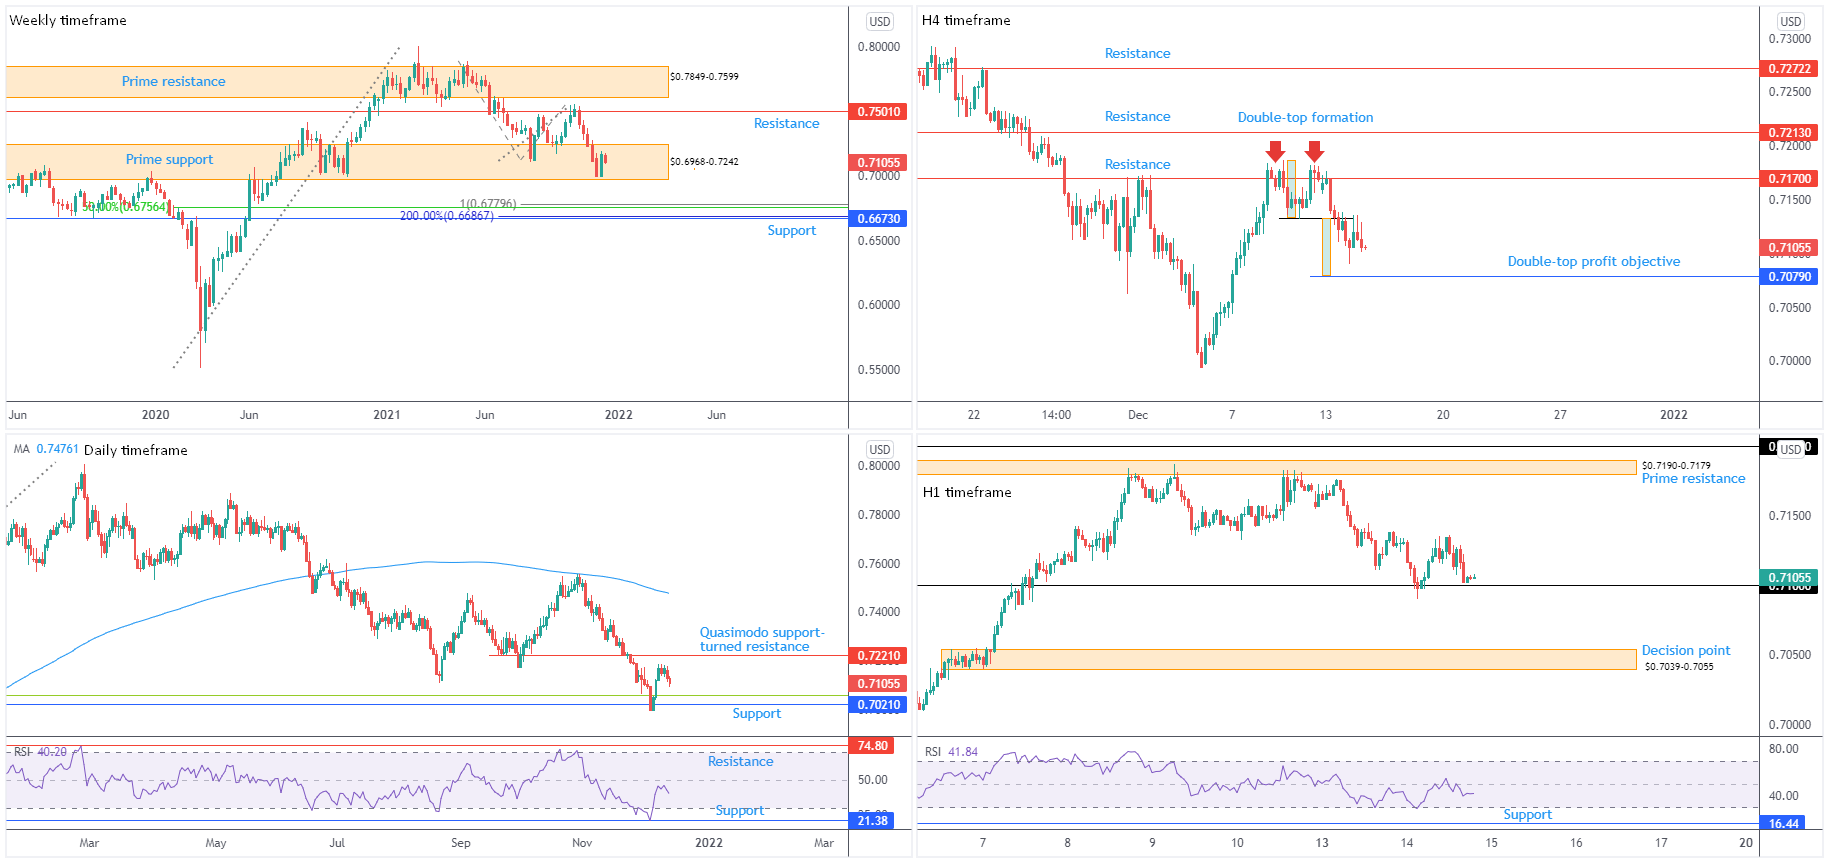
Bulls embraced an offensive phase last week from deep within prime support at $0.6968-0.7242. Not only did the move snap a five-week losing streak, it emphasised interest remains within the support and could see action take aim at resistance from $0.7501.
Manoeuvring beneath $0.6968-0.7242, nevertheless, reveals support at $0.6673 and a gathering of Fibonacci ratios between $0.6687 and $0.6780. Included within this area is a 100% Fibonacci projection: an AB=CD bullish formation.
Trend on the weekly timeframe has been higher since pandemic lows of $0.5506 (March 2020); however, the monthly timeframe has been entrenched within a large-scale downtrend since mid-2011.
Daily timeframe:
Support at $0.7021 put in an appearance early last week, bolstered by a 38.2% Fibonacci retracement at $0.7057 (green). Despite effort to maintain a bullish setting, the currency pair is turning lower a few pips south of Quasimodo support-turned resistance at $0.7221.
The trend on the daily timeframe has maintained a downside trajectory since late February. Momentum studies also show the relative strength index (RSI) defending space under the 50.00 centreline, which demonstrates lacklustre upside momentum on this timeframe.
H4 timeframe:
Shaking hands with resistance at $0.7170 has, as you can see, permitted a double-top pattern from 0.7183ish. Price recently breaching the formation’s neckline at $0.7132 signals short-term downside towards the pattern’s profit objective at $0.7079.
North of $0.7170, another layer of resistance resides at $0.7213.
The formation of the double-top pattern is aligned with daily and monthly timeframe trend direction.
H1 timeframe:
Evident from the H1 timeframe, technical eyes will note the unit is touching gloves with area around the $0.71 figure after failing to find reception above $0.7131.
North of price, prime resistance is drawn from $0.7190-0.7179, a level sheltered just south of $0.72. The $0.7039-0.7055 decision point is seen beneath $0.71 should buyers fail to defend the psychological base.
The picture from the relative strength index (RSI) shows the value rejected the lower side of the 50.00 centreline, emphasising resistance and negative momentum.
Observed Technical Levels:
The H4 timeframe’s double-top pattern has clearly interested short-term sellers, signalling movement in the direction of the double-top formation’s profit objective at $0.7079. This might eventually pull H1 through $0.71 and unlock chart space to the H1 decision point at $0.7039-0.7055, set just beneath the H4 pattern’s take-profit area.
USD/JPY:
Weekly timeframe:
Since the beginning of October, the USD/JPY crossed swords with resistance from ¥114.38 and put in a 4-year pinnacle at ¥115.52.
Above current resistance is a 1.272% Fibonacci projection from ¥116.09, while directly below has support in view at ¥112.16.
In terms of trend, the unit has been advancing since the beginning of this year.
Daily timeframe:
Supply-turned demand at ¥112.66-112.07 welcomed buyers in recent candles. Despite holding the area, follow-through buying has been subdued of late. The ¥111.18-111.79 decision point is seen below should price dip. Pushing for higher levels, nonetheless, may take the unit beyond 24th November high at ¥115.52 to as far north as Quasimodo resistance from ¥116.33.
RSI (relative strength index) analysis reveals clear support between 40.00 and 50.00 (amid prolonged uptrends, indicator support often forms around the 50.00 area and operates as a ‘temporary’ oversold base). As you can see, the value has been testing the area since late November.
H4 timeframe:
As can be seen from the H4 scale, candle action has been caught within a week-long (narrow) range between ¥113.33 and the lower side of a decision point at ¥114.23-113.66. Above the decision point are two neighbouring resistances at ¥114.76 and ¥114.46.
Lower on the curve, support is calling at ¥112.73.
H1 timeframe:
In similar fashion to the H4 scale, a consolidation is in the process of forming between ¥113.31 and ¥113.77, with price now on the doorstep of range resistance. Outside of the aforesaid range are ¥113 and ¥114, serving as possible support and resistances.
The relative strength index (RSI) shows the indicator’s value bounced from the 50.00 centreline in the form of support, stressing a possible test of overbought (70.00).
Observed Technical Levels:
A lack of selling interest around the lower side of the H4 decision point at ¥114.23-113.66, and H1 price edging closer to range resistance at ¥113.77, movement to ¥114 could be in the offing north of the ¥113.77. This is bolstered by room to move higher on both the weekly and daily timeframes.

GBP/USD:
Weekly timeframe:
Supply-turned demand at $1.3629-1.3456 recently surrendered position.
Couple this with price closing under a double-top pattern’s ($1.4241) neckline at $1.3669 in August, and the monthly timeframe trading lower since late December 2007, the weekly chart reflects a bearish technical outlook. The double-top pattern’s profit objective—measured by taking the distance between the highest peak to the neckline and extending this value lower from the breakout point—delivers a downside target around $1.3093.
Daily timeframe:
Quasimodo support at $1.3119 is firmly in the headlights on this timeframe.
Resistance remains at $1.3602, plotted nearby trendline resistance, taken from the high $1.4250—both forming clear upside objectives should buyers regain consciousness.
Longer-term sentiment has remained biased to the downside since June. This has caused the relative strength index (RSI) to form indicator resistance between 60.00 and 50.00 (common in downtrends). Note, however, the indicator recently rebounded from oversold space.
H4 timeframe:
Trendline resistance, extended from the high $1.3815, was taken out in recent candles with price coming within striking distance of retesting the latter as support. The break of trendline resistance, as underlined in previous writing, shines light on a possible run back to resistance at $1.3353.
H1 timeframe:
$1.32, as you can see, served the market well as support in early trading on Tuesday, aided by a 78.6% Fibonacci retracement at $1.3195, a 1.272% Fibonacci projection from $1.3199 and a channel support, taken from the low $1.3160.
Despite US trading hours weighing on upside, channel resistance, drawn from the high $1.3244, continues to call for attention higher up, followed by $1.33 resistance.
The relative strength index (RSI) has the value testing the mettle of the 50.00 centreline. Should the indicator develop support, moves to overbought could come to fruition.
Observed Technical Levels:
Higher timeframes inform traders that lower prices are perhaps ahead, bound for $1.31ish. With that being the case, $1.32, despite being a level drawing a rebound yesterday and boasting reasonably noteworthy confluence, is unlikely to deliver much support if tested again.
Therefore, a $1.32 breach could have a bearish scene unfold, targeting the $1.31 neighbourhood.

DISCLAIMER:
The information contained in this material is intended for general advice only. It does not take into account your investment objectives, financial situation or particular needs. FP Markets has made every effort to ensure the accuracy of the information as at the date of publication. FP Markets does not give any warranty or representation as to the material. Examples included in this material are for illustrative purposes only. To the extent permitted by law, FP Markets and its employees shall not be liable for any loss or damage arising in any way (including by way of negligence) from or in connection with any information provided in or omitted from this material. Features of the FP Markets products including applicable fees and charges are outlined in the Product Disclosure Statements available from FP Markets website, www.fpmarkets.com and should be considered before deciding to deal in those products. Derivatives can be risky; losses can exceed your initial payment. FP Markets recommends that you seek independent advice. First Prudential Markets Pty Ltd trading as FP Markets ABN 16 112 600 281, Australian Financial Services License Number 286354.


 Access +10,000 financial
instruments
Access +10,000 financial
instruments