
EUR/USD:
Monthly timeframe:
(Technical change on this timeframe is often limited though serves as guidance to potential longer-term moves)
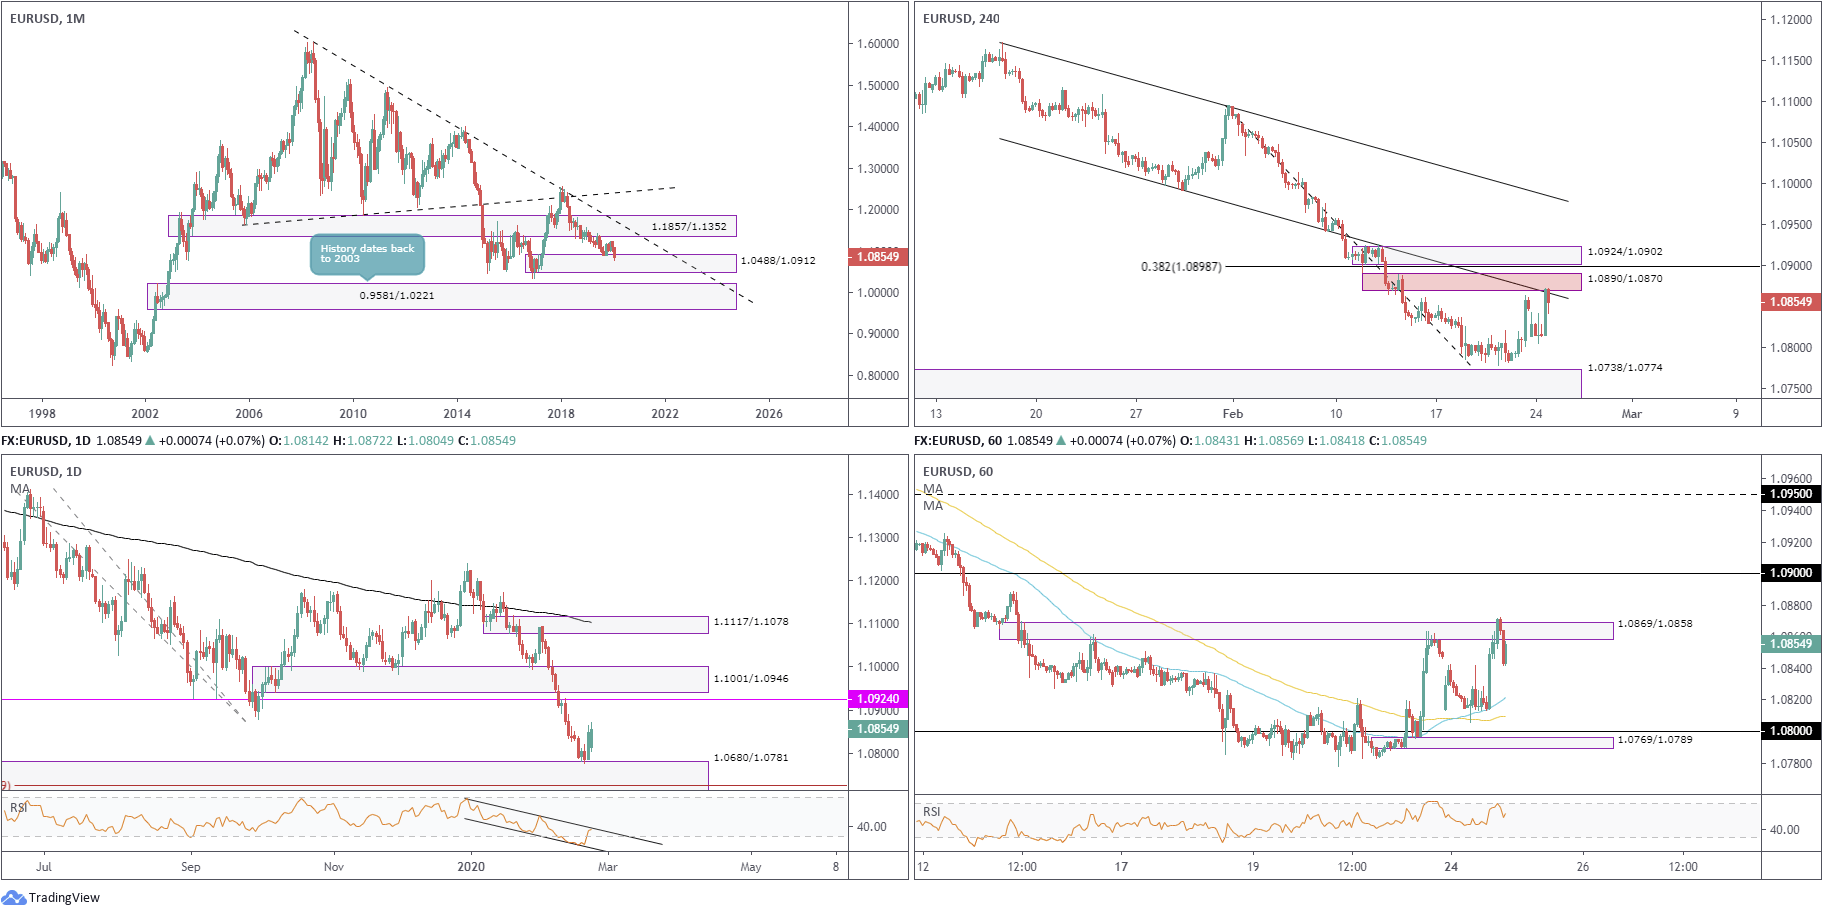
Despite a healthy attempt at recovery from demand at 1.0488/1.0912 in October 2019 – a particularly noteworthy area given the momentum derived from its base – EUR/USD failed to sustain gains and begun tunnelling its way back into the said demand last week.
Although down 2.17% on the month and in-line with the primary downtrend, which has been lower since 2008, we cannot rule out the possibility of fresh upside attempts from current demand.
Additional structure worth noting on the monthly timeframe is demand-turned supply at 1.1857/1.1352, a long-term trendline resistance (1.6038) and a reasonably ‘fresh’ demand area coming in at 0.9581/1.0221. Note this area boasts history dating back as far as 2003.
Daily timeframe:
Partially altered outlook from previous analysis –
Demand at 1.0680/1.0781, an area formed April 2017 which houses a 127.2% Fibonacci ext. point within at 1.0724, elbowed its way into the spotlight late last week and pencilled in a stronger-than-expected recovery to highs of 1.0863. With respect to resistance on this timeframe, 1.0924 offers a possible ceiling, as does the demand-turned supply zone at 1.1001/1.0946.
The RSI indicator recovered from channel support, and is poised to approach channel resistance, with a break likely triggering further buying to overbought waters.
H4 timeframe:
Monday observed EUR/USD journey to an interesting area of supply drawn from 1.0890/1.0870 – this was the decision point to break the lower edge of the larger area of demand at 1.0832/1.0877 mid-February (no longer applied on the chart). Supply at 1.0924/1.0902 lies close by in the event we press higher, bolstered further by a 38.2% Fibonacci retracement at 1.0898. Note also 1.0890/1.0870 also joins closely with channel support-turned resistance (1.0992).
H1 timeframe:
Intraday action for EUR/USD dipped in initial trade, shaped by way of a modest 33-point opening gap that latched on to the 100/50-period SMAs, around the 1.0808 neighbourhood. The pair bounced firmly just ahead of 1.08 in early London hours, though failed to derive much momentum from Germany’s IFO survey that beat consensus in headline and sub-component terms.
The Institute for Economic Research noted: Sentiment among German managers has improved somewhat. The ifo Business Climate Index rose from 96.0 points (Seasonally adjusted) in January to 96.1 points in February. Although companies assessed their current situation as a little worse, they are less pessimistic about the next six months. The German economy seems unaffected by developments surrounding the coronavirus. The survey results and other indicators suggest economic growth in the first quarter will amount to 0.2 percent.
In recent hours, supply at 1.0869/1.0858 was mildly breached, albeit likely enough to trip buy stops and draw 1.09 into focus. A correction to 1.08 could be on the cards, driving through sell-stop liquidity beneath yesterday’s low at 1.0805. Interestingly, a small demand lurks a few points below 1.08 at 1.0769/1.0789, which could contain any whipsaw through 1.08.
Direction:
Further upside remains a possibility, thanks to daily demand holding at 1.0680/1.0781, and monthly price continuing to trade around the upper boundary of demand at 1.0488/1.0912. As underlined above, daily resistance at 1.0924, as well as the demand-turned supply zone at 1.1001/1.0946, reside as the next higher-timeframe resistances to be aware of this week.
Shorter-term movement has eyeballs on a move to 1.09, after rupturing H1 supply at 1.0869/1.0858. Despite this, a correction to as far south as 1.08 could occur prior to reaching 1.09. 1.08, therefore, offers a potential support to work with today for possible long opportunities, though a rebound off either the 50 or 100-period SMAs is also not out of the question.
AUD/USD:
Monthly timeframe:
(Technical change on this timeframe is often limited though serves as guidance to potential longer-term moves)
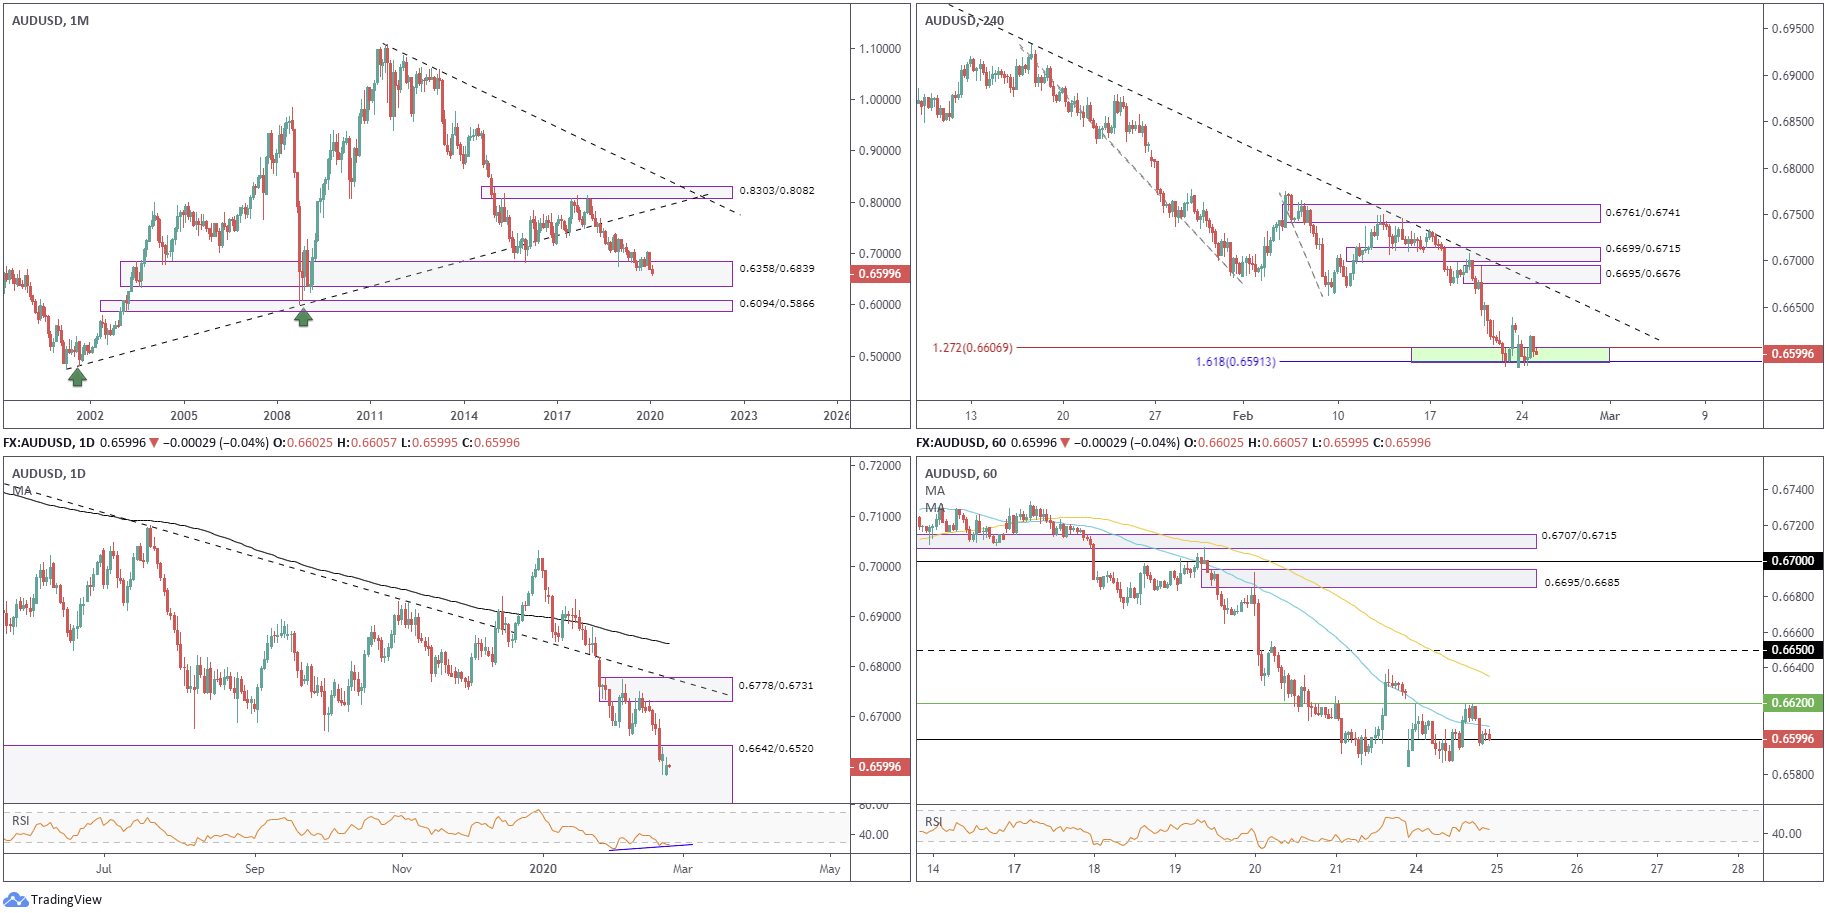
Demand at 0.6358/0.6839 remains in the fight, yet price struggles to chalk up anything meaningful to the upside. An eventual break of the said demand zone has another layer of demand close by at 0.6094/0.5866, while a recovery could lead to trendline support-turned resistance (0.4776) making an appearance, followed by supply at 0.8303/0.8082.
Currently, the pair trades -1.34% on the month.
Daily timeframe:
Partially altered outlook from previous analysis –
Hefty supply-turned demand at 0.6642/0.6520 remains in the fray on the daily timeframe, an area that fills a portion of the current monthly demand highlighted above at 0.6358/0.6839. Note price is also trading off decade lows right now.
Should the candles kick back and advance, the 0.6662 February 7th low may delay a recovery, with moves higher targeting familiar supply coming in at 0.6778/0.6731, which happens to intersect with trendline resistance (0.7393).
The RSI recently re-entered oversold territory, and is on track to chalk up bullish divergence.
H4 timeframe:
Partially altered outlook from previous analysis –
Support, comprised of Fibonacci studies (161.8% Fibonacci ext. point and the 127.2% Fibonacci ext. point – green) between 0.6591/0.6606, appears to be losing grip. The pair slipped in early trade, chalking up an opening gap of more than 40 points. There’s a possibility this triggered sell stops south of 0.6591/0.6606, weakening buyers here.
Limited supply is visible to the left of current price in the event of a move north; the next base falls in around 0.6695/0.6676, coupled with an intersecting trendline resistance (0.7031).
H1 timeframe:
The 0.66 handle appears to be hanging on by a thread at the moment, but withstood a number of downside attempts on Monday. The 50-period SMA is doing a good job at capping upside, with the 100-period SMA seen drifting lower a touch higher. 0.6620 is also proving a troublesome intraday level to overcome.
Direction:
The monthly timeframe continues to challenge demand at 0.6358/0.6839, with daily price also recently getting to know supply-turned demand at 0.6642/0.6520. As of late, there’s been little in terms of an upside attempt from either zone, though we cannot rule out the possibility of fresh upside attempts, despite the primary trend supporting further downside.
The H4 candles exhibit weakness around 0.6591/0.6606, and H1 buyers are struggling to notch up anything of note to the upside off 0.66.
Right now, things are not looking too good for buyers in this market, weighed not only by shorter-term technical structure, but also heightened concerns regarding the coronavirus. Therefore, shorts appear attractive from a fundamental perspective, though this would involve selling into higher-timeframe demand and possible buying off 0.66.
USD/JPY:
Monthly timeframe:
(Technical change on this timeframe is often limited though serves as guidance to potential longer-term moves)
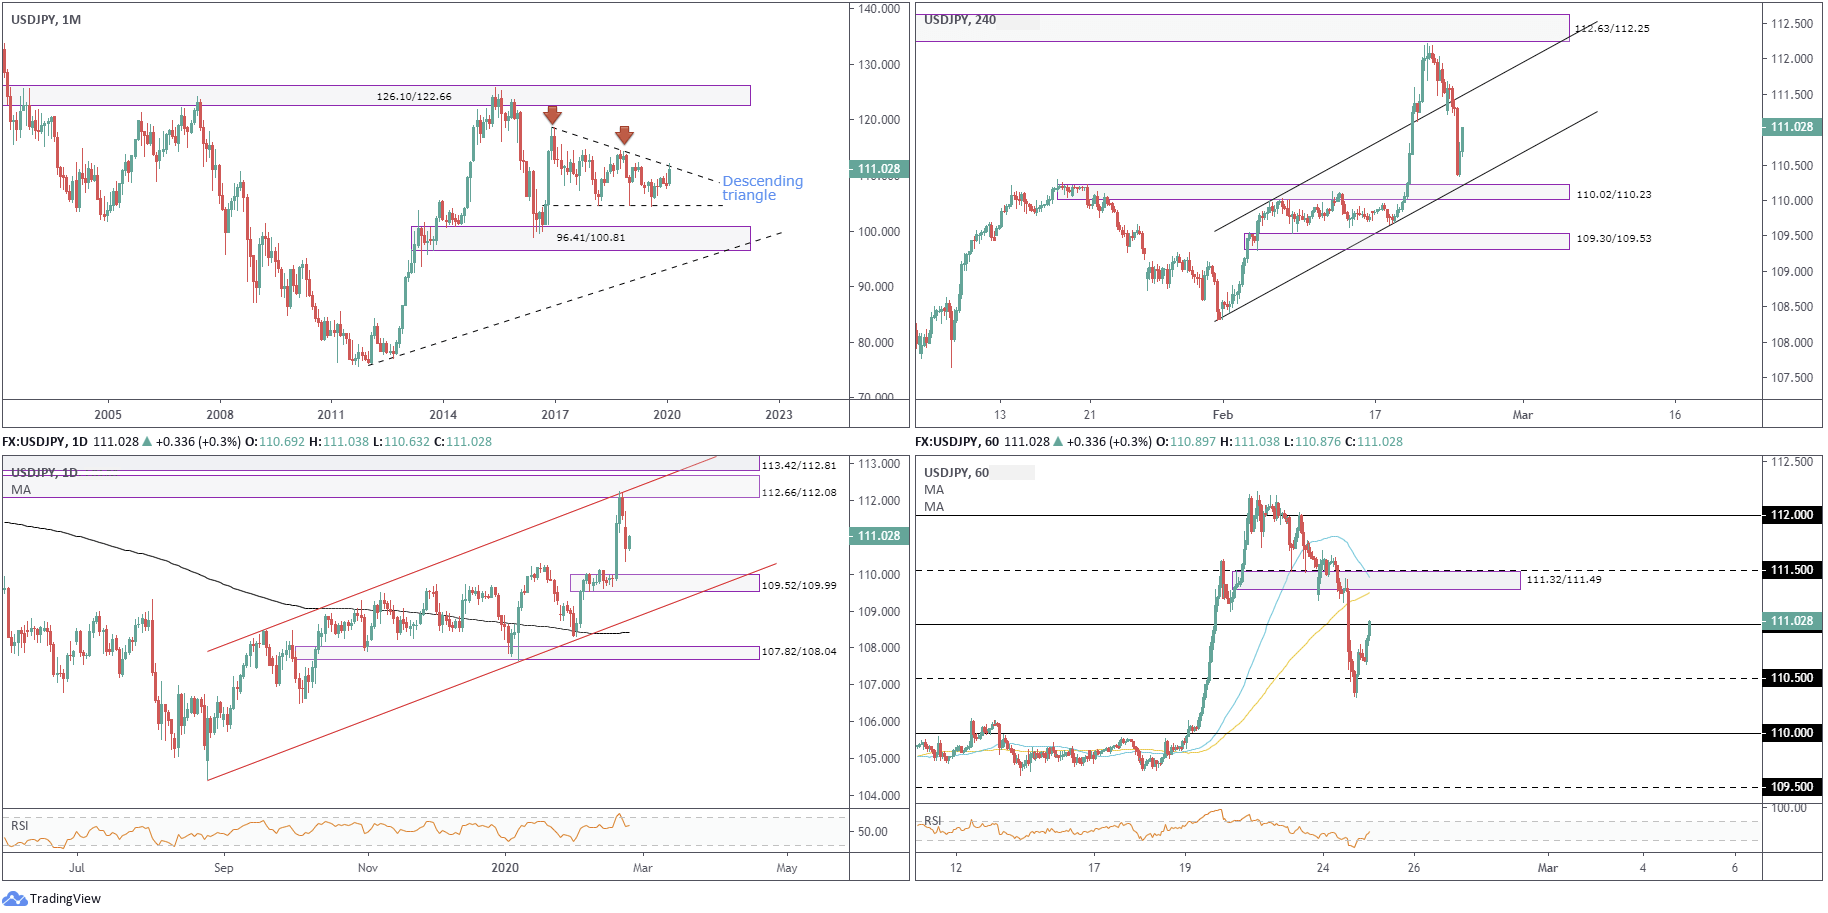
Since kicking off 2017, USD/JPY has been busy carving out a descending triangle pattern. The breakout for this configuration is common to the downside, but an upward breakout is considered more reliable and profitable. In recent movement, price elbowed a touch outside the upper boundary of the aforementioned descending triangle to 112.22, and is now seen retreating.
Outside of the current pattern, a supply area is visible at 126.10/122.66, while lower on the curve we have a demand area at 96.41/100.81.
Currently, the pair trades +2.34% on the month.
Daily timeframe:
Partially altered outlook from previous analysis –
The combination of a channel resistance from 108.47 and supply at 112.66/112.08 held price action lower at the tail end of the week. Follow-through selling was seen Monday, stretching to lows of 110.33, now poised to challenge a fresh area of demand at 109.52/109.99, typically labelled a ‘rally-base-rally demand’.
The RSI indicator also voyaged into overbought terrain in recent trading, with Monday exiting lower.
H4 timeframe:
Leaving supply at 112.63/112.25 unchallenged, USD/JPY continued to explore lower ground Monday, breaching channel resistance-turned support (109.98) and bottoming a touch north of a supply-turned demand area at 110.02/110.23. Note this area also converges with channel support (108.31)
H1 timeframe:
Despite strong moves lower Monday, early trade this morning is attempting to claw back recent losses, now crossing paths with the underside of 111 after finding a ‘floor’ off 110.50. A move above 111 has demand-turned supply seen close by at 111.32/111.49, shadowed by 111.50. In addition to this, as of current price, the 100/50-period SMAs are seen intersecting with the said zone.
Direction:
Knowing we have room to push lower from daily supply at 112.66/112.08, with weekly price holding south of structure, bearish themes could be in store today, either off the 111 handle or demand-turned supply at 111.32/111.49.
GBP/USD:
Monthly timeframe:
(Technical change on this timeframe is often limited though serves as guidance to potential longer-term moves)
Early February 2018 saw the pair reject 1.4520/1.3893, a 50.0% retracement and 38.2% Fibonacci retracement combination (red). This, along with trendline resistance (2.1161), remains a well-rounded resistance area to keep an eye on long term.
In recent months, we’ve seen a recovery form off 1.1904/1.2235, clocking highs of 1.3514 in December 2019 and breaking the 1.3380 March 2019 high.
Currently, the pair trades at -1.99% on the month.
Daily timeframe:
Partially altered outlook from previous analysis –
Demand at 1.2823/1.2910, represents the lower edge of a multi-month range (supply at 1.3303/1.3184 caps upside), continues to contain downside.
Local trendline resistance (1.3514) could make an appearance this week, as could the supply zone mentioned above at 1.3303/1.3184. Beyond the current demand, another port of demand, a touch larger than the current, resides at 1.2649/1.2799, which happens to house the 200-day SMA (1.2688).
In terms of the RSI indicator, since the beginning of the year we have been compressing within a descending channel (black lines), with the value currently holding above channel support.
H4 timeframe:
Partially altered outlook from previous analysis –
After retesting demand 1.2868/1.2894 and holding firm, the pair likely has eyes for supply drawn from 1.3023/1.3006. What’s also appealing here from a technical perspective is a potential AB=CD approach (orange) that terminates around 1.3013. A dip lower, nevertheless, could place demand at 1.2806/1.2833 back in focus.
It may also interest some traders to note that we likely have sellers attempting to fade the recent pullback from 1.2849, due to the 1.3070 double top formation recently confirming (breaking the 1.2872 low, the trough between the two peaks, marked with a blue arrow, offers double-top confirmation). The take-profit target (1.2672) for confirmed double-top patterns can be calculated by taking the distance between the highest peak and the trough and projecting this value south of the trough.
H1 timeframe:
Monday found refuge off 1.29 in early London, eventually cracking through the 50-period SMA. Demand-turned supply at 1.2965/1.2987 is in sight once again, stationed a touch south of the key figure 1.30. The RSI indicator also recently breached 50.0 to the upside, generally considered a bullish signal.
Direction:
Below is unchanged from previous analysis.
Longer term on the daily timeframe the unit exhibits scope to explore higher ground this week, aiming for a retest at trendline resistance (1.3514). However, the fact the February 11th rebound failed to post fresh highs indicates possible weakness out of the current demand.
The key figure 1.30 is likely watched by many traders as possible resistance, even more so when price-action based traders take into account we also have supply on the H4 drawn from 1.3023/1.3006 encapsulating any whipsaw that may occur above 1.30 this week.
Buy-stop liquidity above 1.30 will likely provide enough fuel for larger sellers to fade the H4 supply area at 1.3023/1.3006, with the possibility of a sizable selloff emerging, based on the recent (H4) double-top’s take profit target suggesting moves to as low as 1.2672, seen deep within daily demand at 1.2649/1.2799.
DISCLAIMER:
The information contained in this material is intended for general advice only. It does not take into account your investment objectives, financial situation or particular needs. FP Markets has made every effort to ensure the accuracy of the information as at the date of publication. FP Markets does not give any warranty or representation as to the material. Examples included in this material are for illustrative purposes only. To the extent permitted by law, FP Markets and its employees shall not be liable for any loss or damage arising in any way (including by way of negligence) from or in connection with any information provided in or omitted from this material. Features of the FP Markets products including applicable fees and charges are outlined in the Product Disclosure Statements available from FP Markets website, www.fpmarkets.com and should be considered before deciding to deal in those products. Derivatives can be risky; losses can exceed your initial payment. FP Markets recommends that you seek independent advice. First Prudential Markets Pty Ltd trading as FP Markets ABN 16 112 600 281, Australian Financial Services License Number 286354.


 Access +10,000 financial
instruments
Access +10,000 financial
instruments