
A good technical week.
Major Indices’ have staged a turn around during the week, however the road back may have a few more bumps.
Markets have traded to significant support levels to find buyers, several resistance levels remain as roadblocks to a full recovery.
As markets trade looking forward, the strongest economic event last week was the potential failure of the Chinese property group – Evergrande. Currently global markets are digesting the potential failure of this group.
Volatility may show as the most prevalent outcome to this news event, as hedge funds and investors remain alert to the outcome of this property company.
Gold and Silver have not responded as would have been expected moving lower for the week.
XJO WEEKLY
Price structure:
The importance of drawing support and resistance levels has been highlighted the past week with the XJO Index finding the 7197 (7200) area as support. The Weekly chart shows how this level has been in play since the high of January 2020.
Drawing levels on charts gives you an overall perspective of market action and sets up trading scenarios to work with.
The high close in the weekly range following a retest (c) of an historic support level offers the view of a potential retest of 7530.
Underlying primary trend remains UP.
Indicator: Relative Strength 14
RSI has remained below the 70 level after negating the potential momentum divergence signal, but as mentioned has now set a new 12-month low reading.
The RSI should be monitored for a continued move below the key level of 50 to show a shift lower to negative price momentum.
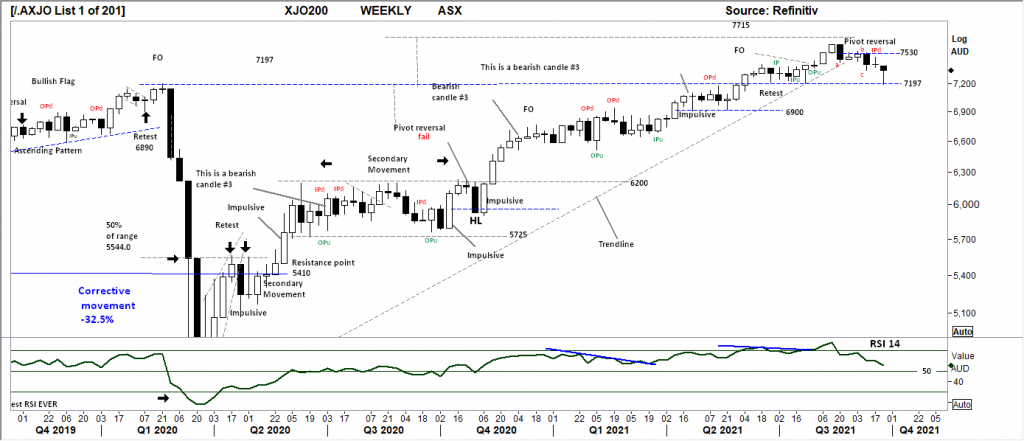
Comments from last week: Last week shows an Inside range, indicating the market remains in balance, so the breakout either way will be decisive. Looking into market structure, it is clear the large resource codes are putting a cap onto gains made in other sectors within the index. The reality remains that 7530 is the key resistance level to close above on any Weekly market gains. The tentative trendline has now been decisively broken leaving the key support levels open to being tested. The first being the 7200 area and the 6900 level.
XJO DAILY
Price structure:
The daily chart has developed an interesting “closing price” resistance level at 7370. Following the FO Low testing the WEEKLY support level of 7200 last Thursday’s large range bar sets up a further follow through higher in the coming week. Traders now have clear levels of market support and resistance. Failure to move and close above 7370 would give a strong signal of lower lows ahead.
Indicator: Relative Strength 14
With the indicator remaining below the key 50 level this would be monitored for further weakness. Daily price momentum is still regarded as negative.
Indicator: VOLUME
Trading volumes remain relatively high compared to earlier in the April to July period of 2021.
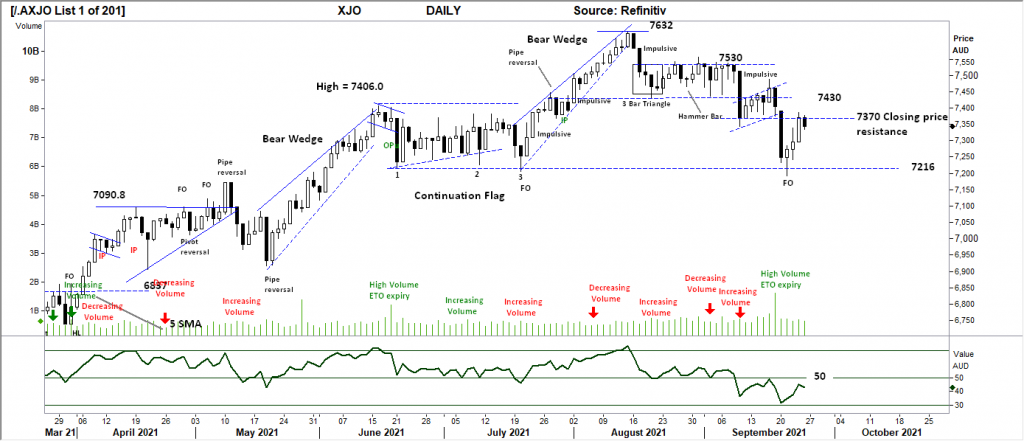
Comments from last week: The Daily chart shows a clear Bear flag developing, this daily view shows the importance of the 7430 level being earlier Support and now setting resistance, last Thursday’s close above was not followed through to higher prices with Friday’s close setting a 5-day low (close). The sellers have control of prices, 7216 remains the next lower support level.
S&P 500 WEEKLY
Price structure:
Compared to previous weeks the price bar of last week is a large range price move. The close in the high part of the range suggests further follow through to retest the highs of the past 3 weeks. This market has now entered the most important phase before a potential Bear market unfolds. Should the Index fail to take out the August high a lower high is often the early signal of lower price ahead. This market remains within the confines of a Primary UP trend, there is NO evidence of a Bear market at present.
Indicator: Relative Strength Indicator 14
Relative Strength has again remained below the 70 level, in line with the underlying price decline. The Sell line is shown around the 65 level, this has now been reached. It can also be observed that the RSI can track sideways below the “70” level and above the 50 level as price creep/consolidation takes place.
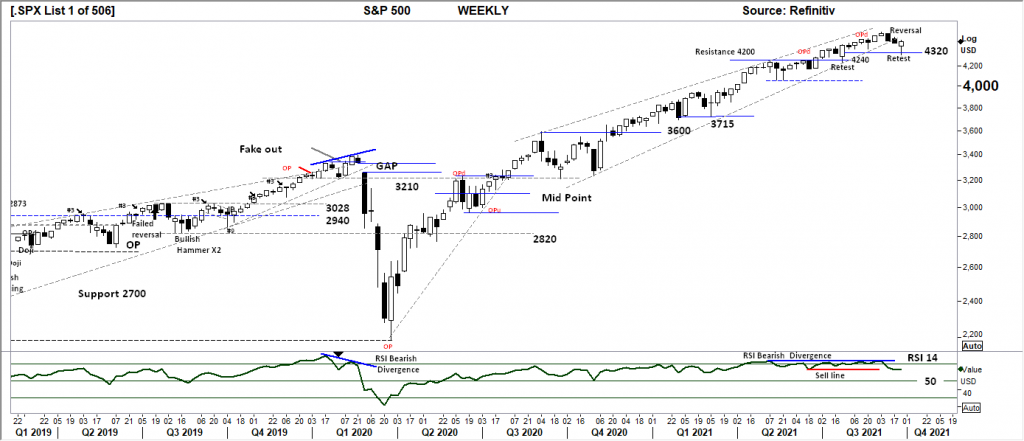
Comments from last week: A short-range week last week, but a down close and new 4 week low outside of the defined rising wedge pattern. This may be regarded as the first real reversal signal of the past 12 months and should be taken seriously. Several support levels remain to be tested, the first at 4320, this will be the further and real test of this current price weakness being displayed. Underlying Primary trend remains “UP”.
S&P 500 DAILY
Price structure:
The a, b, c reversal is now complete. With the earlier “tentative” trend line broken the new tentative trendline is now in place following the 3 bar reversal pattern following through to close above the 4444 level mentioned in last week’s comments.
Price has reversed back into the Weekly UP trend and would be expected to retest the 4536 level. Failure to reach this level in the coming days will give traders an insight into underlying market sentiment.
Indicator: Relative Strength 14
The RSI has moved below the 50 level and indicates a loss of price momentum. Price momentum is now regarded as negative. However the “U” turn back to the 50 level should be monitored for further indication of improving price momentum.
Traders will now monitor the RSI for a movement above the 50 level to confirm any Bullish price action.
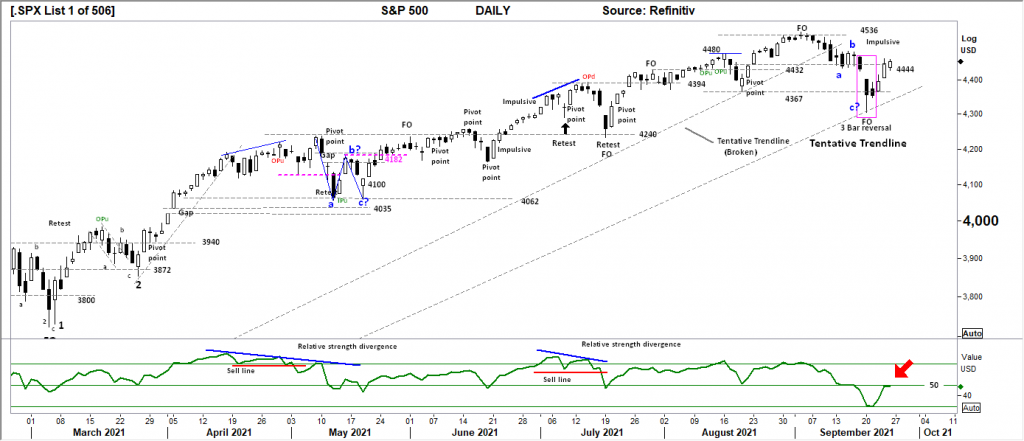
Comments from last week: The daily chart gives a better short-term perspective with price closing below the first level of support at 4444. The daily trendline has been broken decisively, in this case support levels have to be used as a gauge to market sentiment. Overall, the daily price is within a trading range albeit closing at the low side. Further weakness may target the 4367 level. The RSI has moved below the 50 level and indicates a loss of price momentum and would be viewed as a signal for price to retest the support levels at 4367. Price momentum is now regarded as negative. This is now at risk of moving to the 30 level on an underlying bearish momentum price movement.
NASDAQ DAILY
Price structure: This Index is the most concerning for traders
As with other Indices’ the Nasdaq has recovered higher following last Monday’s retest of the long term trendline. (the importance of drawing and keeping accurate trend and support lines). The a, b, c type retracement is now complete following the 3 bar reversal from the trendline retest. (c)
This index would now be monitored for a retest of the 15534 level in the coming days.
Indicator: Relative Strength 14
The Relative Strength Indicator has turned higher last week. The minor close over the 50 level is a positive, but much has to be done to turn bullish positive.
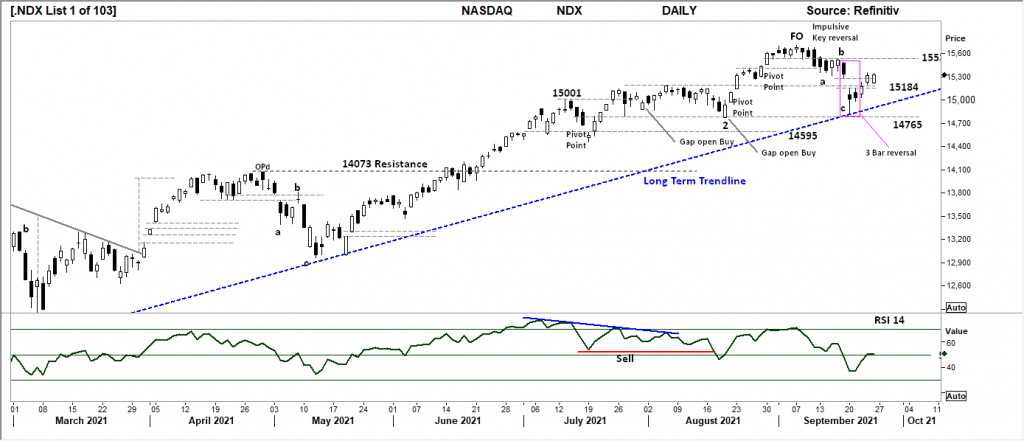
Comments from last week: The first short term trendline is now being challenged with the next support shown at 15184 as the go to level on further weakness in price. With 9 down close days in the past 15 the “key reversal” bar of Friday 2 weeks ago shows the Bears taking control of price as the first resistance level of 15534 came into play last week. Last Friday’s close reaffirms this premise. Within Nasdaq stocks there has been some extraordinary gains over the past 12 months, traders should expect some consolidation and profit taking. The Nasdaq remains within the definition of a Primary UP trend.
USD Spot GOLD – DAILY
Price structure: No evidence of a Bull market.
Gold has failed at the retest of the $1788.0 level building a bearish flag and setting a new low last Thursday on the breakdown. The Weekly trendline remains in play as the current price target circa $1720. The underlying Primary trend of Gold remains Down. In the short term support remains at $1725 and resistance is shown at $1834.0
Indicator: Relative Strength 14
The Relative Strength moving below the 50 level is heading back to the 30 level, a signal of decreasing price momentum and should again be monitored for a further move lower.
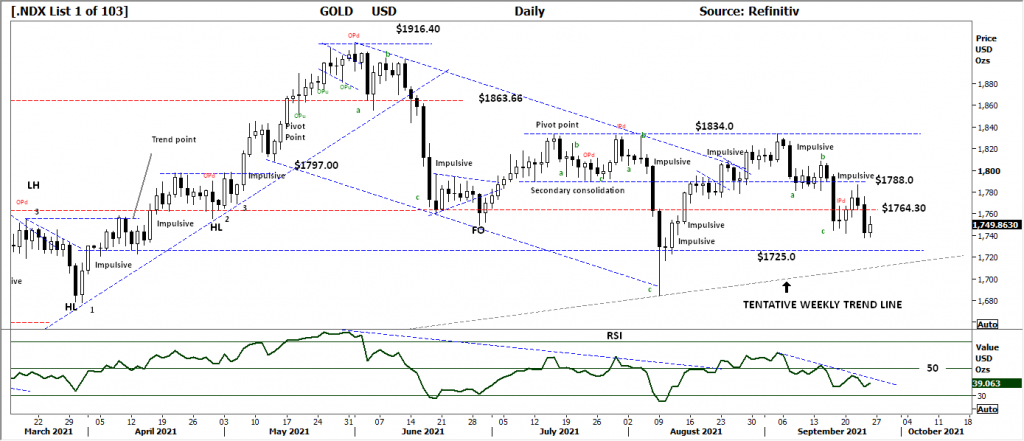
Comments from last week: No Bull market here, not even a signal. The inflation hedge is not working. The current price move below $1764.30 has been decisive with the large range bar of last Thursday. The first observation is for the Weekly trendline to be tested in the coming days, as Friday’s movement has “back-tested” this important level and closed towards the low of the session. Gold has remained within a large trading range with $1834.0 as resistance and $1764.30 as support, this key support level has now been breached on a strong momentum price move. The Relative Strength moving below the 50 level is heading back to the 30 level, a signal of decreasing price momentum and should again be monitored for a further move lower.
SILVER DAILY
Price structure:
Silver remains within the confines of a Primary Down trend. The OP and impulsive movement 2 weeks ago remain in play on this Daily chart. The current level of $22.50 has the potential to set an important support level in the coming days. A move lower target the next support level at $21.60.
Indicator: Relative Strength 14
Current Relative Strength is now viewed as lost upward momentum, with the continuing movement below the 50 level. The 30 level is easily the first target, here traders should look for a swing bullish divergence signal as the first sign of real support.
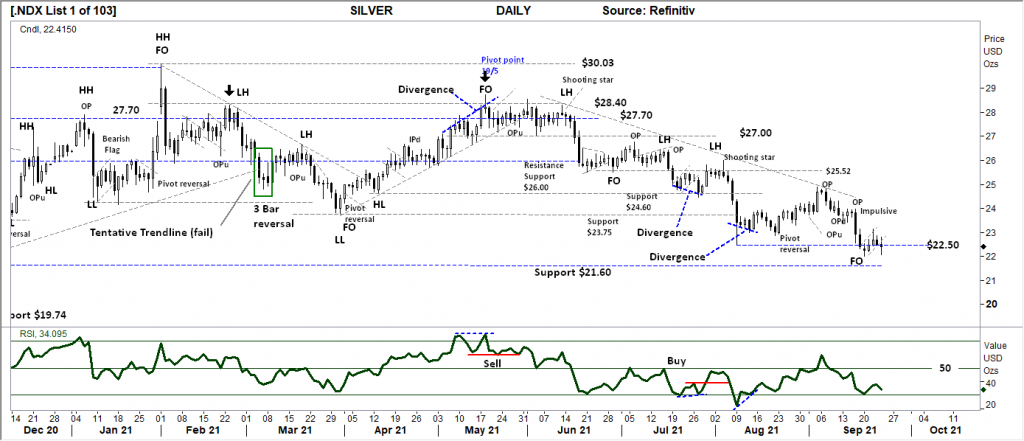
Comments from last week: Silver is clearly the weaker of the two frontline precious metals. Silver last week, set a 12-month closing price below $22.50. The potential Fake out low (FO) where price crosses below a previous spike low point, is the current observation, only price trading back over this level would give a small bullish signal. The favoured move is to retest the $21.60 level in the coming days. Silver remains within the definition of a Primary down trend.
AUD GOLD DAILY
Price structure:
The current price decline inline with the underlying USD gold price is not providing support for the local Australian Gold producers. Resistance at 2477 was again tested last week with an immediate rejection. The next level of support remains at $2326.0.
Indicator: Relative Strength 14
Relative Strength moving back below the 50 level is in line with price movements. Price momentum has again turned negative, further declines in price will see the RSI decline further.

Comments from last week: The lower high set below the $2477.0 is a bearish move in the $AUDUSD gold price, and indicates the potentially bullish a,b,c pattern has failed with a new low being made. The potential is for a move to retest the $2326.0 level. This would require a weaker $USD gold price or a rally in the $AUD or both to some degree. With the current $AUD declining in line with Gold, at best observation is consolidation of price at these key levels and remains between resistance of $2541.0 and support of $2360. This should see some further consolidation of the current low prices in Australian Gold producers.
COPPER DAILY
Price structure:
With $4.00 again retested, Copper remains within the confines of a trading range. However the high close of last week (hammer) sets the potential for a break above the important $4.33 level and ultimate retest of the highs above $4.50. As an indication of price strength an immediate follow through must occur to show buyers in control.
Indicator: Relative Strength 14
In line with the weekly reversal bar the RSI has turned flat but is at risk of again crossing below the 50 level should upward momentum slow.
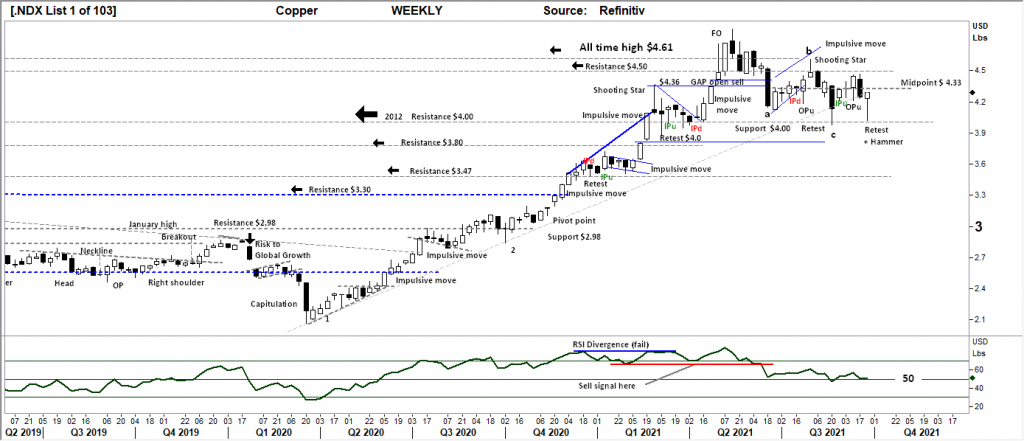
Comments from last week: The best bullish indicator of 2 weeks ago has now failed with price again moving below the key level of $4.33 following what is now a retest of the $4.50 level. Last week’s range is strong and could be reviewed as a key reversal range testing the longer-term trend line. The price structure of the past 5 weeks is setting up a bearish flag pattern for a retest of $4.00 the potential move to come.
AUSTRALIAN VOLATILITY INDEX:
This new drive past week has seen the XVI spike higher into negative territory for equities. However the final close below the 13 level is viewed as a positive for the coming week. The tenant that states low volatility precedes high volatility has held true.
The XVI is the difference of 1–3-month forward pricing of ETO Options against the current month.
As markets anticipate events, the forward priced option volatility changes, hence as forward price changes, this “skew” in pricing is measured in this XVI.
The XVI value works as an inverse observation to the underlying market.

Comments from last week: Over the past weeks the comments stated, “Volatilities can change very quickly on news items and trader sentiment.” Last week’s higher reading may again be an early signal of a further risk off event in the equities markets approaching. The tenant that states low volatility precedes high volatility has held true. Risk insurance IS being priced into the premiums as forward options are being priced higher.
USD DOLLAR INDEX
Price structure:
The rising USD Index has again found resistance at 93.45, the small continuation pennant at present indicates a bullish bias for this index. This is a big level to cross with 94.70 as the next target as the underlying Primary UP trend continues.
Indicator: Relative Strength 14
The Relative Strength has decisively crossed the 50 level to turn bullish. This is a very good indicator of strong bullish momentum underway, the final downturn is in response to the formation of the price pennant.
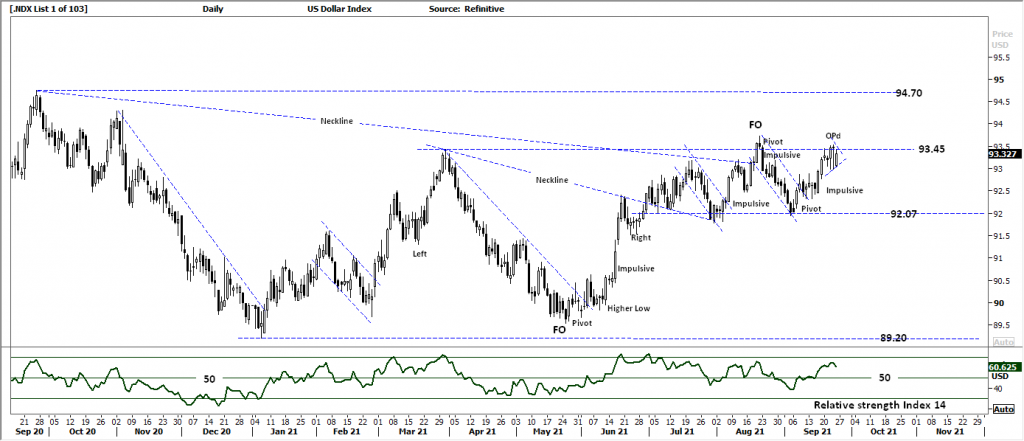
Comments from last week: Strong bullish day’s have underscored last week’s price movement. Although the DXY remains within a tight range of 92.07 to 93.45. Current price movements should see the 93.45 level tested; a breach higher over this level would be an important signal for the bullish for a retest of 94.70. This will bring a further bearish cloud across the FX market outside of the USD as money floods into the USD.
WTI CRUDE OIL
Price structure: This commodity is news driven by supply -demand.
The WTI contract continues to push higher to retest the $75.20 level in line with the underlying Primary trend. A solid close over the $75.20 level sets up the contract for a move to $100bl in the coming months.
Indicator: Relative Strength 14
RSI set a sharp reversal from the “30” level to move over the 50 level, looking for a further rise in this indicator as confirmation of the underlying Bullish view in the current price action.

Comments from last week: It should be acknowledged the current price range from $61.80 to resistance of $75.20 has remained above the major trading ranges of the past several years, $66.0 being the key level to hold going forward. The WTI contract looks ready to retest the $75.20 level on a momentum move. Oil remains within the confines of a Primary UP trend. Should a solid closing price over the $75.20 level occur, this chart will be setting out higher resistance levels up to $100bl.


 Access +10,000 financial
instruments
Access +10,000 financial
instruments