
XAU/USD
Daily Timeframe.
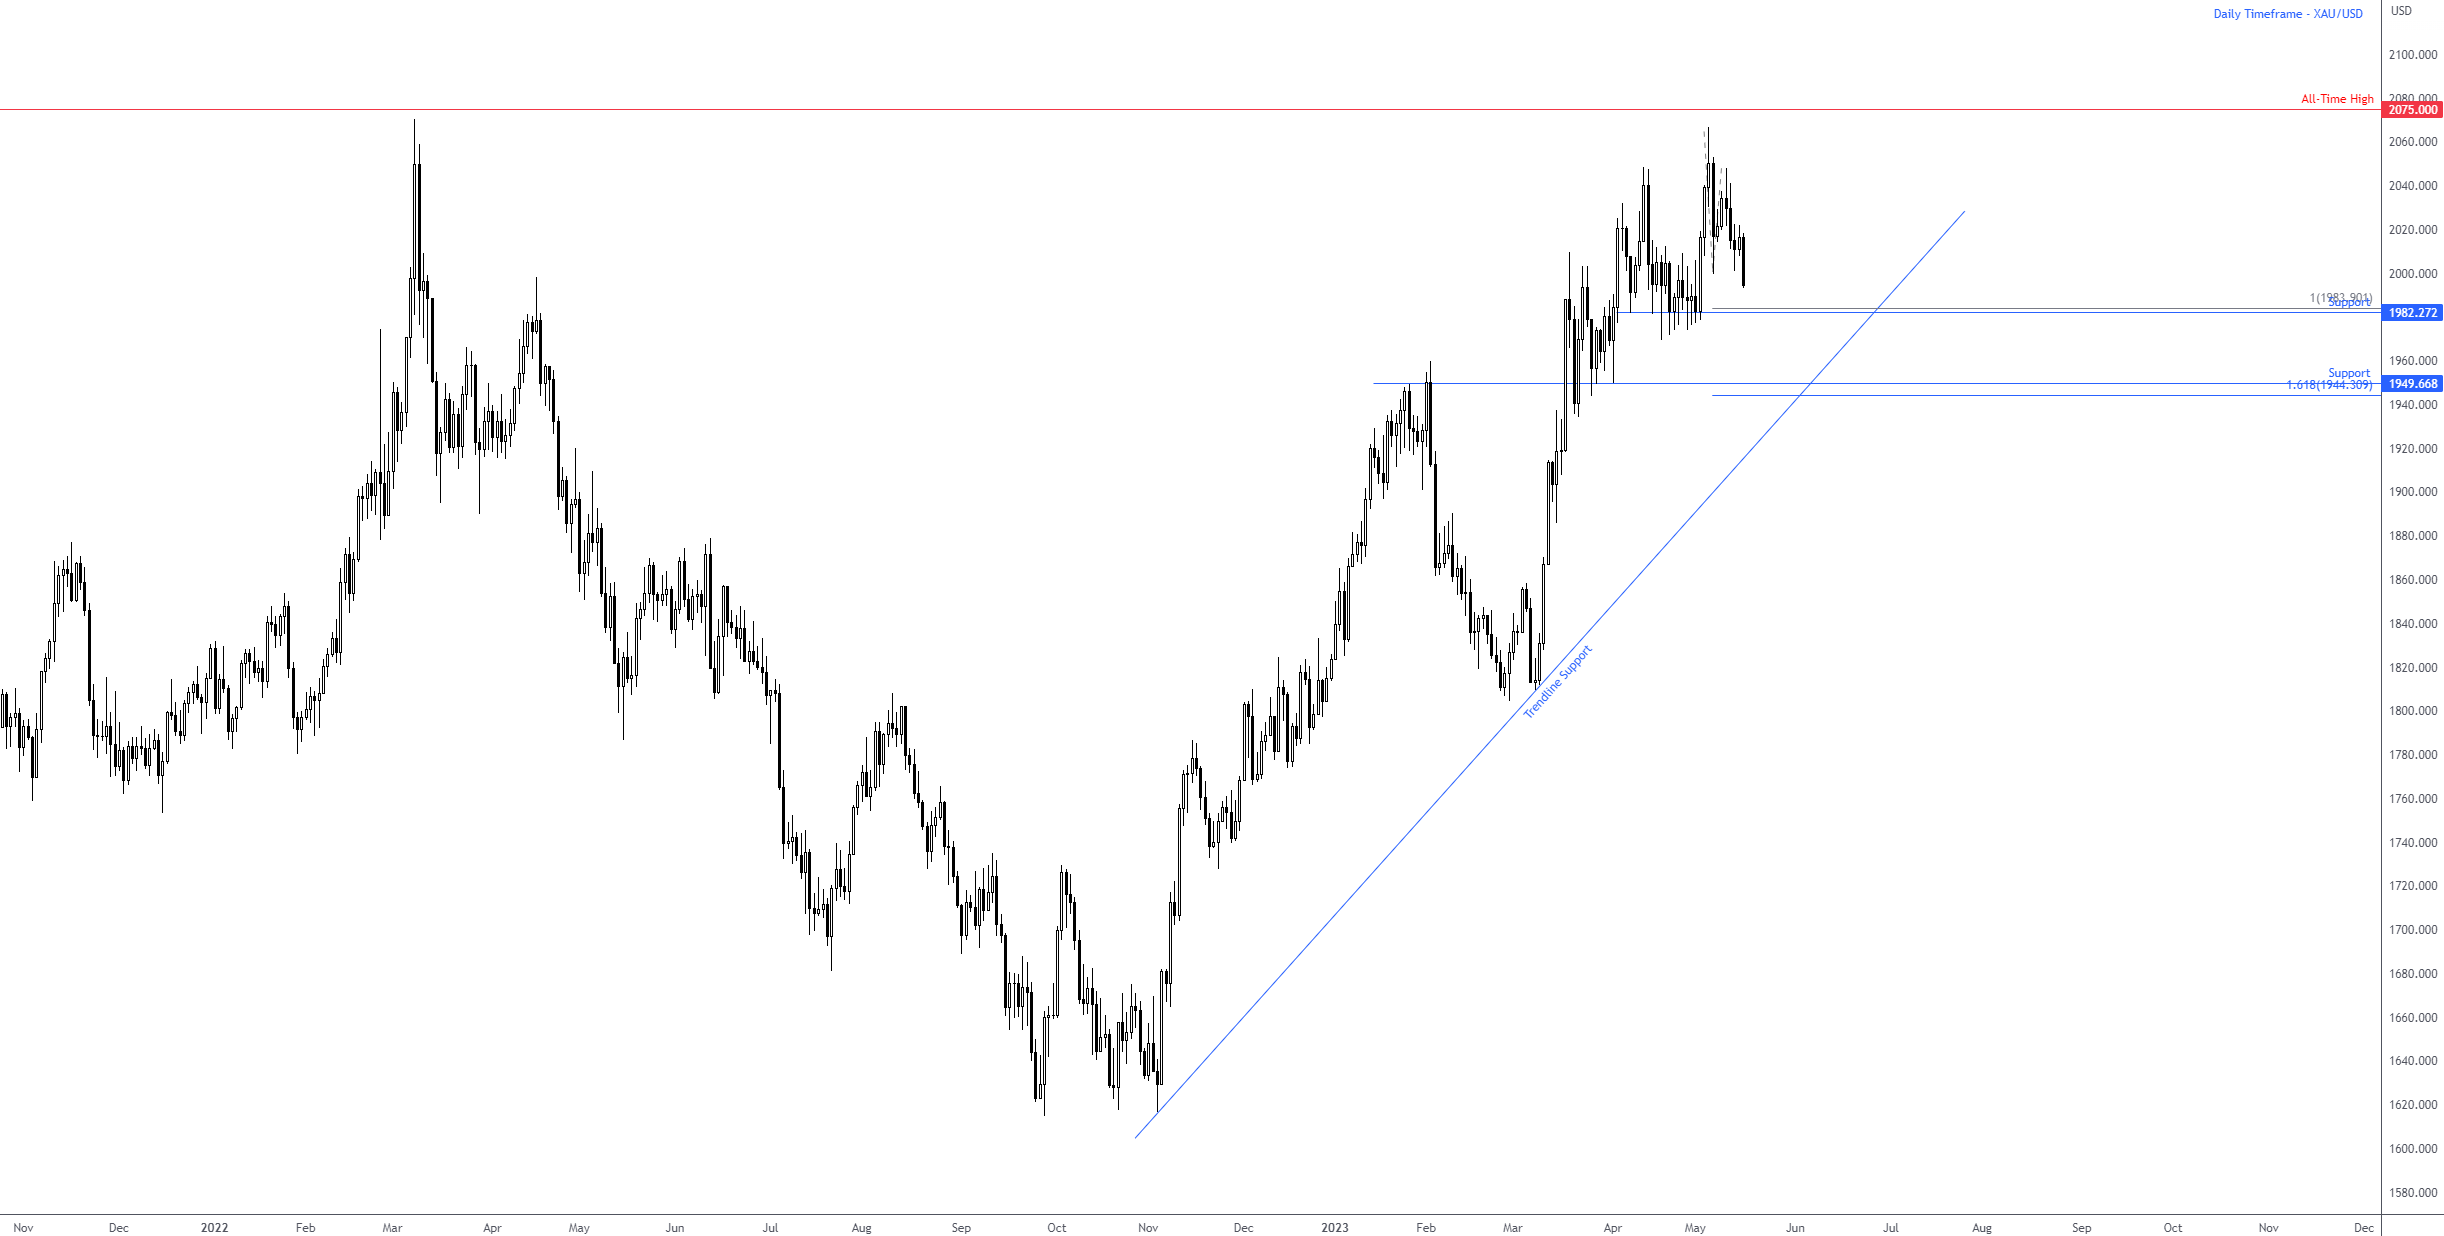
Kicking things off with spot gold. In dollar terms, the XAU/USD aimed at the $1,999 5 May low on Tuesday and probed space south of the aforementioned low. As noted in recent analysis, which can be found here, I emphasised the point that should the yellow metal seek space beneath $1,999, this would unearth a potential bearish setting (albeit against the current uptrend that has been active since September 2022). As a result of recent action, sellers may take command and target support from $1,982, which happens to share chart space with a 100% projection at $1,983 (equivalent AB=CD support).
In the event of a follow-through move to the downside beyond here, the technical radar will shift toward support at $1,949, a level bolstered by trendline support taken from the low $1,616 and a 1.618% Fibonacci projection at $1,944 which many harmonic traders will recognise as an ‘alternate’ AB=CD bullish configuration.
If you check the H1 chart, as of writing price is on the verge of closing beneath $1,999. Therefore, short-term players may look for a retest of the breached level to play out before committing and aiming at the daily support mentioned above at $1,982.
 WTI Oil
Daily Timeframe.
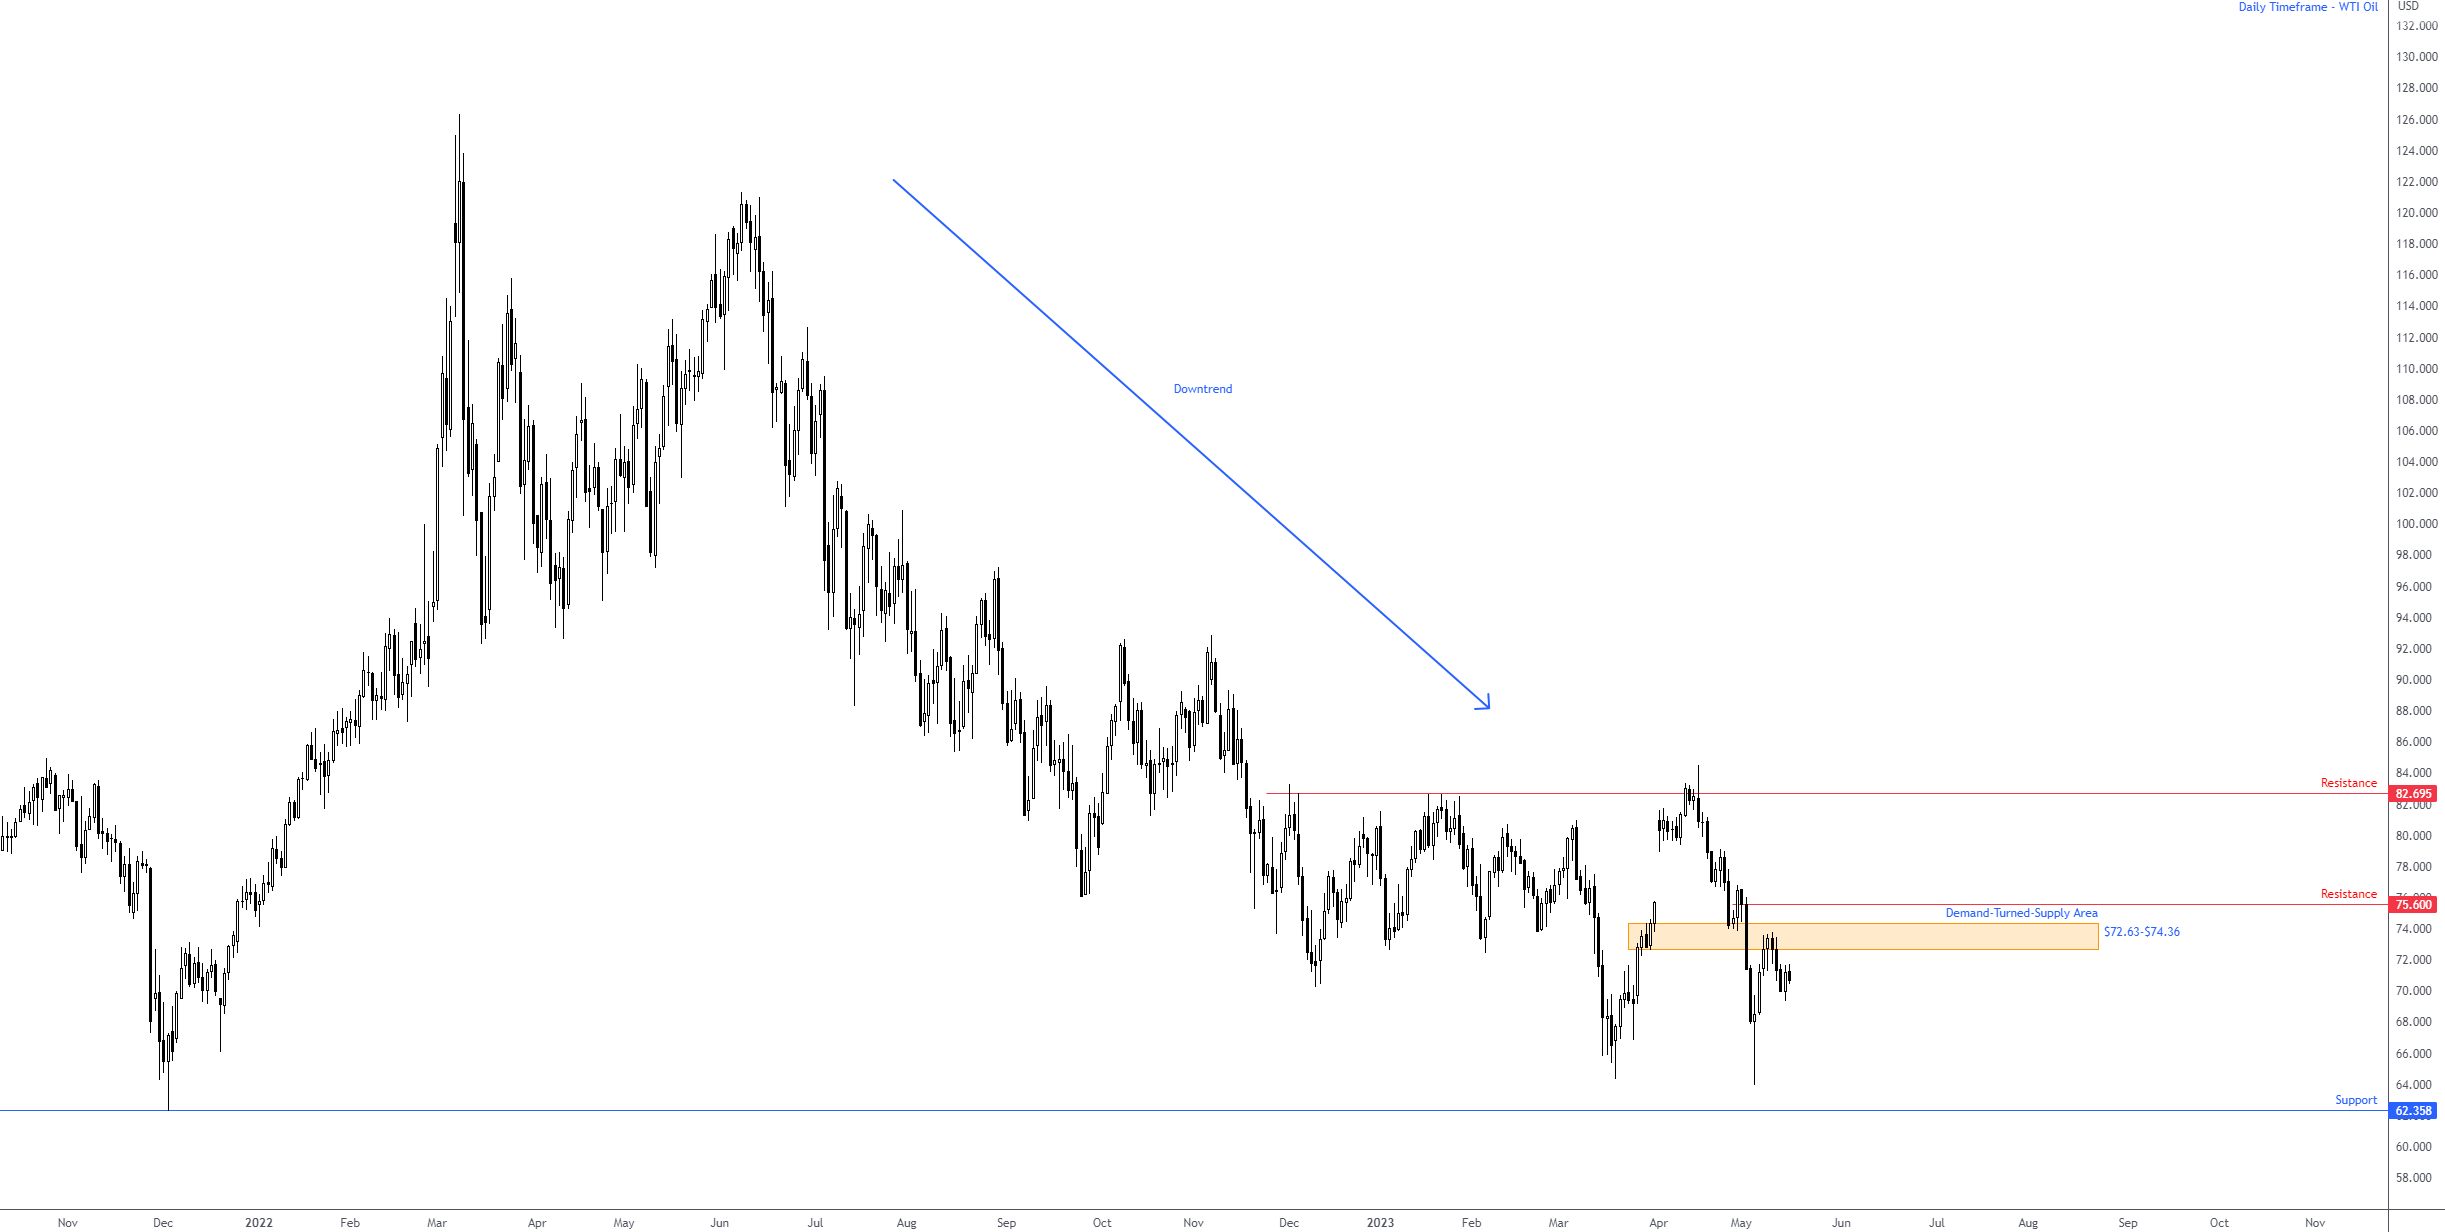
The price of oil has been on a downward slide since topping at $126.35/bbl, pencilling in a series of lower lows and lower highs since March 2022.
I did note that since the unit chalked up a lower low at $63.94 (4 May), a move which reaffirmed the market’s bearish bias, a sell-on-rally scenario could emerge from the demand-turned-supply zone at $72.63-$74.36. As you can see, this did indeed take shape and sellers put in a reasonably strong appearance from the zone. The question is whether sellers have enough gas in the tank to take things beyond $63.94 to shake hands with support coming in from $62.36.
Another key observation on the daily chart is resistance nestled directly above $72.63-$74.36 at $75.60. This, in fact, is what I would term a decision point that was shaped before breaking below $72.63-$74.36, therefore whipsawing north of the aforementioned area (and consuming any stops) into $75.60 may be enough to trigger a stronger, more meaningful downside move. Time will tell. Regardless, this remains a bearish market for now, favouring a push towards fresh lows.
 XAG/USD
Daily Timeframe.
I also wrote about spot silver in recent analysis, which can be found here.
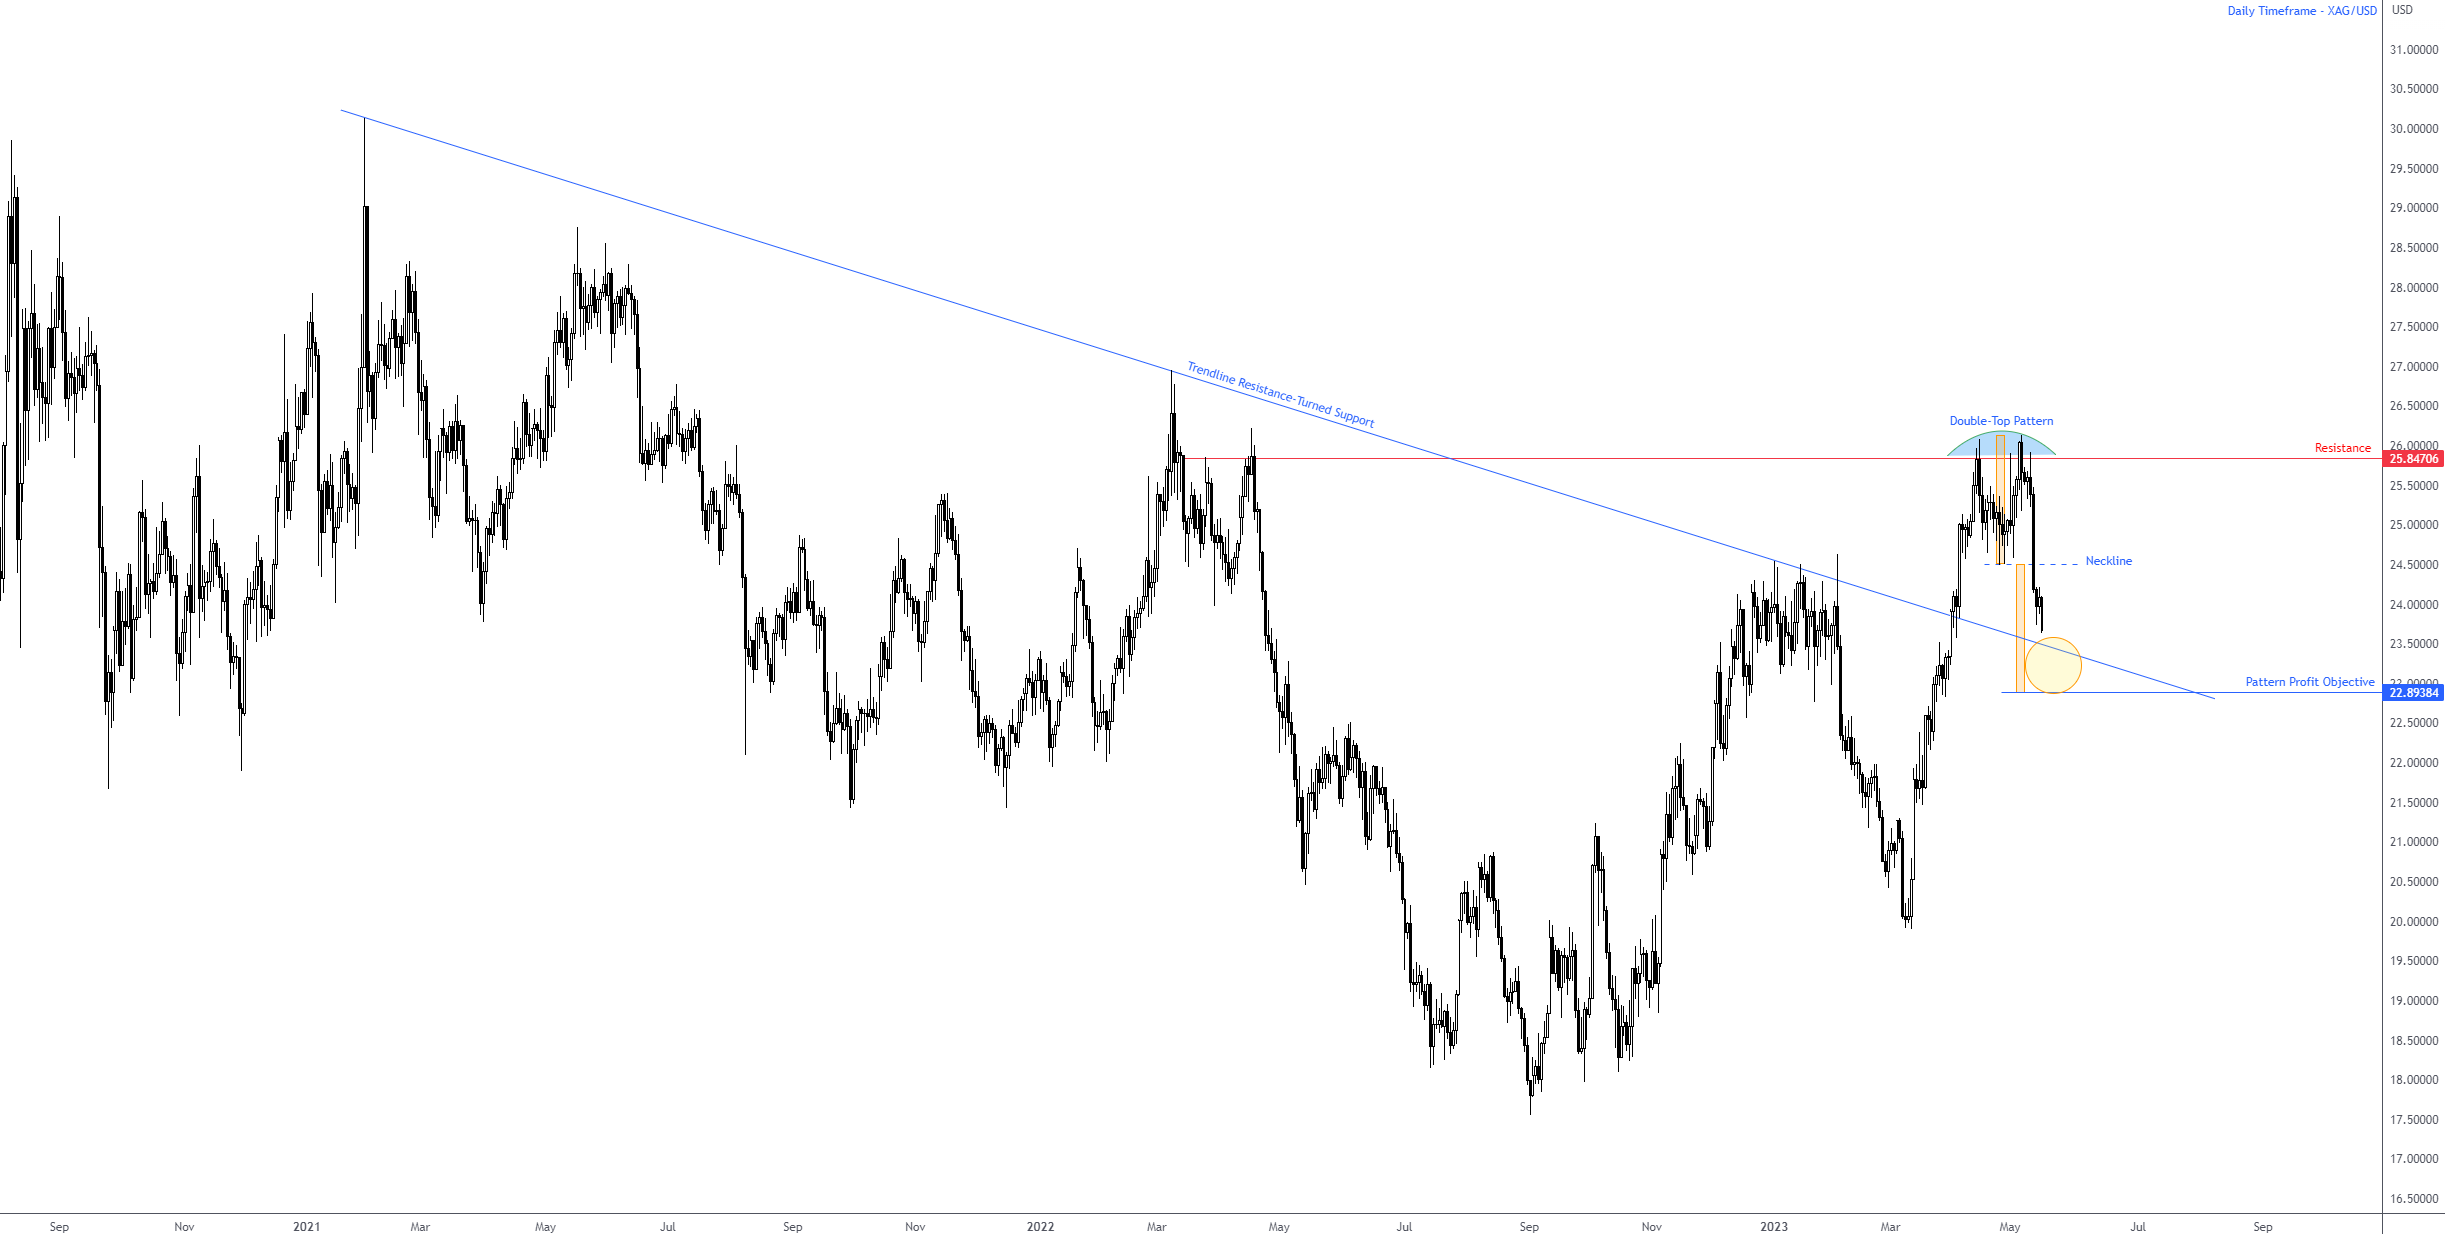
As noted, XAG/USD probed south of a neckline ($24.51) of a double-top pattern formed around resistance at $25.85. As evident from the chart, sellers remain determined to explore deeper water and test the mettle of nearby support, shaped by way of a long-term trendline resistance-turned-support taken from the high of $30.14, closely followed by the double-top pattern’s profit objective at $22.89. Although a retest of the neckline could still unfold, it is unlikely before we touch the aforesaid trendline support.
However, I made it clear in previous writing that the trend in this market is similar to gold: northbound. Consequently, testing the space seen between the trendline support and the pattern’s profit objective (circled) could be enough of a technical floor to encourage not only dip buying, but also short covering.
 Charts: TradingView
DISCLAIMER:
The information contained in this material is intended for general advice only. It does not take into account your investment objectives, financial situation or particular needs. FP Markets has made every effort to ensure the accuracy of the information as at the date of publication. FP Markets does not give any warranty or representation as to the material. Examples included in this material are for illustrative purposes only. To the extent permitted by law, FP Markets and its employees shall not be liable for any loss or damage arising in any way (including by way of negligence) from or in connection with any information provided in or omitted from this material. Features of the FP Markets products including applicable fees and charges are outlined in the Product Disclosure Statements available from FP Markets website, www.fpmarkets.com and should be considered before deciding to deal in those products. Derivatives can be risky; losses can exceed your initial payment. FP Markets recommends that you seek independent advice. First Prudential Markets Pty Ltd trading as FP Markets ABN 16 112 600 281, Australian Financial Services License Number 286354.


 Access +10,000 financial
instruments
Access +10,000 financial
instruments