GBP/USD Crossing Swords with Technical Confluence!
- Daily Analysis, Daily Report, Recent Posts, Technical Analysis, Trending Now
- April 22, 2024

Versus the US dollar, the price of Bitcoin is nearly 8% higher, week to date. You can see from the weekly timeframe that support managed to remain in the fight at $28,844 this week, with price on the cusp of reclaiming the entire portion of last week’s 9% decline. While the Relative Strength Index (RSI)
READ MORE
Earnings Meta Platforms Inc (META) is poised to report earnings after today’s market closes. The consensus EPS estimate is approximately $1.96 for the fiscal quarter ending March 2023 versus the same quarter a year prior at $2.72. Technical Position for META Since bottoming at $88.09 in early November (2022), the stock price has staged an
READ MORE
Market technician’s view of charts that affect Equities. Consideration for equity traders this week remains the results of the US reporting season, these results have an impact on market sentiment over the coming weeks. Following the completion of the Australian reporting season, Australian equities will endure the risk of re-rating from analysts as the forward
READ MORE
This week’s economic calendar delivers several tier-1 risk events to monitor, including US consumer confidence data on Tuesday, Aussie inflation and US durable goods data on Wednesday, Q1 GDP and weekly jobless claims on Thursday in the US, followed by the Bank of Japan (BoJ) rate decision and the US Core PCE Price Index on
READ MORE
Euro area, UK and US manufacturing/services PMIs are in focus tomorrow. The euro area PMIs are scheduled to be released in early European cash trading at 9:00 am GMT+1, followed by UK PMIs 30 minutes later at 9:30 am GMT+1, and then US PMIs in the early hours of US cash trading at 2:45 pm
READ MORE
Your weekly review of technical patterns and structure. The research team scans the financial markets for you, highlighting clear and actionable technical structures. Forex: USD/JPY Shaking Hands with Daily Resistance Daily Timeframe – In recent trading, price action on the daily timeframe of USD/JPY touched gloves with the upper Bollinger Band (set to two standard
READ MORE
UK Inflation 7:00 am GMT+1 on Wednesday will see the latest UK inflation data released by the Office for National Statistics (ONS). Economists’ estimates call for a nudge back into single digits for the YoY measure for March, with Bloomberg’s median estimate at 9.8%. Yet, the estimate range spans between a high of 10.1% and
READ MOREIndex and Commodities for the trading week beginning 17/04/2023 Market technician’s view of charts that effect: EQUITIES Consideration for equity traders this week will be the results of the US reporting season, these results have an impact on market sentiment over the coming weeks. Following the completion of the Australian reporting season, Australian equities will endure the
READ MORE
Following the Bank of Canada (BoC) hitting the pause button on policy tightening, the Reserve Bank of Australia (RBA) followed suit at its previous meeting. This saw the central bank hold the Official Cash Rate at 3.6%, following ten consecutive rate hikes from May 2022, totalling 350 basis points. Key Points Out of the RBA
READ MORE
There is plenty to get our teeth into this week. The minutes from the latest RBA meeting is scheduled to be released on Tuesday in the early hours of trading (2:30 am GMT+1), offering a comprehensive record of the central bank’s recent rate decision, which saw the RBA increase the Official Cash Rate to 3.6%.
READ MORE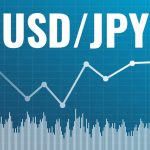
One of the simpler harmonic patterns is the AB=CD equivalent configuration, which graced the H1 chart of USD/JPY in recent trading. Active AB=CD Pattern Denoted through a 100% projection at ¥132.09, we can see that short-term price action rebounded from the AB=CD termination point in recent trading in a market echoing an uptrend. Regarding upside
READ MORE
Your weekly review of technical patterns and structure. The research team scans the financial markets for you, highlighting clear and actionable technical structures. Forex: EUR/USD Overbought? H1 Timeframe – Intraday flow on the H1 timeframe of the EUR/USD shows price action touching the upper Bollinger Band (set to THREE standard deviations), accompanied by negative divergence
READ MORE


 Access +10,000 financial
instruments Auto open & close positions News & economic calendar Technical indicator & charts Many more tools included
Access +10,000 financial
instruments Auto open & close positions News & economic calendar Technical indicator & charts Many more tools included
By supplying your email you agree to FP Markets privacy policy and receive future marketing materials from FP Markets. You can unsubscribe at any time.
