Bears In the Driving Seat for Tesla (TSLA)
- Daily Analysis, Daily Report, Recent Posts, Technical Analysis, Trending Now
- April 18, 2024

Chart Source: Trading View EUR/USD: Monthly timeframe: (Technical change on this timeframe is often limited, though serves as guidance to potential longer-term moves) Following a three-month retracement slide, demand at 1.1857-1.1352 made an entrance and has sparked a bullish revival in April, up 3.1 percent MTD. Erasing March losses, recent upside throws light on the
READ MORE
Chart Source: Trading View US Dollar Index (Daily Timeframe): Shedding 0.9 percent, and delivering a third successive weekly loss, the US dollar, according to the US dollar index (ticker: DXY), continues to reflect a bearish climate. 91.00 support, as you can see, made an entrance early week, though came under fire after price failed to
READ MORE
Charts: Trading View EUR/USD: Monthly timeframe: (Technical change on this timeframe is often limited, though serves as guidance to potential longer-term moves) Following the three-month retracement slide, demand at 1.1857-1.1352 sparked a bullish revival in April, up 2.3 percent MTD. The possibility of fresh 2021 peaks is on the table, followed by a test of
READ MORE
Charts: Trading View EUR/USD: Monthly timeframe: (Technical change on this timeframe is often limited, though serves as guidance to potential longer-term moves) Following the three-month retracement slide, demand at 1.1857-1.1352 sparked a bullish revival in April, up 2.6 percent MTD. The possibility of fresh 2021 peaks is on the table, followed by a test of
READ MORE
Chart Source: Trading View EUR/USD: Monthly timeframe: (Technical change on this timeframe is often limited, though serves as guidance to potential longer-term moves) Following the three-month retracement slide, demand at 1.1857-1.1352 sparked a bullish revival in April, up 2.5 percent MTD. The possibility of fresh 2021 peaks is on the table, followed by a test
READ MORE
Chart Source: Trading View EUR/USD: Monthly timeframe: (Technical change on this timeframe is often limited, though serves as guidance to potential longer-term moves) Following the three-month retracement slide, demand at 1.1857-1.1352 sparked a bullish revival in April, up 2.6 percent MTD. The possibility of fresh 2021 peaks is on the table, followed by a test
READ MORE
Charts provided by Trading View US Dollar Index (Daily Timeframe): According to the US dollar index, the greenback extended the recent retracement slide by 0.7 percent last week and concluded a touch off session lows. Technical movement observed an early-week retest at the lower side of the 200-day simple moving average, currently circling 92.21. This
READ MORE
Charts provided by Trading View EUR/USD: Monthly timeframe: (Technical change on this timeframe is often limited, though serves as guidance to potential longer-term moves) March carved out a third consecutive loss, extending the 2021 retracement slide by 2.8 percent. Recent underperformance, as you can see, pulled EUR/USD into the upper range of demand at 1.1857-1.1352.
READ MORE
Charts provided by Trading View EUR/USD: Monthly timeframe: (Technical change on this timeframe is often limited, though serves as guidance to potential longer-term moves) March carved out a third consecutive loss, extending the 2021 retracement slide by 2.8 percent. Recent underperformance, as you can see, pulled EUR/USD into the upper range of demand at 1.1857/1.1352.
READ MORE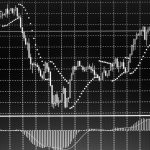
Charts provided by Trading View US Dollar Index (Daily Timeframe): The US dollar, as measured by the US dollar index (ticker: DXY), shed nearly 1 percent last week and snapped a three-week bullish phase. Technically speaking, the highlight of the week was the index journeying back under the 200-day simple moving average at 92.33, movement
READ MORE


 Access +10,000 financial
instruments Auto open & close positions News & economic calendar Technical indicator & charts Many more tools included
Access +10,000 financial
instruments Auto open & close positions News & economic calendar Technical indicator & charts Many more tools included
By supplying your email you agree to FP Markets privacy policy and receive future marketing materials from FP Markets. You can unsubscribe at any time.
