
Reading time: 10 minutes
Boasting a long and colourful history, Japanese candlestick charts are universally acknowledged within the technical community as a means of displaying price action across multiple time periods (timeframes).
Steve Nison is an author who is credited with showcasing the power of candlestick pattern analysis to the western world. The author is known for publishing Japanese Candlestick Charting Techniques in 1991 and publishing Beyond Candlesticks in 1994. Through years of research, translations and assistance from Japanese candlestick practitioners, Nison amassed a wealth of material dating back to the 1700s.
The most prominent trader according to Nison’s research is Munehisa Homma, a Japanese rice trader who employed previous price data to estimate future market movement.
Candlestick Chart Structure
The candlestick comprises of a session’s high (upper shadow or upper wick), a session’s low (lower shadow or lower wick), the opening price, and the closing price and real body (figure 1.A). This differs from a line chart, which is a series of closing prices that establishes a continuous line.
A bar chart delivers a comparable structure, though is void of a real body. However, the open and close prices are displayed through horizontal lines that protrudes from the stem. It is said Japanese traders believe the essence of price is defined by the real body.
High and low prices indicated on the candlesticks inform chartists of a period’s extremes.

(Figure 1.A: Candlestick Structure)
Popular Candlestick Patterns
Among the many Japanese candlestick configurations gracing financial markets, bullish and bearish reversal formations (patterns forming after an uptrend or downtrend [trend reversal signals]) are often spoken by beginner Forex traders.
Doji Candlesticks:
Featured in a number of candlestick pattern variations, such as the ‘morning and evening star’, or ‘harami cross’, the doji represents an isolated formation, shaped by way of a cross with a small body (real).
Conveying an equilibrium through ‘indecision’, a doji echoes a lack of enthusiasm, threatening the possibility of a reversal in price.
Figure 1.B illustrates the following doji formations:
- Traditional Doji Patterns.
Conventional dojis work with a centralised real body (opening and closing prices are equal [there is flexibility to this rule: the open and close range must not be wide enough to be an obvious spinning top]) and well-defined candle highs and lows. The interruption in price movement demonstrates slowing momentum.
A northern doji forms after an advance, while a southern doji is established after a decline.
A long-legged doji exhibits a variation of a traditional doji pattern, presented with extended upper and lower shadows (long wicks). Similar to the doji, a long-legged configuration exposes a period of indecisiveness, only more excessive.
- Dragonfly and Gravestone Doji Patterns.
Both dragonfly and gravestone dojis tend to generate more of a stir in the technical arena.
A dragonfly doji forms a narrow open and close range at the upper edge of the candle’s structure; a gravestone doji is the mirror opposite, establishing a tight open and close setting at the lower perimeter of a candle’s range.
- Location and Entry:
Where a doji forms is crucial.
The traditional doji helps traders determine trend change, following market advances and declines (northern and southern dojis). Additionally, traders have the option of waiting for subsequent candle action to authorise the doji’s position before committing.
A dragonfly doji is acknowledged as a bullish reversal pattern in oversold markets; a gravestone doji functions as a bearish signal in overbought conditions.
The aforementioned doji formations are also found at support and resistance levels, and often categorised as signals for confirming technical structure.

(Figure 1.B: Doji Patterns)
Hammer and Hanging Man
- Hammer Pattern.
Configured as a one-candle pattern, the hammer candlestick is identified following a decline, providing a bullish signal. Nison, in his book: Japanese Candlestick Charting Techniques, stated that in a downward market, a hammer signal is the market ‘hammering out a base’, essentially feeling for a bottom in price movement (figure 1.D).
The real body colour is irrelevant and should be accompanied by a lower shadow at least twice the size of the real body. Furthermore, it’s best if the pattern has little to no head (upper shadow).
- Hanging Man Pattern.
The hanging man candle formation takes on similar construction to the hammer pattern; the only difference is location: following an advance in price (figure 1.C).
Although an identical pattern delivering a bullish and bearish signal may appear odd, technicians familiar with western island tops and bottom patterns should see some similarity. The psychology behind the hanging man informs traders that although buyers drove price higher into the close, the initial sell-off implies interest to the downside is perhaps increasing.
- Location and Entry:
The hammer is considered a bullish reversal signal; therefore, it must form in a down move. Entry is typically two-three pips above the candle’s upper shadow and a protective stop-loss order is commonly positioned beneath the candle’s lower shadow.
The hanging man must form after an up move. Waiting for bearish confirmation after a hanging man is recommended: bearish close under the hanging man’s real body. Entry can be based on the confirmation candle, and protective stop-loss orders are generally placed above the hanging man’s upper shadow or neighbouring technical levels.
Shooting Star and Inverted Hammer Pattern
Similar to hanging man and hammer candle patterns, the shooting star and inverted hammer patterns offer one-candle configurations, recognised by their location.
- Shooting Star Pattern
A shooting star is a bearish configuration, formed through a real body located at the lower range of the candle and joined by an upper shadow at least twice the size of the real body. Note that its best to see little to no lower shadow.
The colour of the body is unconnected.
- Inverted Hammer Pattern
The only difference between the shooting star and inverted hammer is its position. The inverted hammer forms after a down move.
- Location and Entry
A shooting star forms following an advance and offers bearish reversal structure; the pattern can also provide confirmation of resistance. The inverted hammer pattern, on the other hand, takes shape after a decline, highlighting a bullish reversal and delivers support confirmation.
It’s important to note that just as a hanging man requires additional confirmation, so does the inverted hammer. The rationale behind the confirmation is although buyers did make a stand, it was not sufficient to form a positive close. Entry conditions for the shooting star are identical to the hammer pattern, only reversed.
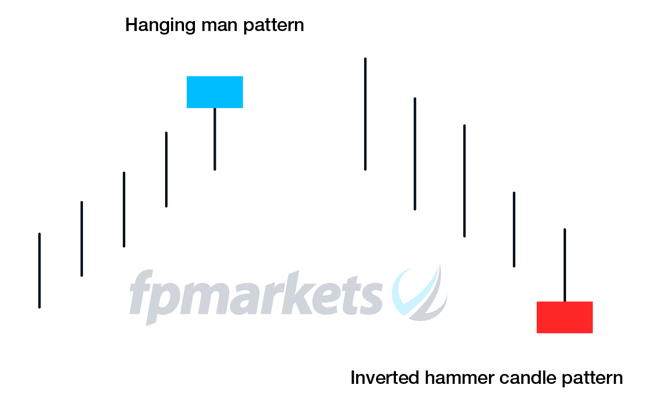
(Figure 1.C: Hanging Man and Inverted Hammer Pattern)
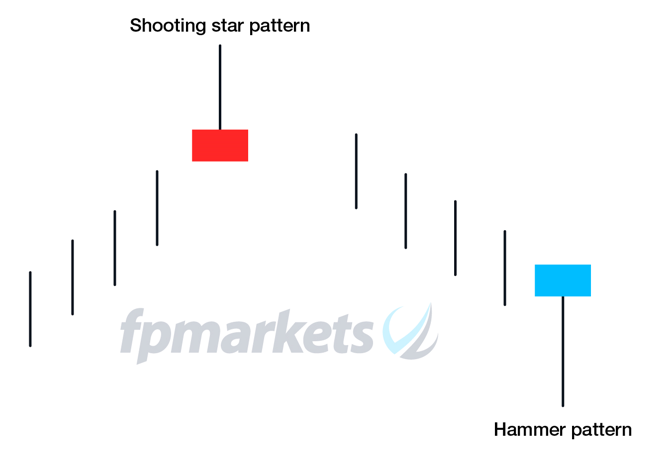
(Figure 1.D: Shooting Start and Hammer Pattern)
Engulfing Patterns
Shaped by a combination of two candles, bullish and bearish engulfing formations are reversal patterns.
- Bullish Engulfing Pattern
As reversal structure, a bullish engulfing pattern must form after a decline in market price.
The candle pattern is constructed by an initial red candle (first candle: bearish close), followed by a bullish real body (blue). The key observation with engulfing patterns are the real bodies. The preceding candle’s real body must be engulfed by the subsequent candle’s real body (figure 2.A). The second candle does not need to engulf the previous candle’s range (high and low).
- Bearish Engulfing Pattern
A bearish engulfing pattern is the opposite to a bullish version.
Instead of a preceding bearish candle, a bullish candle close is required that’s followed up by a larger bearish candle close that smothers the previous candle’s real body (figure 2.A).
- Location and Entry
What bullish and bearish engulfing patterns show are a shift in sentiment to the upside or downside. For this to be seen, a clear trend must be present. It is important to note that the preceding candle must be of opposite colour to its engulfing candle.
The western equivalent is the bullish and bearish outside reversal pattern. The difference is the outside formation takes into account the range. A bullish or bearish outside reversal covers the entire range of the preceding candle.
Entry is usually found by employing buy-stop entry orders (bullish engulfing) above the engulfing candle high, and sell-stop entry orders (bearish engulfing) below the engulfing candle’s low point. Protective stops tend to be positioned beyond opposite candle extremes.
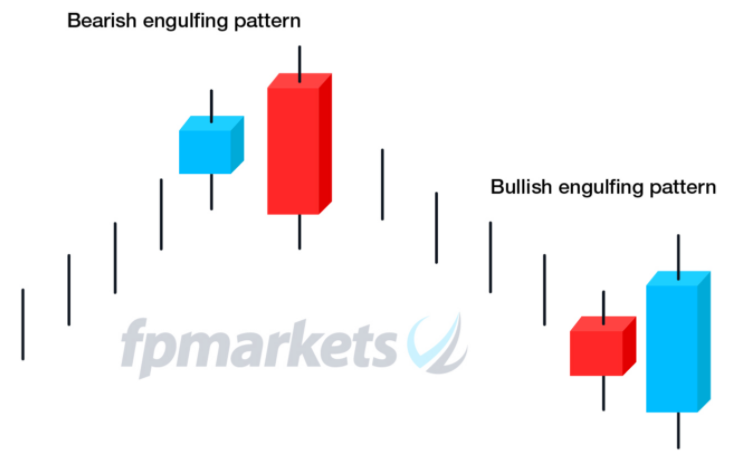
(Figure 2.A: Bullish and Bearish Engulfing Patterns)
Candlestick Patterns and Technical Analysis
Candlestick patterns are seldom traded in isolation. Combined with western technical analysis patterns, candlestick formations can help validate an area’s validity and forecast shift in sentiment. While this article focussed on reversal candle patterns, continuation forms exist, such as ‘Windows’ and ‘Rising and falling three methods’
It’s key to identify that not only do most Japanese candlestick patterns have western equivalents, candlestick analysis suits all trading styles (scalping, day trading, swing trading and position trading). A ‘Gap’ in western technical analysis is labelled ‘Window’ by its Japanese equivalent, for example. Bullish and bearish outside reversals, as underlined in the article, operate similarly to bullish and bearish engulfing candlestick patterns.
The principal difference between western and Japanese charting is the open and close: the latter generates a broader range to work with and is easier to interpret.
Common Reversal Patterns:
- Hammer and Hanging Man
- Shooting Star and Inverted Hammer
- Dark Cloud Cover and Piercing Line
- Bullish Harami; Bearish Harami (Crosses)
- Bullish Engulfing; Bearish Engulfing
- Evening Star; Morning Star
- Three White Soldiers
- Three Black Crows
Common Continuation Patterns:
- Rising and Falling Three Method
- On-Neck and In-Neck
- Windows (Gaps)


 Access +10,000 financial
instruments
Access +10,000 financial
instruments