
XJO WEEKLY
Price structure: Primary trend
The current retest of the 7200 level remains a positive for further gains with the weekly close remaining above this important level. A close below this level on a weekly basis will ensure further selling with the 6930 level coming back into play. However the primary movement remains UP with 7530 the current prime price target.
Indicator: Relative Strength 14
Relative Strength has closed and remained above the 50 level as part of the overall change in momentum. Price momentum has turned sideways a further movements over this key 50 level towards the 70 level would be very bullish.
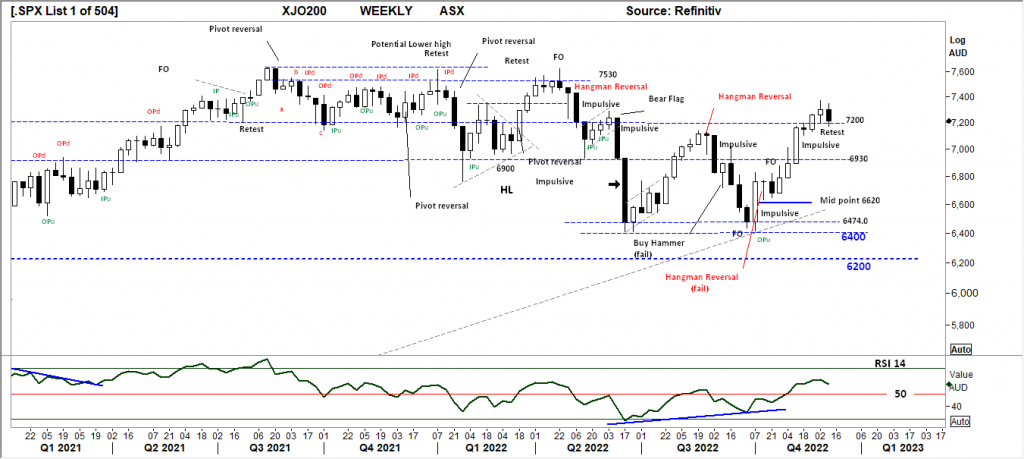
Comments from last week: Last week’s “spinning” candle with the low retesting the 7200 level, suggests the market is setting up for p[rice consolidation above the 7200 level. This level is a historical inflection point with the market finding both support and resistance at this level from Q2 2021. A closing price breakdown below the 7200 would target the 6930 level.
XJO DAILY
Price structure: Breakout
Last week’s commentary has set the scene for further gains in the Index value (positive sentiment) last Friday’s close has set a new 3 bar bullish reversal signal. The inside day set on Friday shows the market coming into balance, potentially before a new rise takes place. A daily close below the 7200 level would be a bearish signal. The Daily trend remains UP with 7437 as the primary target.
Indicator: Relative Strength 14
The Relative Strength Indicator (14) reflecting the underlying strong price momentum has moved lower from the 70-level indicating weakening momentum the turn lower should be monitored for further declines. Relative strength is moving in sync with the daily action of the market and does not offer a trading signal overall as momentum is currently shifting to the upside. Early momentum failure would be indicated with a closing price again below the 7130 level and a place to monitor for bearish divergence signal.
Indicator: VOLUME
Volume have remained static in line with historical average volumes. The low volume day last Friday is indicative of an inside day. High volume over 1Bil indicates fresh money flow and remains very supportive for further gains. Only DAILY volumes over 1Bil on a Daily basis would indicate strong new money buying.
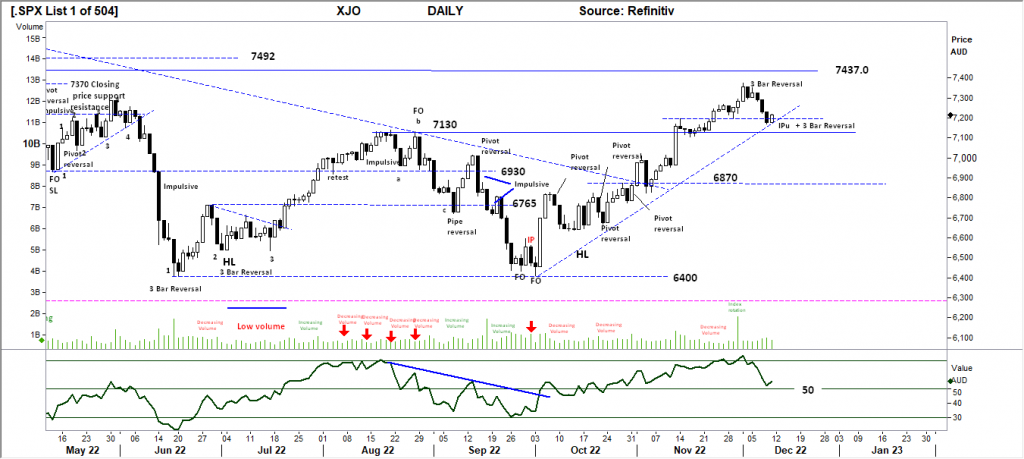
Comments from last week: Last Fridays’ inside down close bar may indicate the first of the potential price consolidation above the 7200 level, at best a retest of this level with closing price remaining above this important level would provide a bullish continuation pattern in the already established daily UP trend.
S&P 500 WEEKLY
Price structure:
The down trendline remains the key observation going forward this week, price action has not convincingly shown rejection at this point with the close of the week well off the low. The underlying Primary trend remains down, a breakout of the trendline would send a significant signal to the Bullish a further test of the 4200 level is underway. A significant short cover would ensue.\
Indicator: Relative Strength Indicator 14
Relative Strength has set a new higher low and has currently moved over the key 50 level (just) indicating positive momentum. To remain bullish the RSI should remain over the 50 level during this current price advance.
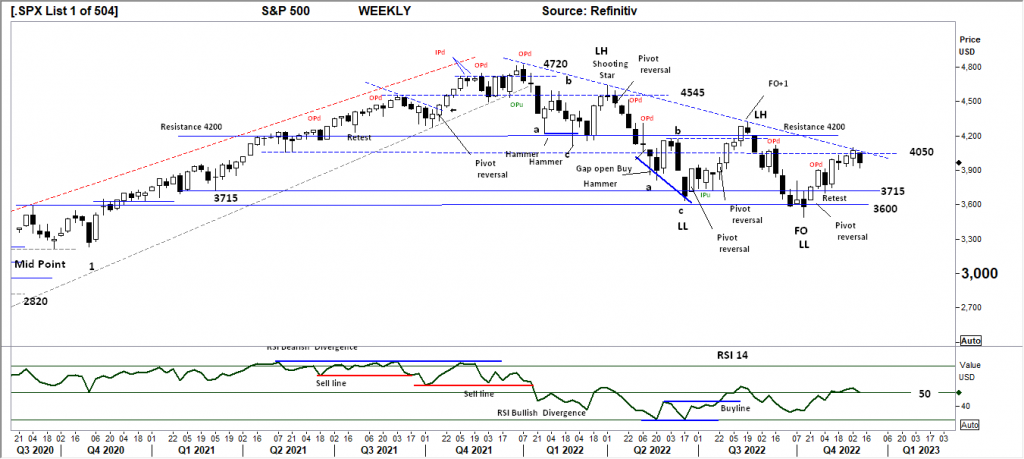
Comments from last week: The down trendline is the 2nd inflection point following the close over the 4050 level for this index. With the high close in the weekly bar against this down trendline a high momentum follow through should be expected, followed by some form of retest or consolidation. A weekly close below 4050 would send a bearish signal and may result in lower prices.
S&P 500 DAILY
Price structure:
The later week 3 small range bars are setting up a bearish flag pattern, the Daily 3940 level is the key line to cross to indicate a bearish signal. With the 3 spike highs in the back ground offers a key observation of a primary top in place, with the current price movement also below the 200 day moving average and the key 4028 level, this consolidation area will offer the trade direction with a breakout either side with 3940 the key support level and 4100 the key resistance level.
Indicator: Relative Strength 14
Relative Strength has moved to the 50 level, momentum remains in balance. Further price weakness for this index will see the RSI turn to move lower below the key 50 level and confirm the negative price momentum.
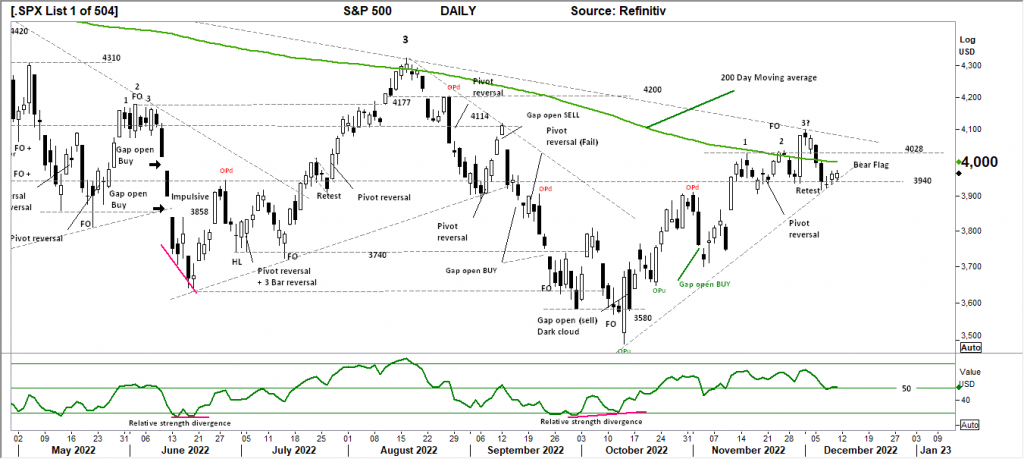
Comments from last week: The significant breakout over the 200 day simple moving average has the markets attention, the retest of the 4028 level is a solid signal of price support. The chart has 3 spike high points a close over last Wednesday’s high would be very bullish, until then consolidation above 4028 would be the best bullish outcome. The price gap at 4200 remains the primary target.
NASDAQ DAILY
Price structure: Base ready to break out
The Nasdaq daily chart also displays the 3 short bars set later last week. However, this group also contain a bullish pivot point. The Nasdaq has clearly set up a consolidation zone with 11500 as support and 12,000 as resistance. Breakouts from this type of consolidation are usually a very sharp directional movement, the support resistance levels with remain the key observation in the coming week.
Indicator: Relative Strength 14
The Relative Strength Indicator moving back above the 50 level but moving sideways in line with the current price decline back to retest the October high area around 11,500. RSI turning higher would indicate improving positive momentum.

Comments from last week: The current consolidation pattern in the Nasdaq Daily show 3 individual spike points as the impulsive range set the index to test the 12,000 level. Further advances should target the 12420 level as the Primary up trend continues to develop.
USD Spot GOLD – DAILY
Is it a Bull market? Yes
The $1804 resistance level remains in place with the retest last Friday following the OPd set earlier in the week. The overall picture for Gold remains very bullish within the current primary UP trend. Several resistance levels remain in place at $1834.0 and $1876.0. Current consolidation above $1770.0 remains a positive for sentiment.
Indicator: Relative Strength 14
The RSI moving above the 50 level and turning higher indicates a swing in momentum direction, a divergence signal is now in place as the market set a new closing high with the RSI setting a lower high. (Price consolidation would naturally see the RSI drift back too around the 50 level. A strong movement either way will show the next directional move.)
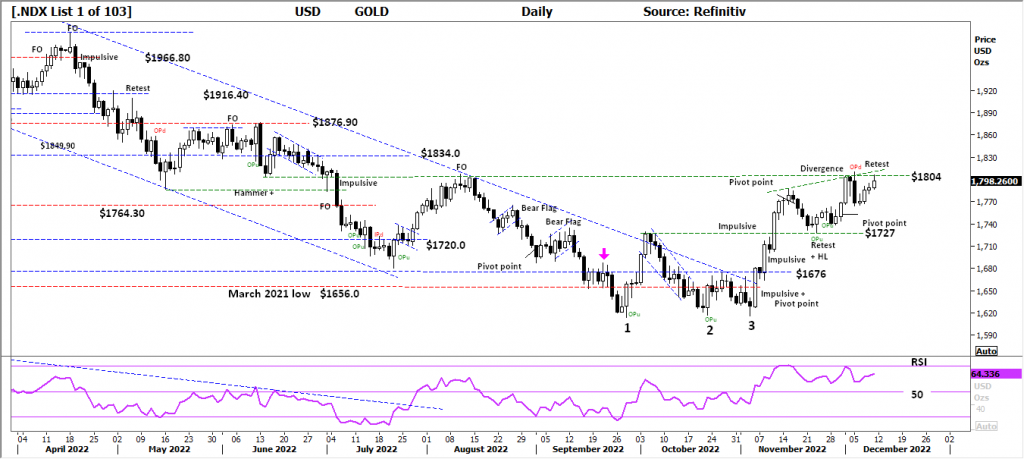
Comments from last week: $1804 an important resistance level and showing rejection last Friday, albeit with a high close in the range, suggesting momentum to the upside remains strong. The next significant resistance level of $1876 remains with current support indicated at $1727.
SILVER DAILY
Price structure: Bull market – Yes
The Daily chart of silver is setting up a bearish reversal pattern with last Fridays Fake out (FO) setting up the potential for a sharp reversal to retest the $22.50 level. Overall the Primary trend remains up, with an early stage developing consolidation pattern being confirmed with a daily close below the $23.25 level.
Relative Strength 14
Current Relative Strength is rising sharply however the current movement ticking higher again towards the 70-level, RSI turning higher reflects the underlying momentum again increasing and remaining positive, an unconfirmed divergence signal is developing. A continuing move above the 70 level and higher would be very bullish signal in the short term.

Comments from last week: Along with Gold, Silver also meets a resistance point in this case $23.25 following three very strong bars from the $20.80 support level. Primary trend is UP, a continuing trend will target the $26.20 level. Support remains at $22.50 should price retrace, a break lower of this level would be very bearish.
AUD GOLD DAILY
Price structure: Consolidation remains
With Australian dollar strength come a weaker gold price in AUD$ terms, the daily chart indicates the continuing pennant development with $2676 remaining as resistance and the $2580 level as support. This current levels remain a positive for local producers and well ahead of the current $1100.0 average cost of production. The overall chart structure remains more bullish than bearish an d should provide strong positive sentiment for local producers.
Indicator Relative Strength 14
Relative Strength has turned higher in line with the price action following the rise from below the 50 level. Overall, momentum has now turned higher. A continued movement above the 50 level would be a strong positive for further price gains.
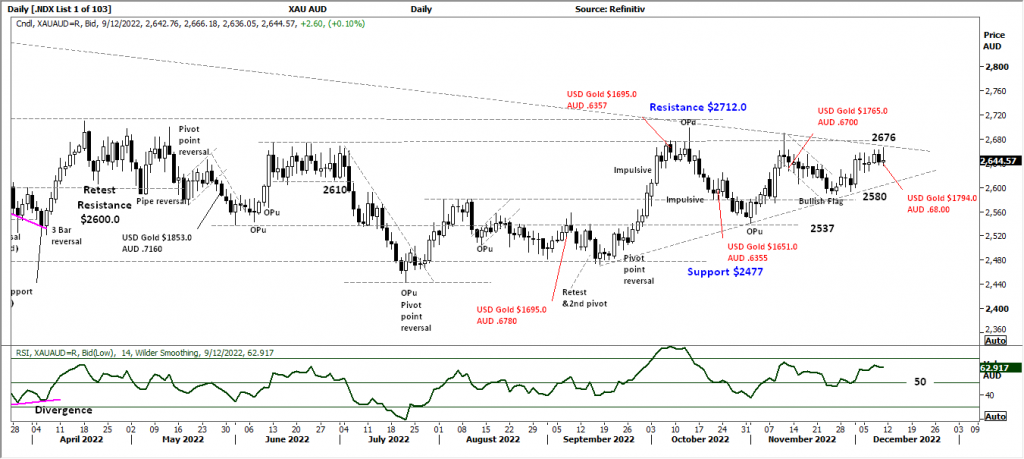
Comments from last week: The developing pennant at the end of a very long consolidation range is now a Bullish development for further gains following support at $2580 holding the recent decline. This is a very strong positive for Australian Gold producers to follow higher.
DAILY COPPER
Price structure: Potential breakout.
The Hangman weekly bar for copper indicates again the market in balance, buy importantly above the $3.80 level and cautiously below the $4.0 level. A breakout over $4.0 would be very bullish for further gains. The key observation in this chart is the impulsive price movement bars showing bullish intent closing at the high of the range.
Indicator: Relative Strength 14
Current reading has swung from below the 50-level to again turn higher as downward momentum has stopped , however the current reading should remain above the key 50 level to indicate strong momentum. The key now, is for the RSI to swung back towards the 70 level as a reflection of ongoing price gain momentum.
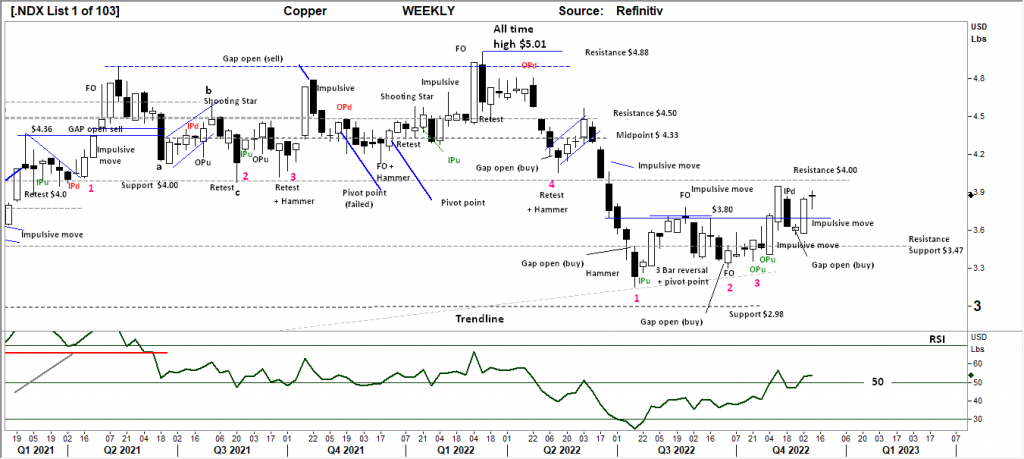
Comments from last week: Following the “gap open buy” discussed last week, copper has put in an impulsive move higher setting a higher low above the $3.47 level, a further breakout over the $4.0 level would be very bullish for further gains back into the consolidation area below the $4.88 high.
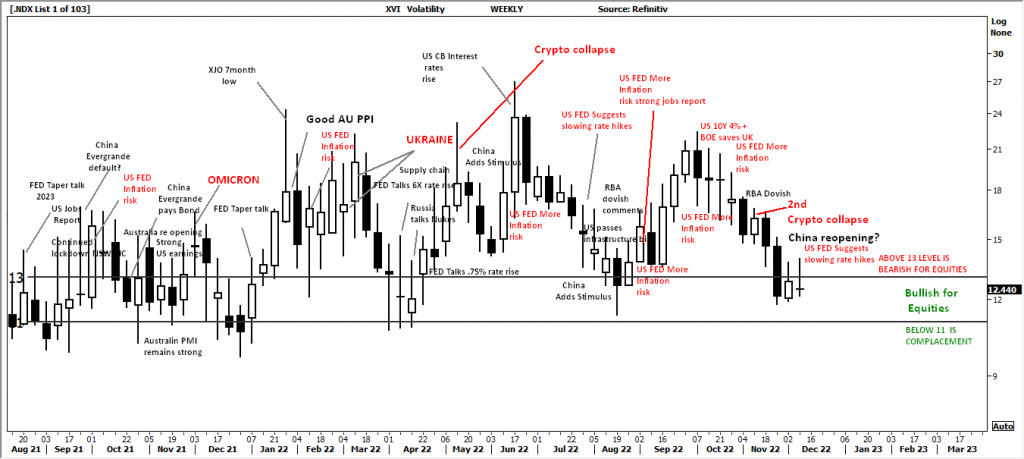
AUSTRALIAN VOLATILITY INDEX
Volatility reading has moved higher last week and retraced and now continues to remain below the 13-level indicating forward pricing of PUT options is weaker. This is very good for equities during this week.
In general, lower to consolidating commodities prices and equity prices or consolidation of equity prices is indicated as the reading remains above the 13 level.
For continued support of equities, the XVI should move below the “13” level.
The cost of 3month forward PUT options is decreasing from recent elevated levels.
The XVI is the difference between 3-month forward pricing of ETO Options against current month.
As markets anticipate events, the forward priced option volatility changes, hence as forward price changes, this “skew” in pricing is measured in this XVI.
The XVI value works as an inverse observation to the underlying market.
USD DOLLAR INDEX
Price structure: Setting a lower low
The US continues the downward trend with the retest of the 104 level complete. Current price action indicates a consolidation area is beginning to build below the 105.80 resistance and above the 104.0 support level, a breakout either way will give some short term direction.
Indicator: Relative Strength 14
The Relative Strength has turned lower in line with price movements indicating further consolidation as the current reading is now at the 30 level. This will move lower to sideways should price decline, only a continued reading back above 30 and then the 50 level would indicate a change price momentum.

Comments from last week: A Primary down trend is now developing in the DXY with the 104 level now being targeted. A break of this important level would be a further positive for precious metals and commodities and associated stocks.
WTI – CRUDE OIL
Price structure: Full Bull Market has failed.This commodity is highly news driven around supply -demand.
Last week saw the breakdown below the important $75.20 level with a very strong directional range towards the $66.00 level and back into the Q3 and Q4 2021 consolidation area. The Primary trend for WTI is now down.
Indicator: Relative Strength 14
The RSI turning below the 50 level is a result of upward momentum slowing, recent price reversal has resulted in a sharp movement below the key level of 50 signalling decreasing price momentum. The indicator moving below the 30 level would now be monitored for a bullish divergence signal.
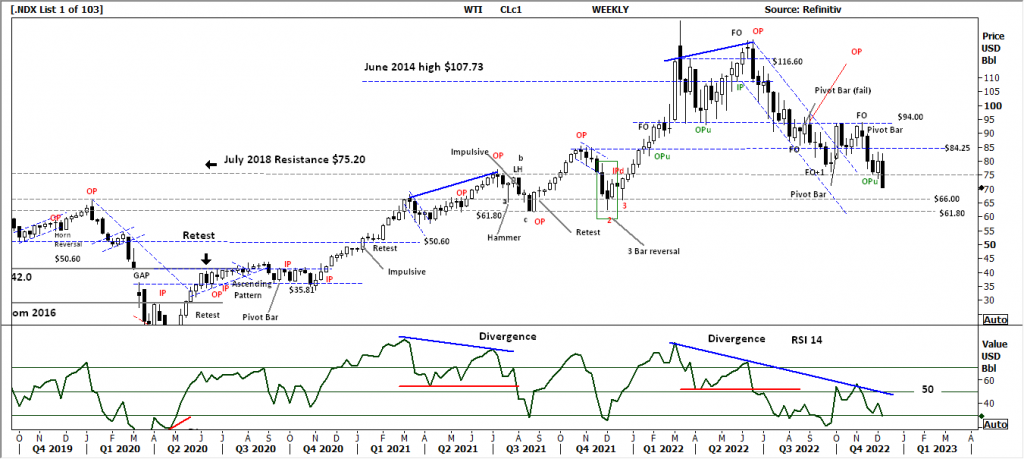
Comments from last week: Oil tests the $75.20 level and enters a Primary down trend, the current OPu is a short-term bullish signal, traders would look for a retest of the $94.0 level resulting in further consolidation along the $75.20 support level and $94.0 resistance level.


 Access +10,000 financial
instruments
Access +10,000 financial
instruments