
Both Australian and US markets finished another tearaway week, with the DOW30 closing over 30,000 and the S&P 500 closing one point short of a record 3700.
Commentary is growing more vocal warning of a top in the markets, looking at Tesla with a PE ratio of 1,186 it’s not difficult to believe markets have lost the grip on reality.
However this is the reality and traders must work with this reality.
Commodities continue to drive the business end of the XJO higher, backed up with solid gains in underlying prices of Iron Ore, Copper and Oil.
Forward Volatility levels continue to decline, this is now underpinning current gains in the equities markets.
XJO WEEKLY
Price structure:
Last week continued the consolidation in the Index price, behind the scenes individual sectors have outperformed the example is Commodities stocks BHP FMG RIO. The current Weekly #3 type candle has a lower shadow/wick, on a Weekly timeframe this indicates selling into a rising market, the first signal of a potential distribution top. This may not be a trend changing event, simply an indication of further consolidation in the short term.
Indicator: Relative Strength
The RSI indicator has remained over the key 50 level, however now showing a slowing advance as the indicator rolls further sideways. But remains a very good signal of Weekly improving price momentum.
Indicator: MACD
MACD remains a swing “Sell” signal again this week and has continued in developing a sideways movement, only reflecting the slowing momentum. The completed full cross over becomes the Sell signal. It should be acknowledged this indicator is very slow to react on a weekly basis and may continue to track sideways in the coming weeks as it did during 2019.

Comments from last week: The Breakout above 6430 two weeks ago is losing momentum as the closing price last week settled in the lower part of the range and well short of the higher resistance level of 6740. The Index remains in a Primary UP trend.
XJO DAILY
Price structure:
Last Monday saw heavy selling only to see a strong recovery on Tuesday and without further real conviction in the short range bars of Thursday and Friday. The current array of Daily price candles is Bearish. To overcome a sentiment change in the short term a closing price over the Pivot reversal high of 6713 set 2 weeks ago in required. Current support level of 6500 point is the level to hold on any decline in the short term.
Indicator: Relative Strength
Relative Strength continues to develop a potential Bearish Divergence signal, traders would monitor the price making new highs without the RSI setting new highs.
Indicator: VOLUME
During the September October period volumes on down days increased and decreased on UP days showing a lack of interest for any accumulation. The pattern has reversed with an increase of volumes on UP days and lower volumes on down days, this observation suggests accumulation on a fear of missing out (FOMO). This type of pattern is ultimately very supportive of further gains ahead.
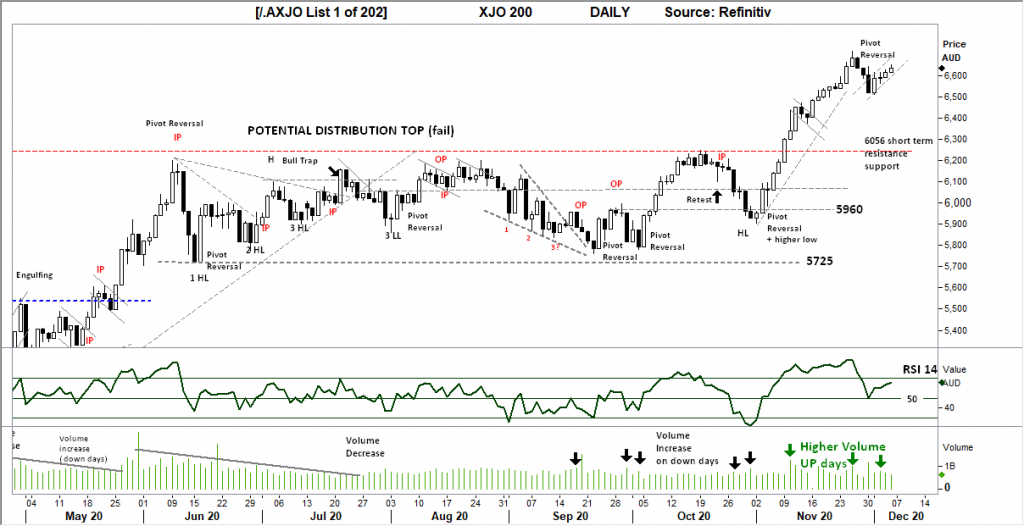
Comments from last week: From the 5900 point lows made in early November the Index has made a significant advance with only a short two day consolidation mid-month. Last week the Thursday / Friday rejection of higher prices as resolved into a reversal pivot point. While price momentum remains to the up side any retracement is likely to be shallow and would present a buying opportunity.
S&P 500 WEEKLY
Price structure:
Last week closing on the high sets a very bullish continuation pattern, there is no resistance ahead to use as a gauge of market strength. This is a time of caution. The Primary trend remains UP, however a sentiment change may see a significant ( read fast) retest of lower levels around 3400. Using the 20 period simple moving average it could be considered a mean reversion move may be ahead as price remains some distance from the indicator.
Indicator: Relative Strength Indicator
Relative Strength remains above the key 50 level and currently is a good signal of continuing price momentum, a move below 50 would have signalled very week momentum. The upturn now needs to continue to move towards the 70 level as a signal of strong momentum. It should be acknowledged the RSI has remained above the 50 level for the past 5 months.

Comments from last week: The inside range of 2 weeks ago has resolved into a new push higher to see the index close at a record high of 3638 points. Last week showed a good open to close range compared to the previous 2 weeks, with the close towards the high. As the Primary UP trend remains in place, further gains would be expected in the coming week. The Mid point support of 3400 remains in place as the potential retest level should the market find sellers in the coming weeks.
S&P 500 DAILY
Price structure:
Last Monday displayed a very quick retest of the 3580 level before the GAP higher on Tuesday. With the close at the high of the week continuation would be expected in the coming week. An extrapolation of the trading range from August to November would ultimately target 4000 points. It is never a straight line, however the Daily and Weekly chart structure remain very Bullish in the bigger picture. This market is being driven higher on Vaccine news and the expectation of further GDP growth. This type of sentiment can change very quickly.
Indicator: Relative Strength
Relative Strength has turned higher, within the structure of the RSI there remains the potential for a Bearish divergence signal to develop, this would occur should the RSI high of early November not be breached on further price gains. This should be monitored for a movement below the key 50 level as a loss of upward momentum would be underway.

Comments from last week: The shortened trading week on lighter volumes has shown the market is willing to hold these record high levels. The current Daily Bull flag breakout and consolidation above 3850 remains a signal of buyer control.
USD Spot GOLD – WEEKLY
Price structure:
The Gold price has continued to respect the resistance level of $1855, and Gold remains within a Primary down trend. Continued resistance at this level may see further selling enter the market with a retest of the long term trend-line possible, circa $1650. Should the market set a new close over the $1855.0 level in the coming week a Bullish pivot would be in play potentially bringing in further buying. This would take a news event for a catalyst.
Indicator: Relative Strength
Relative Strength turns higher and remains below the “50” level. The overall declining of the RSI over the past 9 weeks continues as a bearish signal.

Comments from last week: Gold has entered a Primary Down trend with the price move below (a), the overall decline is currently 13%. Although a confirmed a.b.c correction is now underway as part of the larger Primary UP trend, it cannot be discounted that a top for Gold is now in. The large range bar last week suggests further weakness in the coming week, with a breakdown below $1764 possible. Further price weakness may see the trend-line tested at around $1700.0
AUD GOLD DAILY
Price structure:
Initially a good pivot point recovery in the AUDXAU daily chart, but no follow through. Further gains would see resistance set at $2537.0 and $2610.0. Australian Gold producers will remain under pressure until the US Gold shows a bullish move or the $AUD declines relative to the $USD. In the current market neither likely to occur in the short term. The Chart remains in a Primary Down trend. Smaller Gold plays remain dependant on news flow and drilling results.
Indicator: Relative Strength
With the RSI turning lower below the key 50 level showing a complete loss of upside momentum. With the current reading below the 30 level, traders would monitor this indicator for a Bullish divergence signal in the coming days. This indicator has swung around the 50 level since August. This momentum indicator needs a continued swing higher in line with any price gains to confirm a valid buy signal.
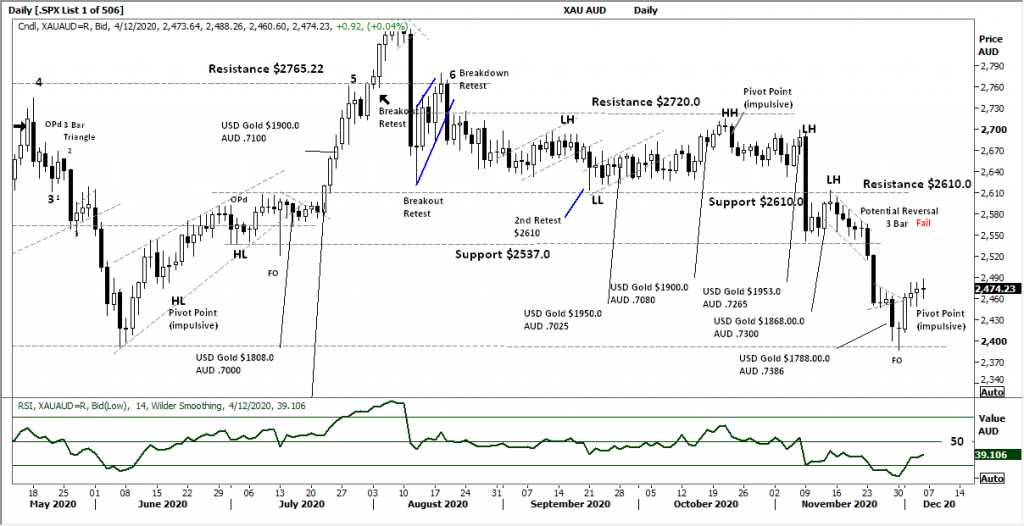
Comments from last week: The price breakdown from $2537.0 has lead to an extensive decline in price to test the $2400 level within this current price down trend. Although the final close remains off the low, the range of Fridays bar is extended and may see further selling on continued weakness in the USD Gold price. Both the USD Gold price and the AUD Gold price have undermined the Australian Gold producers NCM, NST and EVN.
SILVER DAILY
Price structure:
Silver Daily displays a Pivot point reversal without follow through as remains within a 3 month trading range with resistance shown at $26.40. These types of consolidation often leads to volatile directional breakouts, with weakness in the Precious Metals sector, that breakout may be lower as accumulation buyers along the $22.50 support level face stop loss events.
Indicator: Relative Strength
With RSI now moving below the 50 level as last week’s consolidation breakdown develops into a Primary down trend, a further loss of momentum should be expected.
Indicator: MACD
The MACD has provided a swing Sell signal and should be monitored as a sell signal. With the MACD now moving sideways this should be monitored for a confirmation buy signal with any confirmed upswing in price.
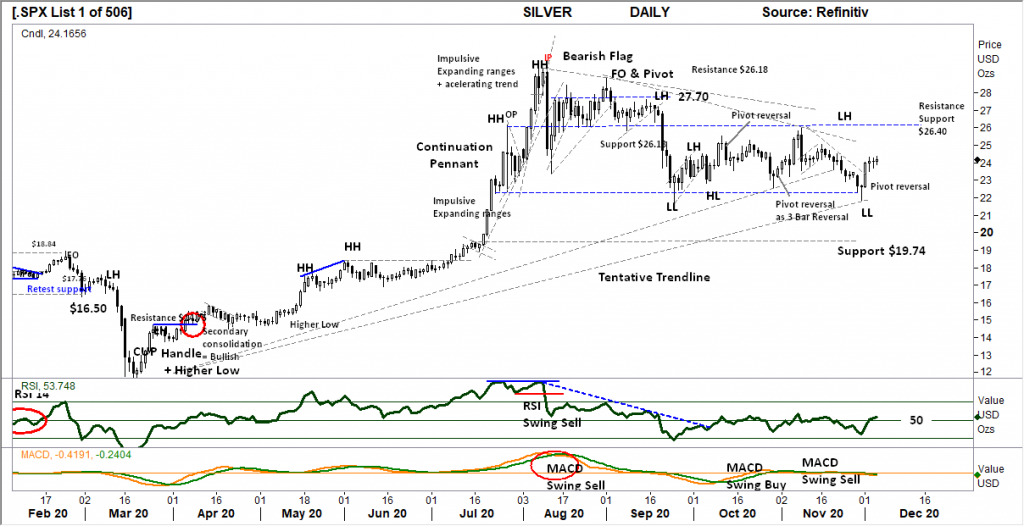
Comments from last week: Another Trend line broken during the past week and a new lower low (LL). As with the Gold chart support levels, the breakdown level of silver shown at $19.74 would be the further downside target on continued price weakness. Without a price reversal signal the Daily down trend in Silver can be seen with the accelerating down trend lines.
COPPER DAILY
Price structure: Inventories under pressure.
Copper faces potential shortages within the LME inventory system. With demand growing in the Electric Vehicle sector and GDP growth within China, the underlying Copper price is making an exponential price move through old resistance levels. The whole move remains corrective (no trend points) and has the potential to retest the historical resistance level of $3.80.
Indicator: Relative Strength
Relative Strength has moved over the 70 level again underlying the strong momentum move underway. An early BEARISH divergence signal has failed, this will still be monitored in the coming week. Further confirmation will be shown if price moves below last week’s low around $3.40 and the RSI moves lower inline.

Comments from last week: The Weekly price of Copper has seen a good follow through from the test of resistance at $3.30. Last week’s large range price bar is a good signal for further gains in the short term. The next key resistance level is now $3.47 as this significant corrective up swing takes place.
AUSTRALIAN VOLATILITY INDEX
Volatility levels are returning to a level consistently BULLISH for equities as the forward price for risk cover declines. The current level can be seen as the initial breakout level from the COVID-19 pandemic alert. With the past week dipping below the important “13” level, this remains very supportive of further equities market gains.
The XVI is the difference of 1-month forward pricing of ETO Options against current month.
As markets anticipate events, the forward priced option volatility changes, hence as forward price changes, this “skew” in pricing is measured in this XVI.
The XVI value works as an inverse observation to the underlying market.

Comments from last week: The ASX closed on Monday due to a technical error it seems the resulting outcome from the ASX mispricing some ETO combination orders has affected the XVI value with a significant spike lower. However what is important is the closing value now below 20 and approaching level where Equities get very bullish as Risk protection is reduced.
USD DOLLAR INDEX
Price structure:
The USD Index remains in a Primary downtrend, the breakdown below 92.10 remains untested as the Index value grinds lower. This week saw the 90.7 level tested as the support level from 2018. The ultimate result is pressure in Gold pricing along with a rally is associated currencies $AUD, $EUR, JPY
Indicator: Relative Strength
A complete breakdown of the Relative strength to move below the “30” level, the current swing lower is a significant implication for further price weakness. What was a bearish outside period (OPu) followed by the impulsive signal , the RSI continues confirmation of further price weakness as the indicator turn lower.

Comments from last week: The USD Index is testing lows from early September and the support level from 2nd Quarter 2018 following the break of 92.10 identified last week as the level to hold. The USD price is influenced by many factors including perception of rising yields and the underlying strength in other currencies in particular the Euro dollar.
WTI CRUDE OIL
Price structure: This commodity is news driven by supply -demand.
Although the Oil price closed towards the high of the Week, the lower shadow developed earlier in the Week remains a Bearish signal for the coming 2 weeks. WTI has entered a primary UP trend, however any price weakness should be monitored to see the $42.00 support level hold.
Indicator: Relative Strength
RSI turning higher over the 50 level remains in a very good place for further momentum price gains, but can be seen “rolling” over below the 70 level is signal of slowing momentum.
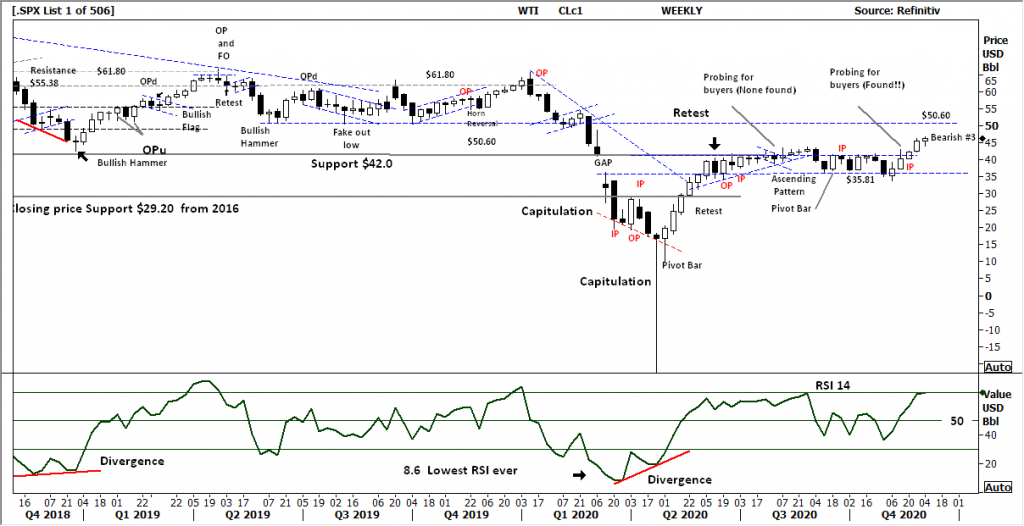
Comments from last week: This is significant! A solid closing price above the $42.0 resistance level that has been in place for over 2 years. With last weeks close over the July highs, West Texas Intermediate has entered into a Primary UP trend. This may bring in further buying as short positions are closed and speculative buying takes place. Next key resistance level is $50.60, WTI remains on track to test this level.


 Access +10,000 financial
instruments
Access +10,000 financial
instruments