
US market put in a solid week of gains with further gains expected this coming week. With the US elections now coming into focus, expect an increase in daily price volatility.
The Nasdaq and the S&P 500 are being lifted by Tech stocks with other “Industrials” within the index are still languishing below early 2020 highs. This observation is of significant importance to the longer term trader as an improvement in this section of the market could push US indices’ further higher.
Gold and Silver continue to consolidate with some Bullish continuation patterns developing, weakness in the US Dollar index has shown up with the $AUD trading over .7350 putting pressure on commodity stocks including local Gold and Silver equities.
WTI West Texas Intermediate = Dull. But one to watch as this low volatility environment may change into a high volatility breakout in Energy stocks in the coming months.
XJO WEEKLY
Price structure:
Further consolidation below resistance again last week, this secondary market development will lead to a volatile breakout. Last week’s low closing price within the lower part of the range, only suggests further short-term weakness in price within this consolidation zone. Traders should keep in mind the Markets adage, “low volatility leads to high volatility”.
Indicator: Relative Strength
Relative Strength, again this week 13 in the consolidation phase, momentum has moved sideways, the only positive to see here is it still remains above the key 50 level. Further consolidation in the price chart may this this dip below the key 50 level.
Indicator: MACD
MACD remains a swing “buy” signal, This week has continues with a “slight” dip in the fast line, only reflecting the slowing momentum.
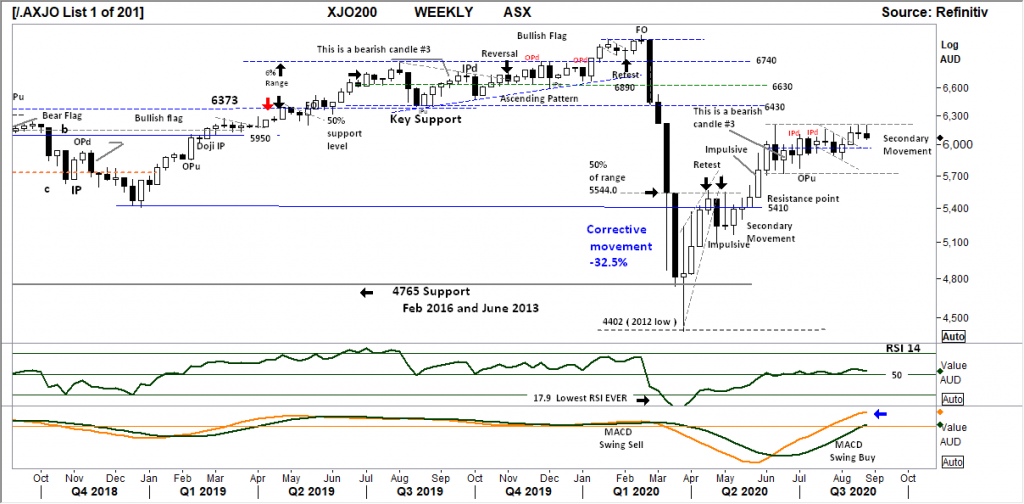
Comments from last week: Further consolidation in the XJO as reporting season continues. Index value remains within the consolidation range and remains in a “secondary consolidation” phase. Current price range high ( 6196 ) has again tested the high boundary (6200). The small range for the week suggests further consolidation. Without a major catalyst as a driver price ranges will remain bound.
XJO DAILY
Price structure:
The daily chart shows the small 40 point range of consolidation over the past 14 trading days (3 weeks). It should be noted the daily ranges are relatively small including the days where the market closed lower than the open.
Indicator: Relative Strength
RSI has turned lower again in line with the chart price movement a signal for further momentum losses as the indicator moves below the key 50 level, and is at risk of falling below the key 30 level.
Indicator: VOLUME
Volumes continue increase on the “down” days, this is of concern as it suggests distribution not accumulation. Significant volume increases need to show on the up days to confirm the longer term bullish view.
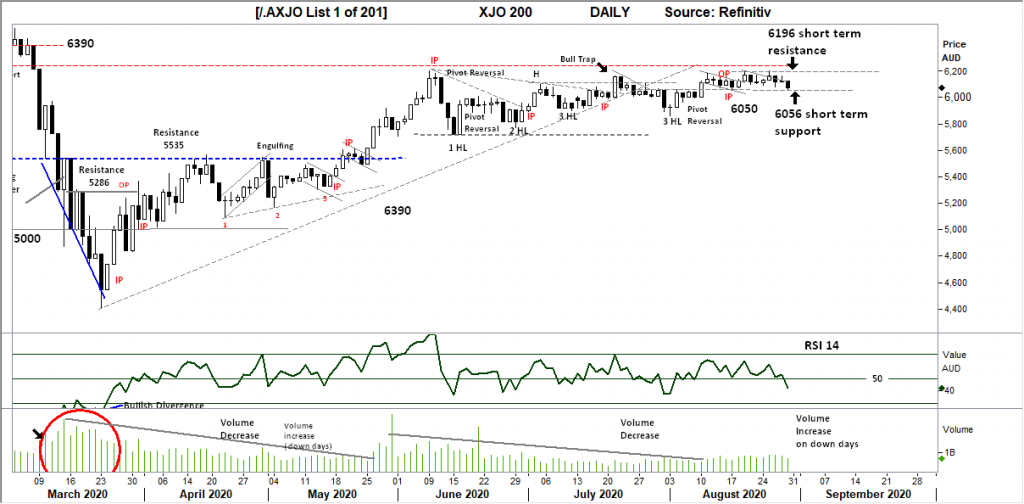
Comments from last week: Lack of daily direction, a closer look shows the past 3 months in an ascending pattern. This market remains without a catalyst, with the reporting season not having an impact overall. Suggesting the XJO follows the US markets remains a false statement, but this market will react should the US markets move to a decline.
S&P 500 WEEKLY
Price structure:
The S&P 500 has shown a significant breakout bar into a new high, with the closing of the week at the high and the Weekly range being larger than the previous weeks, further gains are expected. This Primary UP trend remains intact. A potential “retest” of the breakout is always possible, this would be the first level of support on any retracement of price in the coming week.
Indicator: Relative Strength Indicator
Relative Strength turning higher is a good signal for further gains, the RSI needs to remain above the key 50 level and extremely positive and has room to continue the accelerating rise as current momentum remains very positive. A move below this 50 level is a signal of bearish momentum.

Comments from last week:Last week pushing higher again, the past 2 weeks bars have lower shadows, this is a bearish signal for the next 2 weeks. At best further consolidation at these level is important. BUT traders should keep in mind 5 S&P stocks now make up the greatest valuation skew ever seen in markets. The 3385 February closing high will be the key level in the coming week, the relative strength (comments below) suggest further gains.
S&P 500 DAILY
Price structure:
Traders are continually looking for a Bear market move in the short term to signal a high in place. This current Daily chart does not display any type of reversal signal. The short term (2 touch) trend line would be the first sign should price move below this level.
Of interest is the overnight futures (Asian session) of the Futures market also continues to show very bullish price action around these historically high 3500 levels.
Let price show any potential market top, not your twitter feed.
Indicator: Relative Strength
RSI signal line has rolled higher and now displays failure of the bearish divergence signal developed over the past 3 weeks. As it indicates very strong price momentum while over the “70” level, it would only take some small period of consolidation for this momentum indicator to roll lower.

Comments from last week: Daily price ranges remain “thin” showing a lack of commitment by both the buyers and the sellers. This market remains in daily consolidation at these levels. Overall the Primary trend remains UP. Trader should again keep in mind this type of low volatility consolidation will lead to a high volatility move.
USD Spot GOLD – WEEKLY
Price structure:
The underlying price structure remains in a Primary UP trend.
The whole world still wants to be “long” Gold, until they don’t.
The Weekly chart of Gold is now developing some very good support levels to be monitored in the coming weeks. Closing price support at $1939.65 being the most important. And $2015.0 the first resistance level on any price breakout higher.
Last week price range is shorter than the previous week, confirming this consolidation pattern.
There is the “pennant” forming, with a retest of the $2072.50 high possible on any breakout move.
The statistical outcome table below should be a reminder this Bull run may be over for some time.
Indicator: Relative Strength
Relative Strength remains strong but has now turned sharply lower to move below “70”, this can be monitored to remain above the “50” level, as the instrument finds consolidation. Further selling below last weeks low may see a complete loss of positive momentum.
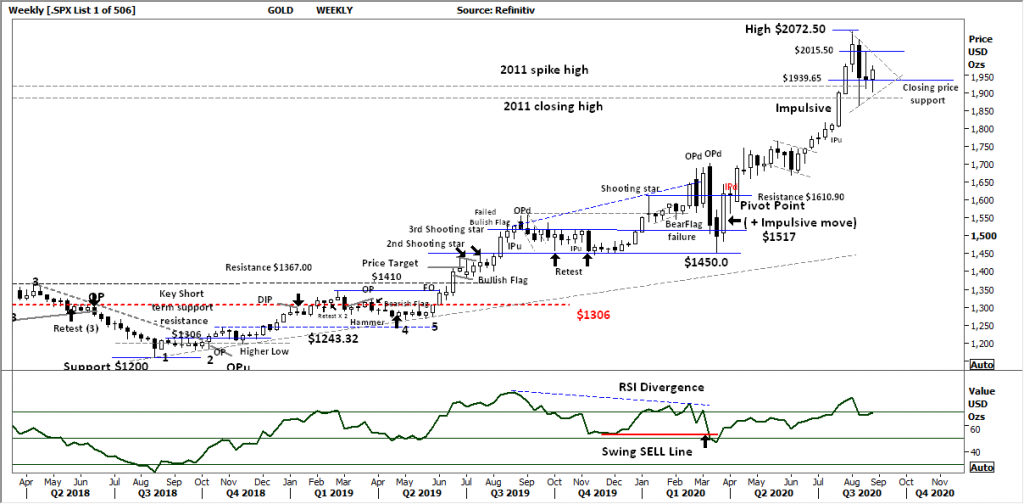
Comments from last week: The Weekly chart of Gold has reached and closed at an important level of support ($1939.65) shown as the midpoint of the rising bar 4 weeks ago. With the week closing in the lower part of the range sets up a bearish week ahead for the metal. The view remains a retest of the breakout point around $1750 – $1800 is consistent with price theory. A price move lower will test the weak holders and may add to further margin selling.
AUD GOLD DAILY
Price structure:
This Daily chart shows the Bear flag breakdown from the retest (6). This price pattern has the potential to breakdown further to retest the $2650 level in coming days.
This will continue to place price pressure on Australian producer Gold plays.
Should the market move below the key $2650 level the XAUAUD gold price will enter a primary down trend. Traders would monitor continued strength in the Australian dollar to give an early warning of weakness in this price chart.
Indicator: Relative Strength
With the RSI now falling, the crossover of the 50 level is a bad sign upward momentum maybe at an end in the short term. The flag breakdown would see this indicator move further below 50 showing bearish price momentum.
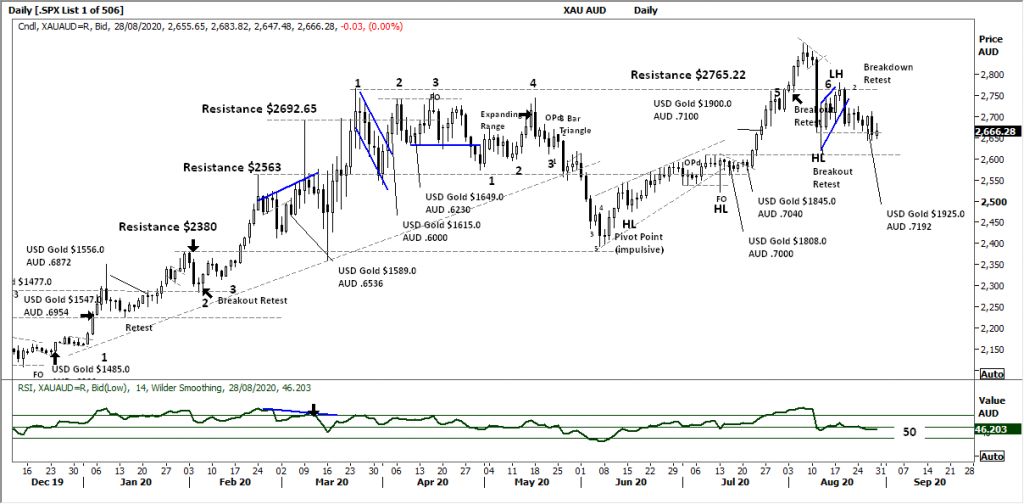
Comments from last week: The bearish flag breakdown (see last weeks note below) is playing out as the AUD remains strong and USD Gold prices decline. This will continue to have implications for listed Gold producers with a potential risk off event coming. Should AUD Gold move below the marked “ breakout retest” level the market will be defined as a bear market.
SILVER DAILY
Price structure:
Daily Sliver has developed some important support at $26.18 and resistance at $27.55 levels to be monitored in the coming days.
This type of secondary market consolidation can be in play for many months following the volatile decline from the recent closing price high of $29.41 as both the buyers and sellers consider the safety or risk of their positions.
Indicator: Relative Strength
The divergence signal from 3 weeks ago has played out in the current price decline. With RSI now below “70” but remaining above “50” the bearish flag and current Bullish flag may simply develop into further consolidation pattern.
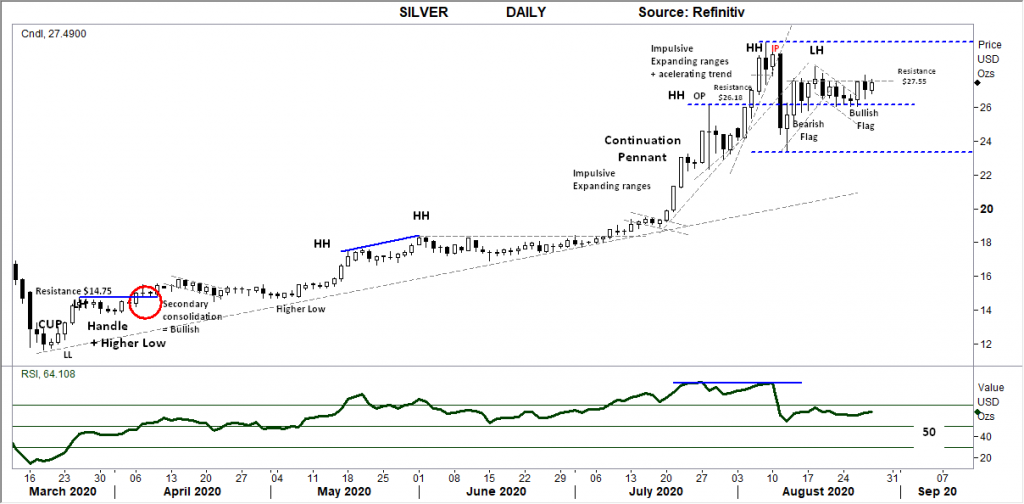
Comments from last week: The daily Silver chart shows an initial Bear Flag break-down, however support can be seen developing at $26.20. this level should now be monitored for further support. A further breakdown in line with Gold has the long term trend line targeted at $22.00. This would put Silver into a Primary down trend. A best further consolidation could be expected.
COPPER DAILY
Price structure:
Probably the most important chart in the world at present for the equity trader interested in commodity producers stocks based around the current Global growth story and more defined in China as the government provides industry stimulus. China now has a substantial “internal” market driving the demand for this material. The Weekly chart highlights the breakout and rejection (FO) from the $2.98 level 2 weeks ago, last week saw an inside period (IP) but with a closing price above resistance, a very good sign of further gains to come. The next significant resistance level is $3.20, and is currently in play.
Indicator: Relative Strength
Relative Strength has moved strongly over the 50 level in the past 12 weeks. The current levels only reflect the current strong upward price momentum.
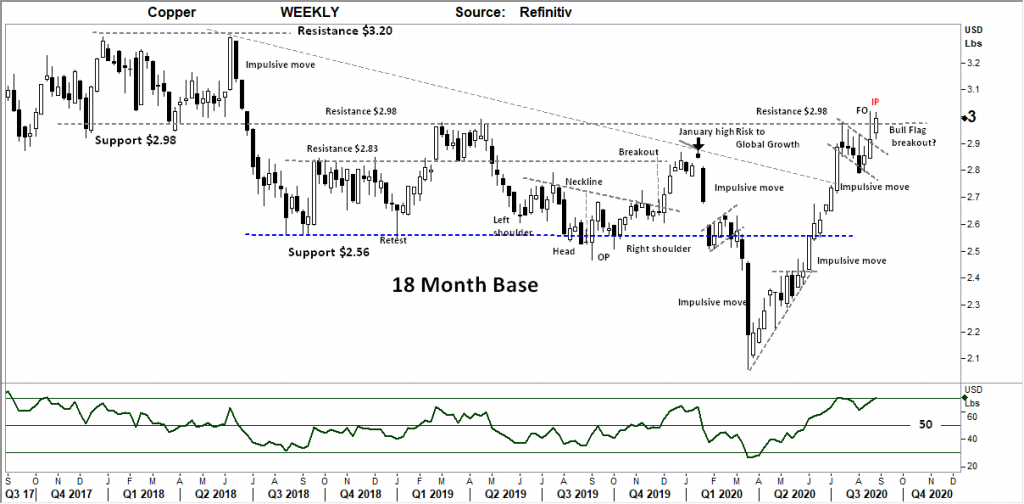
Comments from last week: The copper chart has made some interesting developments in the past Week with a bullish flag breakout to retest the long term support resistance level at $2.98 – $3.00. A reflection of an increase in China manufacturing and slow reopening of global growth this early indicator should be monitored for further gains. The Weekly “rejection” (FO) is not a great sign of immediate gains coming but has been an important development in price structure.
AUSTRALIAN VOLATILITY INDEX
Australian volatility is declining, albeit slowly. Last weeks inside range with a close lower than the open is a good signal for further declines. But this indicator is news and event driven. Long term equity traders looking for the breakout in the Major Australian indices’ should be aware this XVI indicator needs to move lower in the coming weeks to give the Bulls the buying edge.
The XVI is the difference of 1-month forward pricing of ETO Options against current month.
As markets anticipate events, the forward priced option volatility changes, hence as forward price changes, this “skew” in pricing is measured in this XVI.
The XVI value works as an inverse observation to the underlying market.

Comments from last week: In the background market commentary there remains an overall concern of stalling Global growth and indeed local Australian GDP may become a discussion subject, this is again being reflected in the XVI, along with extreme company valuations. This current rise in the XVI should not be ignored as a potential precursor to a volatility event within the equity markets.
USD DOLLAR INDEX
Price structure:
Friday impulsive move lower to retest the 92.10 level highlights this is the most critical level to monitor in the coming days.
A further breakdown will have implications for the FX markets and Gold and Silver in $USD.
The key observation on this Daily chart is the lower high now in place below the 93.75 level.
A price break below the 92.10 would be a significant development in this market.
Indicator: Relative Strength
RSI Bullish divergence has eventually played out and failed with the RSI value with the indicator now moving towards the key 30 level.

Comments from last week: Last week midweek the DXY set a Fake out move lower and completed as a bullish “pipe reversal” with a further retest of the 93.75 level. The DXY remains in a secondary consolidation phase until either the higher level at 93.75 or lower level at 92.10 is broken decisively. The June – July period displayed a similar pattern prior to the current breakdown. However further gains would see the AUD trade lower providing support for the AU listed Goldies and Iron ore exporters.
WTI CRUDE OIL
Price structure: This commodity is news driven
With a 50 cents range between the open and close of last week, WTI continues the consolidation. The important observation is now the consolidation is above the $42.00 support level.
This low level of volatility will lead to to a high level of volatility in this commodity and the underlying energy equities.
Indicator: Relative Strength
Relative Strength has failed a divergence phase, however the value moving higher above the 50 level is a good sign that negative price momentum is missing from the price chart.
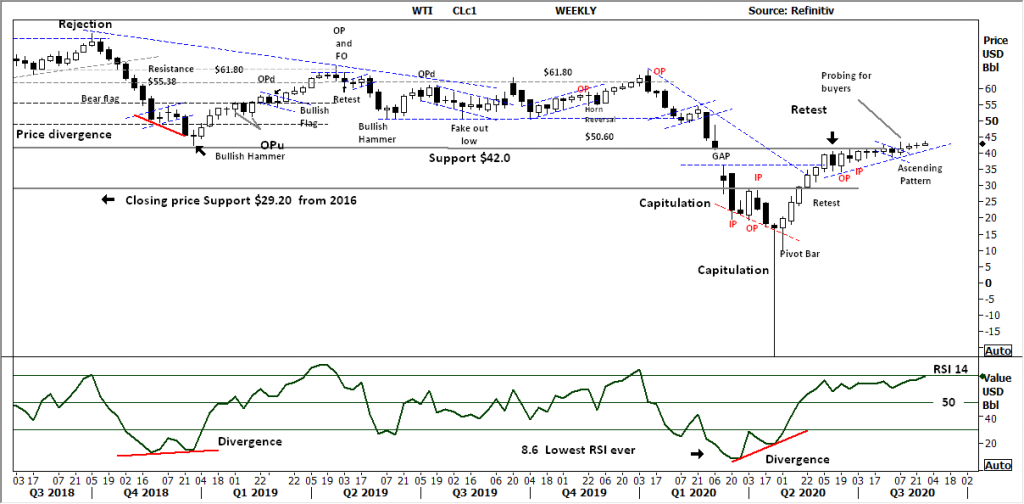
Comments from last week: WTI opened and closed within a 10 cent range last week. The Oil trader would be frustrated with the current low volatility price ranges. This market looks to be favouring the breakout higher as the probing high from 3 weeks ago is tested. Trader should again keep in mind these low volatility price consolidations often lead to highly volatile breakouts either way.


 Access +10,000 financial
instruments
Access +10,000 financial
instruments