
Global Indices’ have found good technical support this week. As the continued Global shutdown takes place these support levels are open to be tested in the coming days. As very strong fundamental issues are developing in the economic background, currently markets will remain volatile.
The Gold and Silver charts, despite some interesting and potentially inflationary monetary movements continue to show consolidation within a price range.
Silver remains in a Primary down trend, while Gold puts in a volatile week within the Primary Up trend.
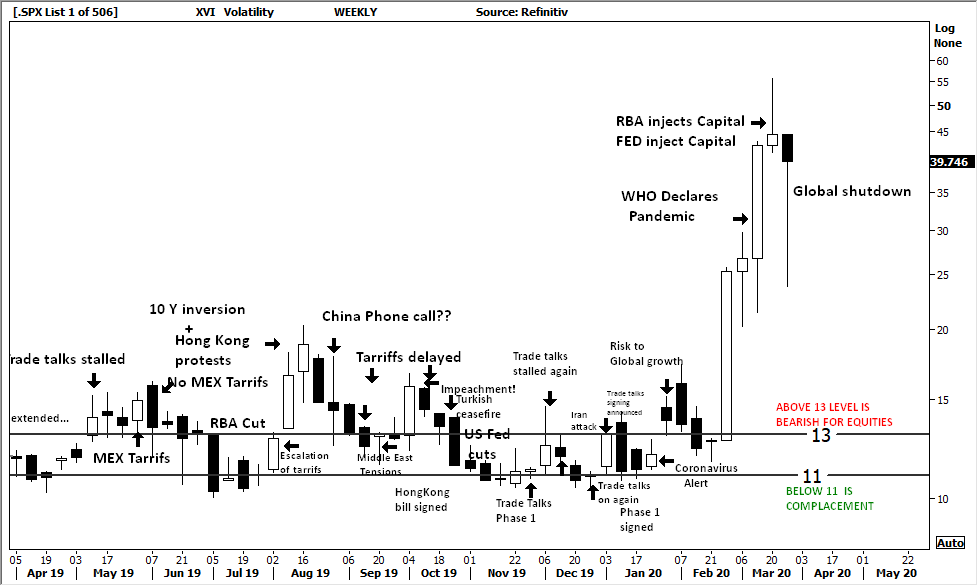
Underlying market volatility, measured by the XVI chart remains at extreme levels.
XJO WEEKLY
Last week a large range with the open close within points of each other indicates confusion between the Buyers and Sellers.
With historical 4765 remaining as support this level will be defended by the bullish in the coming week.
Relative strength Indicator (14) turning sideways only indicates this slowing downside momentum.
This corrective movement (-32.5% ) may find resistance at 5544 on any rally in the coming weeks, the preference is further price consolidation above 4402 and 4765.
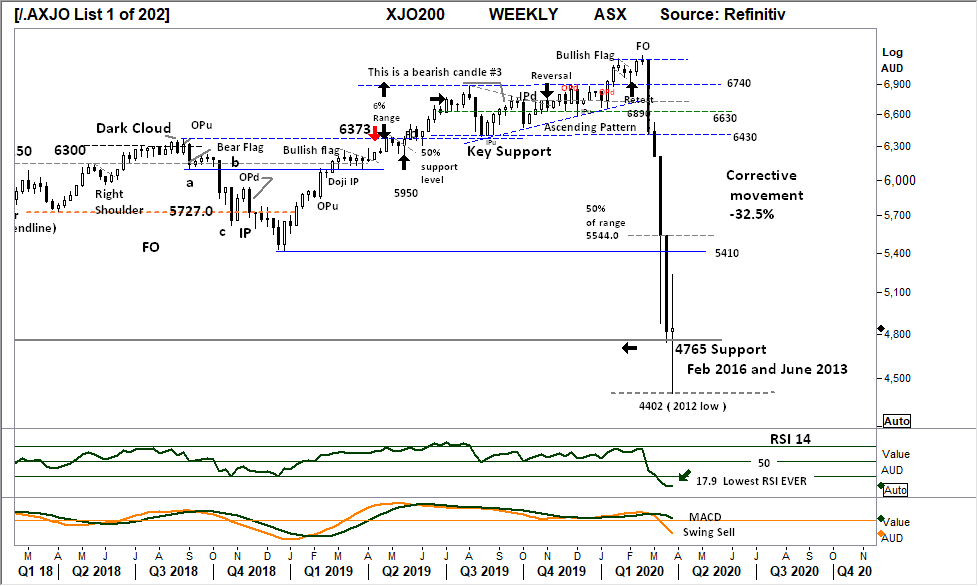
Comments from last week: The Weekly XJO shows the continuing and directional selling pressure to close towards the low for the week. This current 4765 level goes back to February 2016 and June 2013, a further Weekly close below this level would only show a continuing momentum move underway. A close above this level would set the next support level 4328 as the further and immediate downside target.
XJO DAILY
The past weeks rising price on falling volume with Friday’s outside period (OP) on strong volume suggest the market is selling into strength. This is typical BEAR MARKET activity and should be monitored in the coming week.
A retest of the low 4402 in the coming days, Daily resistance shown at 5000 and 5286 is significant.
A further breakdown below 4402 will place the market into a Primary down trend.
Relative strength continues to show bullish divergence, however remains below the “50” level, and turning lower this divergence may be regarded as “weak”.
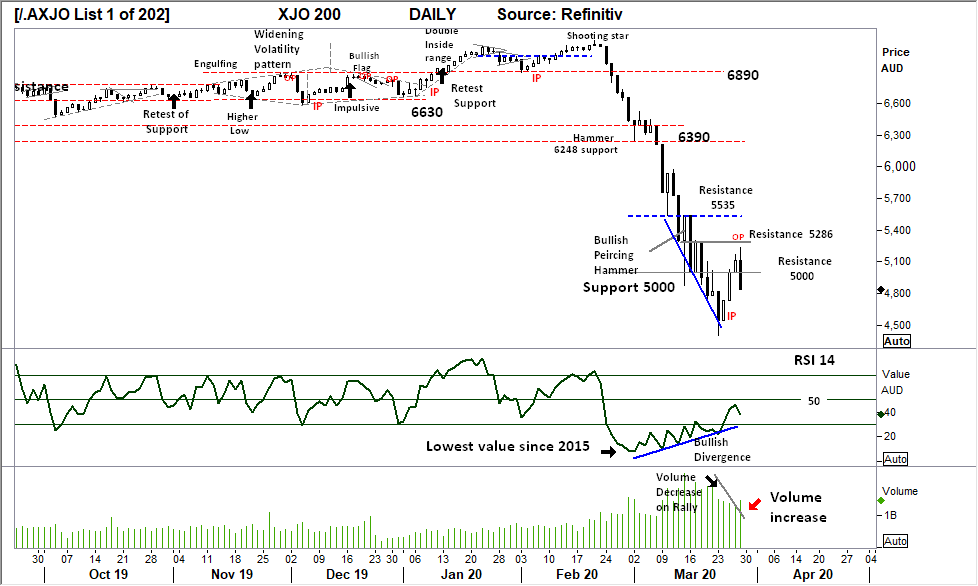
Comments from last week: Large volume days as the market moves between short term resistance and support, with the mixture of positive and negative days the market is in accumulation mode at these levels. Further capitulation below 4800 would suggest a further sell down towards the weekly support of 4328.
S&P 500 WEEKLY
With a very large range outside range (OP) closing within the historical support level of 2400, shows very strong and defensive buying. Statistically the OP is a very strong marker of market turning points ( within 3 bars, 94%).
Look for continued support above 2400 in the coming week, this is NOT a new Bull market, but a bear market rally. Only a retracement and retest of last weeks 2637 high will determine the strength of the buyers.
Relative strength has turned higher and will be monitored for Bullish divergence in the coming weeks.
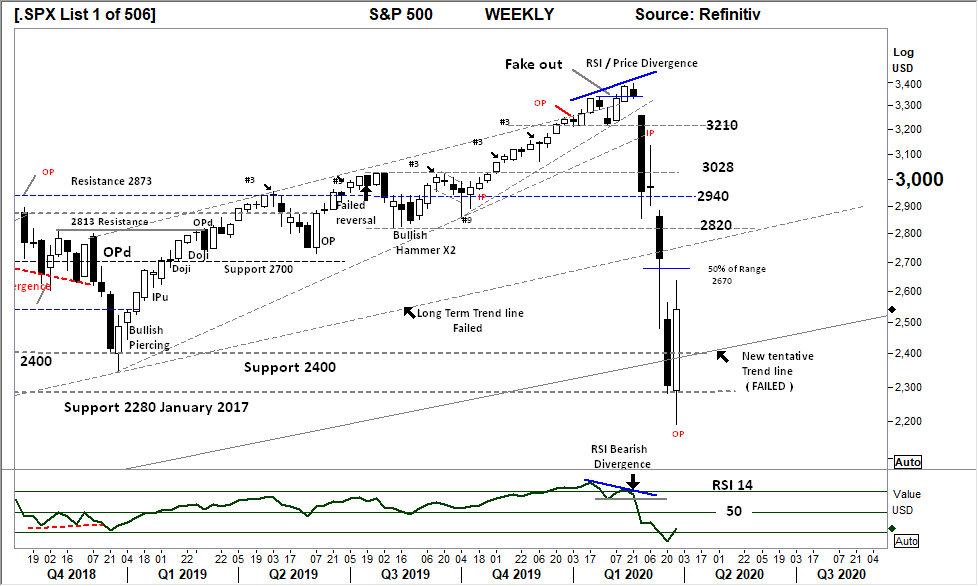
Comments from last week: The S&P weekly chart remains directional with a close towards the low of the weekly range. The current 2280 January 2017 support remains the level to hold. Relative strength has moved below the “30” level. Market may “react” to outside Government announcements and stimulus, however downside momentum remains strong. Should a relief rally occur the first resistance level is now 2400 points, this level should be monitored for a weekly closing price above this level to indicate a sign of support.
S&P 500 DAILY
In this daily time frame the Relative strength has provided a swing “Buy” signal following the recent pivot point. All against the prevailing downward price movement.
Significant resistance remains at the 2750 level.
Last Friday’s inside period (IPd) shows the market in balance, a directional move will give a strong indication of underlying market sentiment.
With uncertainty in the fundamentals backing the Index, a potential move lower carries the highest probability.
Relative strength has again turned to move below the key 50 level. A further movement below 50 and the 30 level would negate this current short term bullish move.
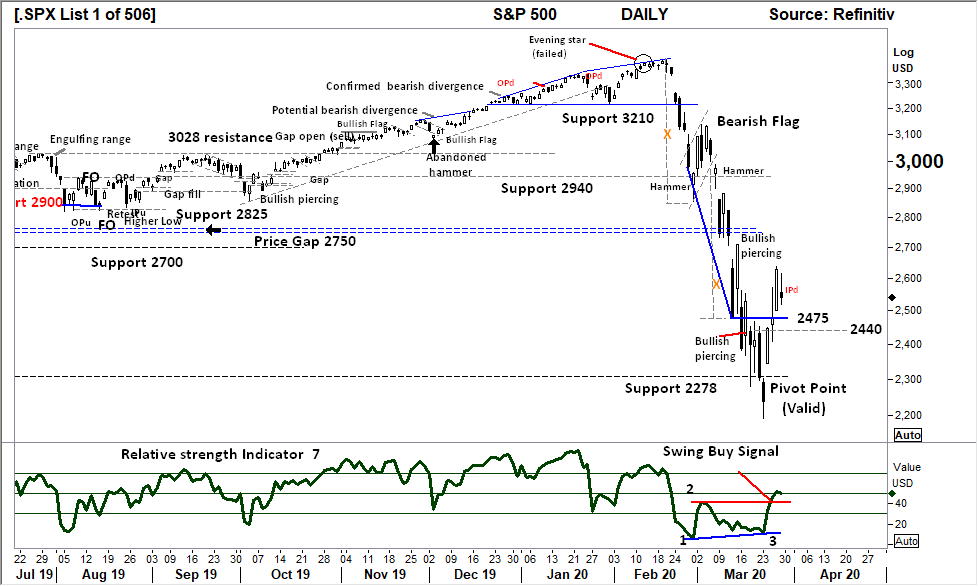
Comments from last week: Fridays low close to retest the 2278 lows of Wednesday. This level is below the December 2018 low. With an intimate support level at 2278 observed, a potential further breakdown could show a further capitulation move to 2085 points. The Daily chart is now developing several levels of resistance that can be used as a gauge of any bullish price moves that may develop the coming days.
GOLD – WEEKLY
The Weekly chart of Gold shows a significant Pivot point in place. As the range is “large” compared to the previous week, the weeks movement is regarded as impulsive.
Of significance is the close above the $1610.90 level, a win for the bulls in this Primary UP trend.
Relative strength had shown a swing sell signal as the indicator moves below the internal low. Currently with the indicator swinging back above the 50 level the signal is now negated.
Traders should monitor this indicator for further swing lower below 50 as a sign of further downside to come. Substantial long term bearish divergence remains in place.
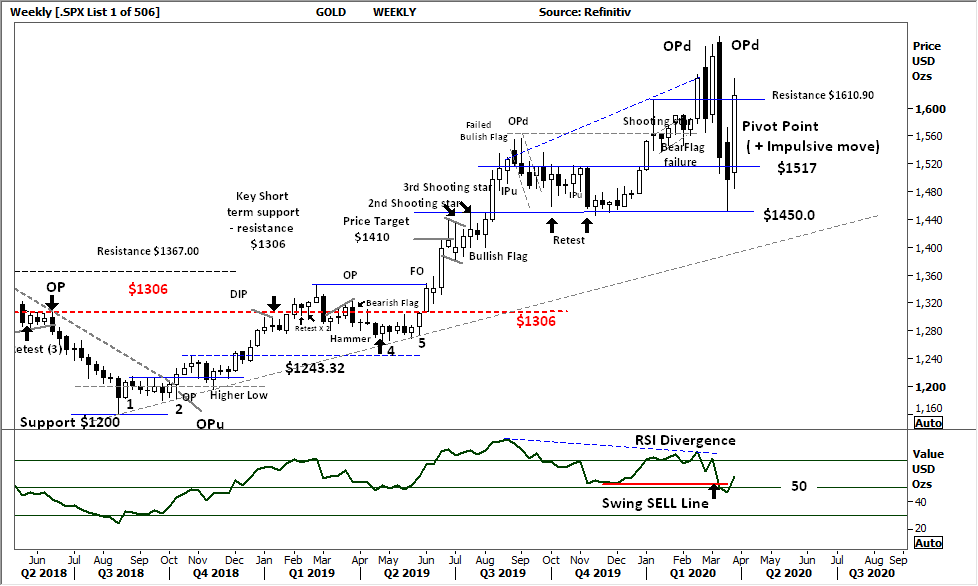
Comments from last week: Last week’s notes observed the potential for GOLD to move towards historic support of a $1450 ETF selling the physical to raise cash has led to a lower market in this metal. $1450 is now a critical level to hold in the coming week. With the mid-range close towards $1517 resistance this will be the level to watch for a bullish breakout.
GOLD DAILY
Trade the price not the safe haven.
The daily chart paints a very different short term picture with price resistance developing at $1631 within the small pennant pattern.
Last Friday’s inside period (IPd) indicates balance between the buyers and sellers, the price breakout either way of this bar should give overall direction.
The Relative strength has moved above the key “50” level however the Bearish divergence showing slowing momentum from late February – early March remains.
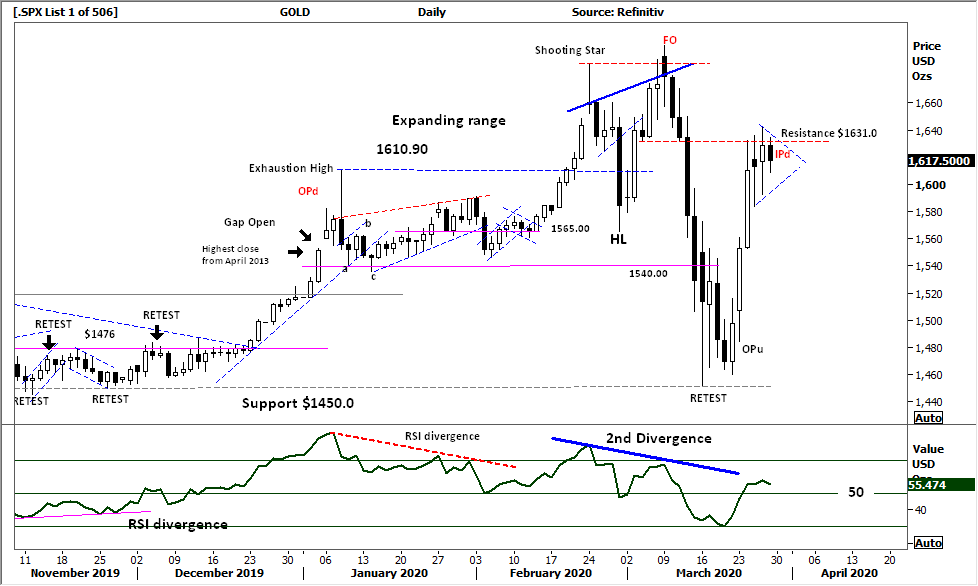
Comments from last week: Current daily price movements indicate a consolidation level above $1450. Friday’s OPu ( outside period up close) has good statistical value for marking turning points in underlying price movements. If it is considered Fridays “up close” is short covering the $1460 low of Friday will be the marker for a further bearish move.
SILVER DAILY
Many Silver Bulls citing the Gold Silver ratio as being bullish ?, there is NO statistical evidence to back up those assertions.
Silver remains in a Primary down trend, the current continuation pennant.(?) Requires a closing price breakout higher over Wednesday’s $14.70 high to confirm a retest of $16.60 is underway.
Price failure below the current pennant formation would be a significant bearish signal within the current down trend.
The Relative strength Indicator moving higher is a positive, and should be monitored for a further move of the key “50” level.
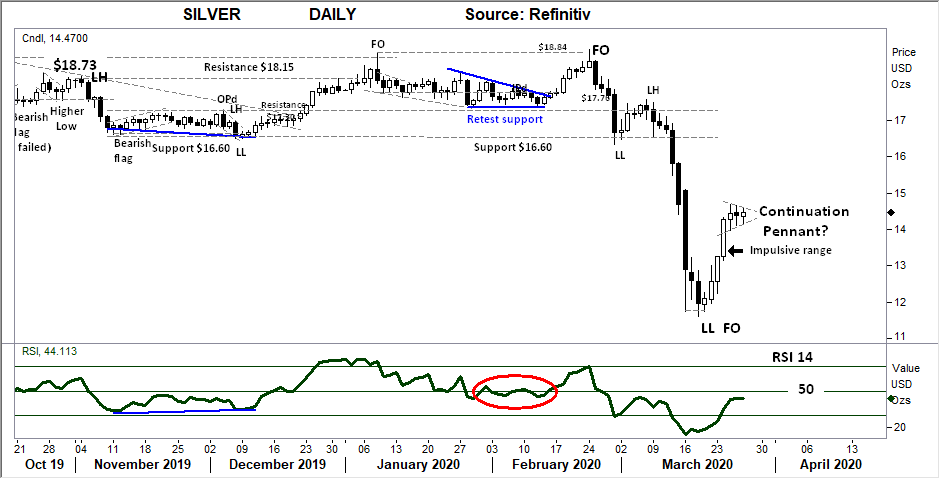
Comments from last week: Current consolidation above $11.50 sets up silver to make the first “swing point” to higher prices. This type of consolidation can break lower, Wednesday’s low of $11.61 will be the first level of intimate support in the coming days. Relative strength has turned higher, however remains below the 30 level. In the coming days should RSI move over 30 on a rising price this would be a very strong indicator the “low” is in for now.
AUSTRALIAN VOLATILITY INDEX
Current volatility levels, remain the 2nd highest since the GFC and again shows a Strong move from the inter week’s lows, this is a Bearish sign as the market has again increased immediate near term risk to valuations. This may again move higher in the coming weeks.
Should the value fall in the coming days, this would show a bullish signal in equities.
The XVI is the difference of 1 month forward pricing of ETO Options against current month.
As markets anticipate events, the forward priced option volatility changes, hence as forward price changes, this “skew” in pricing is measured in this XVI.
The XVI value works as an inverse observation to the underlying market.
An XVI over “13” is generally bearish for equities.
USD DOLLAR INDEX
Rejection at 103, Last Monday the inside period (IPu) began the balance point. With the current retest of 98.45 historical resistance / support level underway, a further closing price below this level will potentially bring in the lower support level of 96.57 and a retest of the “95” level into focus. The downward price movement is a Primary movement and may show a full correction movement to the early March 2020 lows.
Relative strength has moved above the “70” level indicating improving and bullish price momentum.
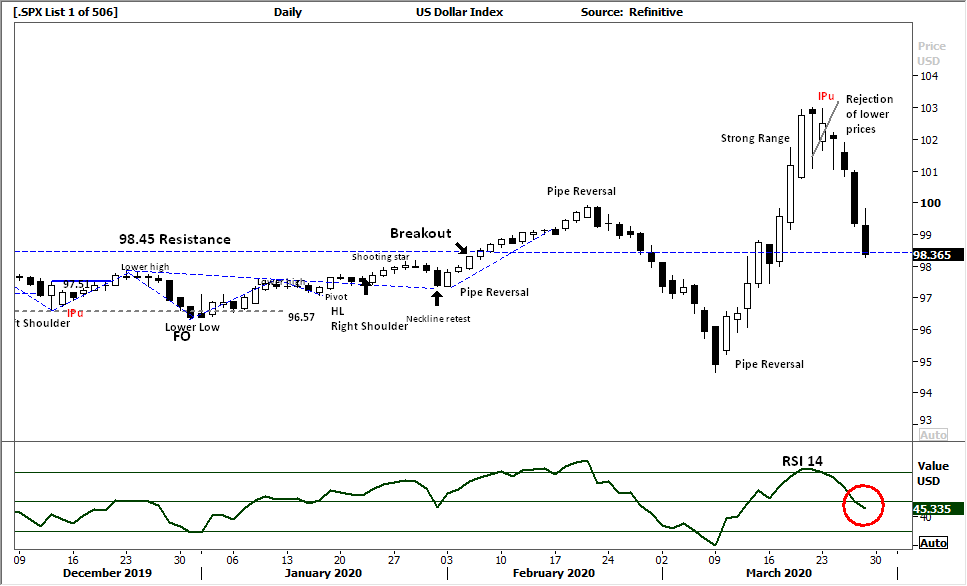
Comments from last week: As the US federal reserve pumps money into the credit systems the USD has gained last week to remain over the 102 level. The long lower shadow of last weeks price movement shows the overall strength of the USD.
WTI CRUDE OIL
This commodity is news driven.
Consolidation above $20.00 is the best potential outcome as last week’s Inside period (IP) shows balance between the buyers and sellers.
The underlying price move remains “corrective”.
Price resistance at the past support level of $29.20 will come into play on any short term bullish movement.
Interestingly the Relative strength Indicator is at its lowest level ever, showing a deep oversold condition in the price. This would now be monitored for a Bullish divergence signal in the coming weeks.
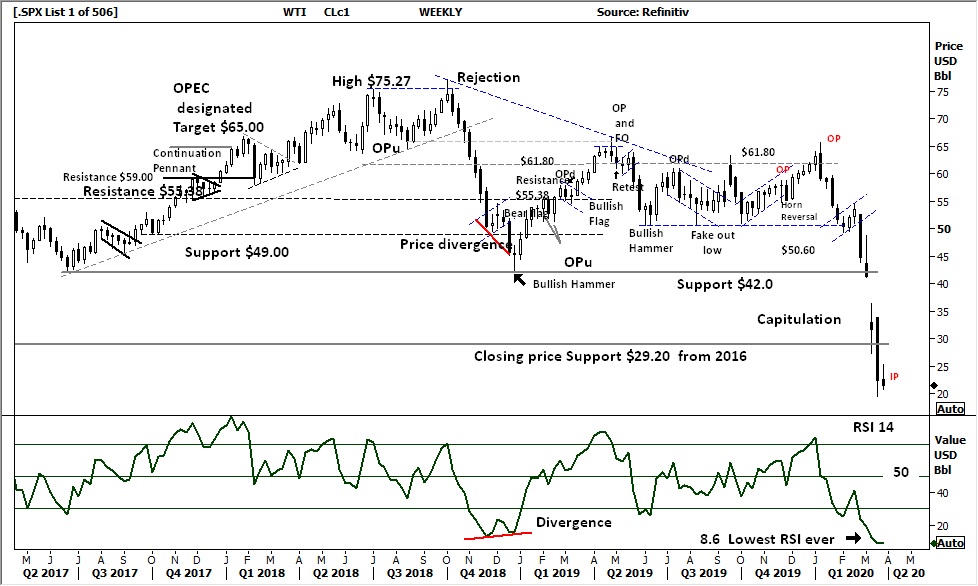
Comments from last week: Oil continues the capitulation move lower to trade at 2001 $20.0 levels. The large range of the weekly price candle suggest consolidation may develop above this current low. RSI is deeply oversold, and can be observed as “turning” sideways, a good sign a low may be close. This commodity is news driven, so any gains in the coming week will put traders at risk of a “retest” of last week’s low in any coming price consolidation period.


 Access +10,000 financial
instruments
Access +10,000 financial
instruments