
Sudden left of field events occasionally enter the market space, they offer opportunity for patient investors. Markets can quickly price in the expected future value. This is often a trading opportunity.
Major indices staged a key reversal event last Friday, following the previous week’s key reversal bar showing in a majority of markets, the current futures reading only suggest more downside to start the week.
The difficulty with this type of sudden news driven market movement is the volatility can lead to further Algorithm driven selling without regard for support levels.
What has concerned most market traders, is the disruption across all market sectors from the Bond market to the Oil contracts including Silver and Copper.
Gold, the only metal to hold its position on the Major support level of $1788.0, still has the potential for further downside.
The base pattern Inverse head and Shoulder pattern shown in Silver has failed.
XJO WEEKLY
Price structure:
Over the past months I have suggested the possibility of a broad distribution top forming within the Index. Last week price developments started to set a lower high within the index, the same closing value as 26 weeks ago. The 7200 level is now critical to hold into the end of this week, a close below this level will put the Index into a Primary Bear trend with 6900 next key support.
Price action falling below the 7200 level and closing back above this level would set up a very Bullish 1st week of December.
Indicator: Relative Strength 14
Relative Strength has turned lower, as the reading is below the 50 level, the next move in the RSI will be telling should it move below the 30 level. The Relative Strength Indicator reflects price momentum. The RSI should be monitored for continued movement above the key level of 50 to show bullish price momentum.

Comments from last week: The Australian XJO continues to consolidate below the 7530 level. Price movement is now outside of the trendline. A price breakdown below the 7200 level would put the index into a Primary down trend, until that occurs, the Index maintains a Bullish stance as these types of consolidation often lead to significant breakouts higher. From Mid July 2021 the increased number of inside (IP) and outside weeks (OP) has statistically exceeded the normal distribution of around 12% or 12/100 bars. Between Q2 and Q3 2020 a similar type of consolidation occurred prior to the December breakout higher.
XJO DAILY
Price structure:
Last Tuesday, Wednesday and Thursday began to set up a very bullish pattern for a breakout higher. Last Friday has set an impulsive movement (large range) to a 31 day low, next daily support at 7216 will be decisive for the market in the short term. The Index has broken the Weekly trendline, support levels offer a critical insight to market sentiment.
Indicator: Relative Strength 14
The RSI has turned sharply below the 50 level as last Friday’s move lower erases the past 31 days of price movement. In the short term a continued move below this key level should be expected with price moving to the 7216 level.
Indicator: VOLUME
Trading volumes have remained benign on the falling price structure; this is not a great long-term signal for the Bullish. Last Friday’s negative close on low-ish volume indicate a low participation rate, although the buyers may be exhausted.
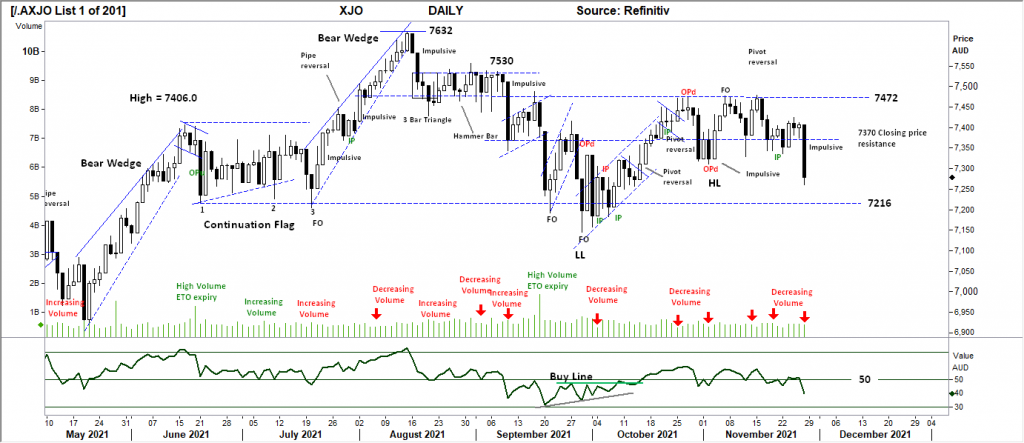
Comments from last week: The Daily time frame offers a clear picture of resistance at the 7472, given the number of lower shadows (wicks) of the trading day’s support is clearly evident from below the 7370 level. In the short term the small range bar set last Friday overlapping the Thursday bar is a short-term bearish signal of weak prices. A further retracement into the 7350 level is possible in the early part of this trading week.
S&P 500 WEEKLY
Price structure:
The S & P 500 remains within a Primary UP trend structure, the Outside range (OPd) is a key reversal signal, (+90% for marking a turning point). A break of the 4545 level would see a retest of the 4320 level, this should be monitored for a close outside of the current lower channel line. Last week’s range high to low is the largest for the past 18 weeks and has the potential to follow through lower.
Indicator: Relative Strength Indicator 14
The Relative Strength Indicator has set a new Bearish divergence signal, the sell line at 60 should the reading fall further. A reading below the key 50 level would signal further price weakness.

Comments from last week: A second inside Weekly range following the push higher 3 weeks ago. This type of consolidation shows a market in balance, with the Primary UP trend already in place a further move higher should be expected out of this small pennant pattern. Currently, important support remains at 4545 points. Upper channel resistance offers a price target of 4880 points. (current close 4697). A signal of decreasing momentum as the Relative strength Indicator (14) turns sideways as the calculation takes in 2 sideways small range closing differentials.
S&P 500 DAILY
Price structure:
The Daily price shows a clear breakdown of support at 4650 with the potential to retest the Trendline and original breakout point and support at 4547 points. Last Friday’s impulsive range (large) has the potential to follow through and break below the 4547 level with 4444 as next key support.
Indicator: Relative Strength 14
Relative Strength Indicator (14) has turned lower from the 70 level, a signal of slowing price momentum. A further close below the 50 level would alert traders to failing price momentum with further downside.

Comments from last week: The developing trading range between 4650 and 4721 (Futures contract high = 4723 points). The small range between open and close of each recent trading day shows indecision. The trading range can develop further with a retest of the support level of 4650 in the coming days. This level must hold for the overall picture to remain the bullish consolidation phase required prior to a further move higher.
NASDAQ DAILY
Price structure:
The Nasdaq has led the way in this current retracement underway. Taking a broader look at the Daily Nasdaq, the chart shows the Bearish divergence sell signal confirmed and in play from the OPd marking the high. Last week’s comments centred on the “Gap open” exhaustion signal being an early warning event. A tentative trendline remains in place, however further declines have two levels of support at 15700 and 15534 points. How price reacts around these two levels will give some insight as to the strength of underlying buying.
Indicator: Relative Strength 14
Relative Strength Indicator moving below the 70 level is a strong sign of failing price momentum, the current reading at 50 is a strong bearish signal and has confirmed a bearish divergence sell signal. Further loss of momentum should be expected, until a reading above the 50 level is confirmed.
 Comments from last week: A new contract high with a “Gap open”, this is a Bearish signal of exhaustion, the small range day last Friday shows little commitment from the Buyers and may lead to profit taking on any price weakness early this week. Price has again closed at the Upper Bollinger band showing maximum relative volatility, historically, price can “walk” the band for many weeks, however the Gap open is a technical “watch and Sell” signal in the short term.
USD Spot GOLD – DAILY
Price structure: No evidence of a Bull market.
Initial support at $1834 has been disregarded as the impulsive price movement (large range) pushed lower to the early November breakout level of $1788.0. Sellers entered the market later in the session on Friday’s initial advance to retest the higher $1834.0 level. Gold remains within a large trading range with support at $1725.0 and resistance of $1876.90. This is not Bull market activity.
Indicator: Relative Strength 14
Relative Strength shows a reading below the 50 level and turning sideways as downside momentum slows.

Comments from last week: The Daily OPd (outside period down close) has marked the high for the short term, last Wednesday’s following UP close bar shows the failed retest of the high with a strong range bar lower on Friday. This chart shows support at $1834 as the potential retest price target for the short term. The Primary Trend remains UP, the current consolidation remains bullish for further gains in the coming weeks. A close over the OPD high would be very bullish in the short term. Relative Strength Indicator 14 moving below the 70 level, a SELL divergence signal is now in place as the RSI has failed to make a new high on last Wednesday’s push higher.
SILVER DAILY
Price structure:
Silver remains within a trading range of resistance at $25.52 and support of $21.60. The inverse head and Shoulder pattern has failed with price moving decisively below the neckline, with Friday’s close at a 6-week low, further downside should be expected to retest the $22.50 level.
Indicator: Relative Strength 14
Current Relative Strength is moving below the 50 level shown price momentum failing. A further move below the 30 level would be very bearish in the short term.
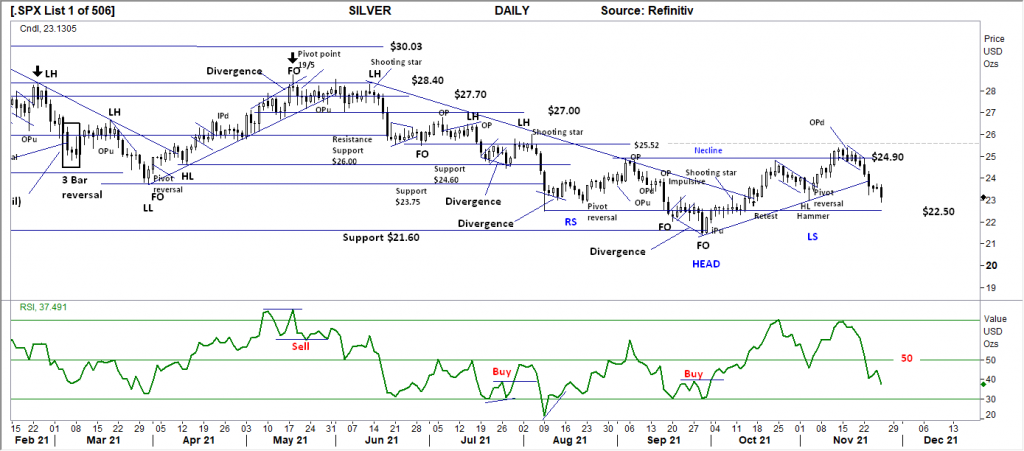
Comments from last week: Good consolidation around the $24.90 neckline level is developing in the Daily chart for Silver. Last Tuesday also showed an OPd marking the high. Current retracement activity is identified and a Bullish flag pattern, and remains a positive development around this $24.90 area. Resistance at $25.52 remains the key level to clear before Silver could be called a Bull market.
AUD GOLD DAILY
Price structure:
The OPd from 2 weeks ago has not failed in its warning to traders of a potential short-term top in place. The current retest of $2477.0 has so-far been held following Friday’s failed retest of $2541.0. In the short term view these two support and resistance levels will give traders a key insight to the next movement with a break of either level. The lower side would be expected first.
Indicator Relative Strength 14
Relative Strength moving sharply below the 70 level and is in line with strong price movements. Within the current Daily consolidation, the RSI will move sideways, a further movement below the 50 level would indicate a short term bearish reversal.
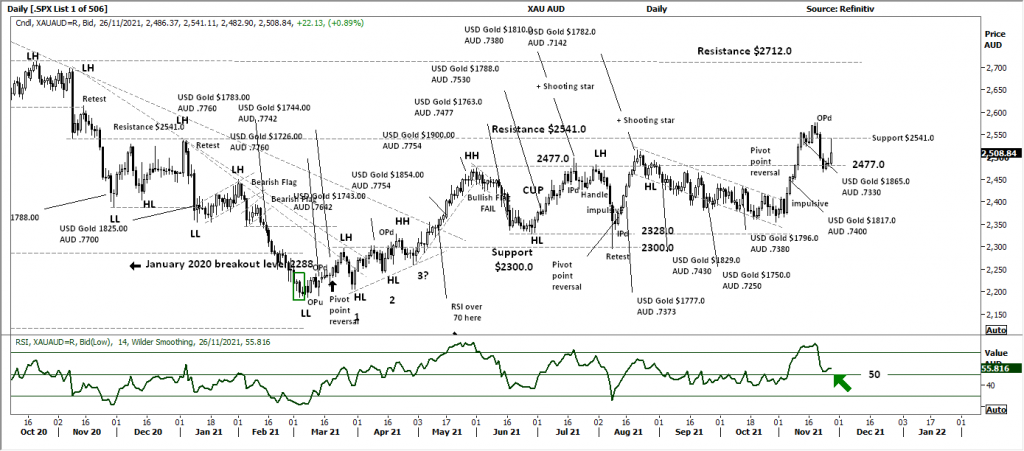
Comments from last week: Continuing weakness in the $AUD has helped push the AUD XAU price higher above the MAJOR resistance level of $2541.0. Last Friday’s OPd can mark the short-term high is in place with a potential retest of $2477.0 possible on a weaker underlying $USD Gold price.
COPPER DAILY
Price structure:
Over the past 6 months I have referred to the $4.33 midpoint level as the critical level to hold. This level has again failed, with the current retest of the long term trendline underway. A further breakdown below this level shows next key support at $4.00. Copper remains within a 10 month consolidation range between resistance of $4.80 and Support shown at $4.00.
Indicator: Relative Strength 14
Current reading swings above and below the 50 level reflect the current consolidation underway. The key for now is the RSI remains above the 50 level as a reflection of ongoing and any positive underlying positive price momentum.

Comments from last week: From the Pivot point of 2 weeks ago, last week Copper staged a sell off to test the current Trendline support area. It is important to notice the closing price for the week is above the key $4.33 support/resistance level. This is a good outcome on the Weekly “hammer bar” now in place. A further move higher would show a new higher low point has developed and a retest of the $4.80 all time high as the target. The turn lower in the RSI reflects the sharp price movement lower. Current readings are not a great signal for further immediate momentum gains.
AUSTRALIAN VOLATILITY INDEX
During last Friday’s large range day, the XVI declined, highly unusual given the extent of the current decline. However, the reading is higher last week showing an increase in forward 3 month pricing of the PUT option series.
The XVI is the difference between 3-month forward pricing of ETO Options against current month.
As markets anticipate events, the forward priced option volatility changes, hence as forward price changes, this “skew” in pricing is measured in this XVI.
The XVI value works as an inverse observation to the underlying market.

Comments from last week: The price of forward insurance (PUT options) have declined, with the weeks reading remaining in the Bullish zone between 11.0 and 13.0. This remains a mildly bullish signal for further gains in equity prices.
USD DOLLAR INDEX
Price structure:
The early moves last week quickly reversed on Friday with the general risk off event underway. Look for a retest of the 95.70 level to confirm ongoing support in the short term.
Indicator: Relative Strength 14
The Relative Strength has turned lower in line with price movements and momentum. And has the potential to move lower on further price weakness while remaining above the 50 level.
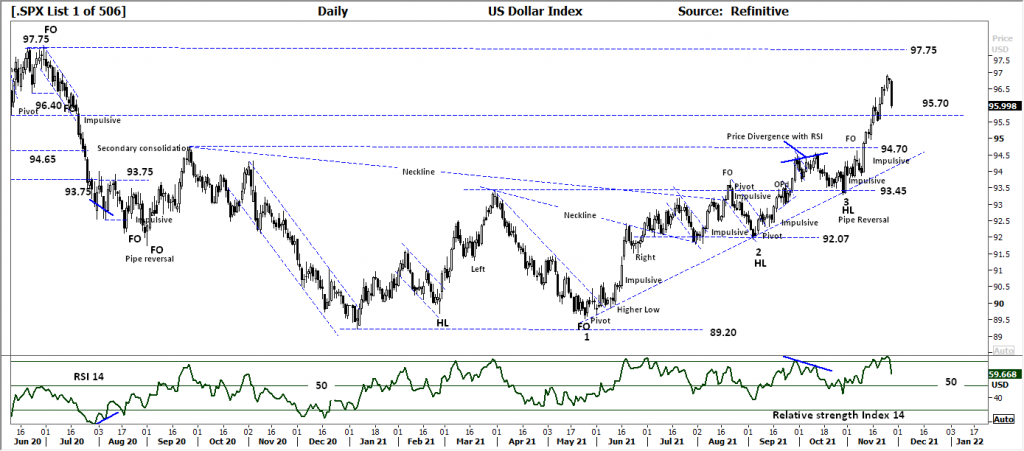
Comments from last week: The USD has entered a Bull market move with the price action now above the 94.70 level and the 95.70 level. Friday’s high and Wednesday’s high have set a small double high level that may provide some resistance in the short term. Daily consolidation around this level would be a Bullish signal for further gains in the coming weeks.
WTI CRUDE OIL
Price structure: This commodity is news driven by supply -demand.
Oil suffered its biggest one-day decline since March 2020. The bullish flag has failed, as the $66.0 level is again retested. The WTI contract remains within the confines of a Primary UP trend. A further price decline below the $61.80 level would put Oil into a corrective phase.
Indicator: Relative Strength 14
With the Relative Strength now reading below the 30 level further price weakness on momentum turns negative should be expected. This is the area to now monitor for a Bullish divergence signal to develop over the coming weeks.
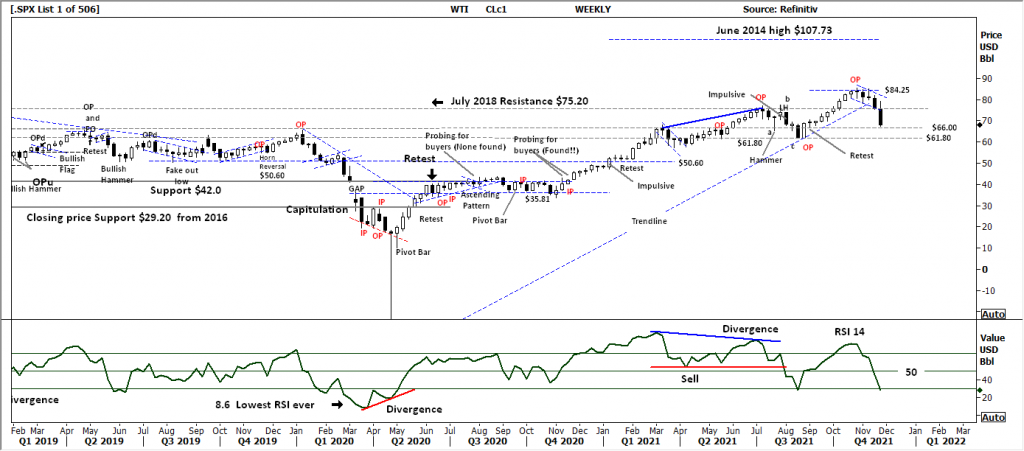
Comments from last week: Last week saw a retest of the key $75.20 support level. Traders should look for support at this level in the coming days to further increase the Bullish view for the WTI contract. Underlying Primary trend remains up with the $107.73 June 2014 high as the ultimate target with $100 as the key psychological level as the first major resistance level on this UP trend. The sharp turn lower in the RSI reading is in line with the developing Flag pattern. In the event of pattern failure (strong close below the $75.20 level) RSI may move to the 30 level indicating the loss of upward momentum has turned to downward momentum.


 Access +10,000 financial
instruments
Access +10,000 financial
instruments