
Major indices remain at a point of inflection about the cost to Global growth during this 2nd wave of COVID-19. Valuations remain EXTREMELY stretched. In the S&P 500 the top five companies now make up 90% of the Index value. Currently the S&P is testing the 3393 historic high.
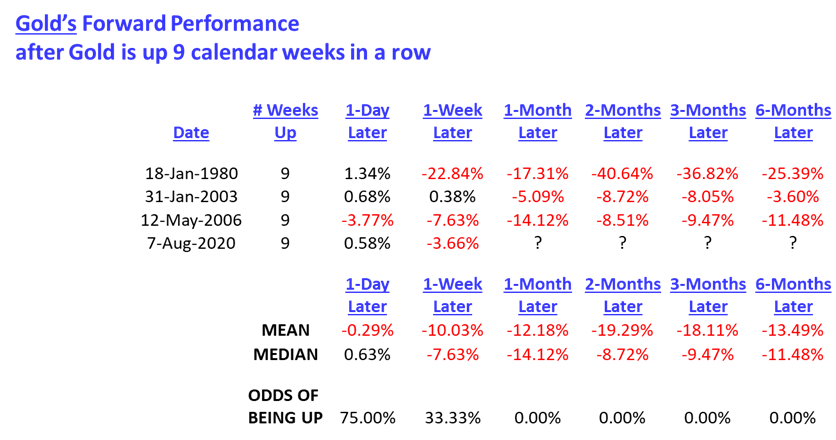
The statistics for Gold and Silver making new highs after the recent 9 week run within the next 6 months is Zero.
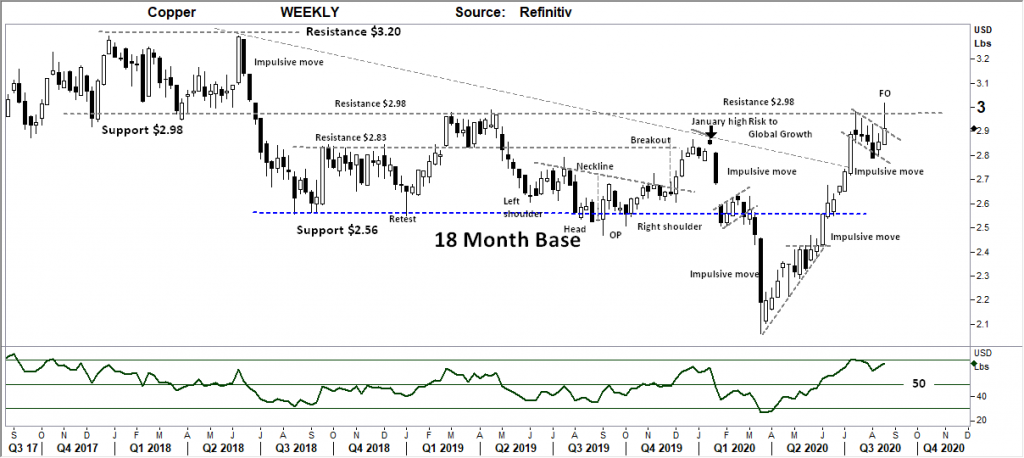
This week the COPPER chart is included, Dr Copper is the go to index for a reflection on potential growth, this week saw a significant rejection at an important resistance level.
West Texas Oil put in a 10 cent range for the week, remaining the dullest of the futures markets.
XJO WEEKLY
Price structure:
Further consolidation in the XJO as reporting season continues. Index value remains within the consolidation range and remains in a “secondary consolidation” phase. Current price range high ( 6196 ) has again tested the high boundary (6200). The small range for the week suggests further consolidation. Without a major catalyst as a driver price ranges will remain bound. Traders should keep in mind the Markets adage, “low volatility leads to high volatility”.
Indicator: Relative Strength
Relative Strength, again week 12, momentum has moved sideways, the only positive to see here is it remains above the key 50 level. Further consolidation in the price chart may this this dip below the key 50 level.
Indicator: MACD
MACD remains a swing “buy” signal, This week has seen a “slight” dip in the fast line, only reflecting the slowing momentum.
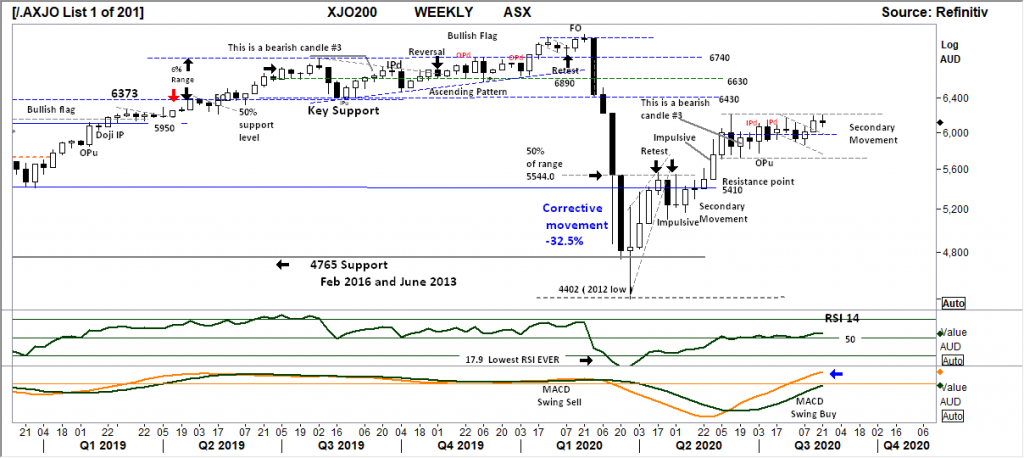
Comments from last week: A good move in the past week to remain above the “midpoint” of the secondary movement range ( high 6200). This sets the market on a Bullish path, with a potential breakout above this key 6200 level. Last week set a bullish “pivot point” with the “low” of 2 weeks ago being a higher low in this now ascending pattern.
XJO DAILY
Price structure:
Lack of daily direction, a closer look shows the past 3 months in an ascending pattern.
This market remains without a catalyst, with the reporting season not having an impact overall. Suggesting the XJO follows the US markets remains a false statement, but this market will react should the US markets move to a decline.
Indicator: Relative Strength
RSI has turned lower again in line with the chart price movement a signal for further momentum losses and is at risk of falling below the key 50 level.
Indicator: VOLUME:Volumes continue increase on the “down” days, this is of concern as it suggests distribution not accumulation. Significant volume increases need to show on the up days to confirm the longer term bullish view.

Comments from last week: A clear bullish flag developing in the “Daily” chart, a good development from the pivot point reversal. Traders would look for a breakout over 6200 in the coming days. Underlying bank stock will need to do the heavy lifting for this potential outcome. Mining stocks, in particular FMG have had a great run and may weigh on the index in the early part of the week.
S&P 500 WEEKLY
Price structure:
Last week pushing higher again, the past 2 weeks bars have lower shadows, this is a bearish signal for the next 2 weeks.
At best further consolidation at these level is important.
BUT traders should keep in mind 5 S&P stocks now make up the greatest valuation skew ever seen in markets. The 3385 February closing high will be the key level in the coming week, the relative strength (comments below) suggest further gains.
Indicator: Relative Strength Indicator
Relative Strength turning higher is a good signal for further gains, the RSI needs to remain above the key 50 level and continue to rise for current momentum to remain positive.
A move below this 50 level is a signal of bearish momentum.
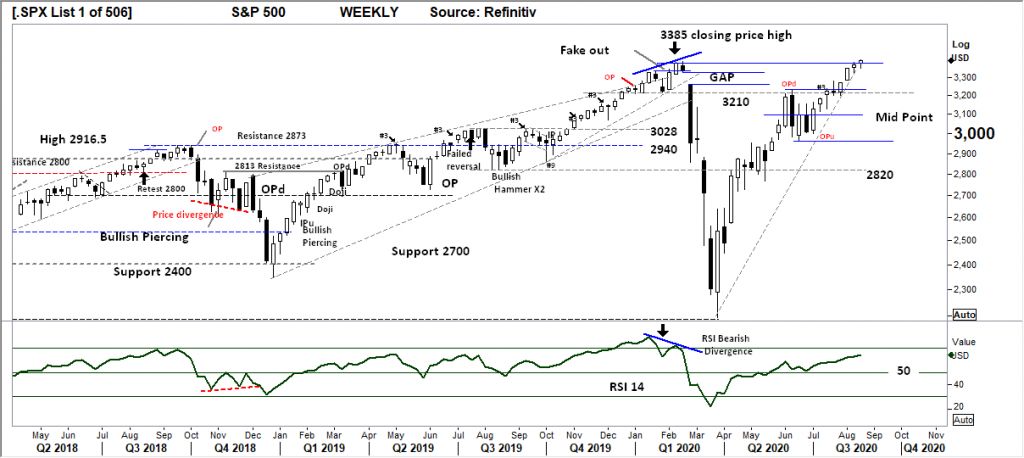
Comments from last week:Last week saw the index push into a new high but close below the Q1 2020 closing high. This should be of some concern in the short term as the weekly “range” of the candle is shorter than the previous week showing a slowing momentum. Key levels in a potential retracement situation are shown at 3328, and 3210.
S&P 500 DAILY
Price structure:
Daily price ranges remain “thin” showing a lack of commitment by both the buyers and the sellers. This market remains in daily consolidation at these levels.
Overall the Primary trend remains UP.
Trader should again keep in mind this type of low volatility consolidation will lead to a high volatility move.
Indicator: Relative Strength
RSI signal line has rolled LOWER there is now some divergence showing in momentum and price movement, this should again be monitored in the coming week as this continues.
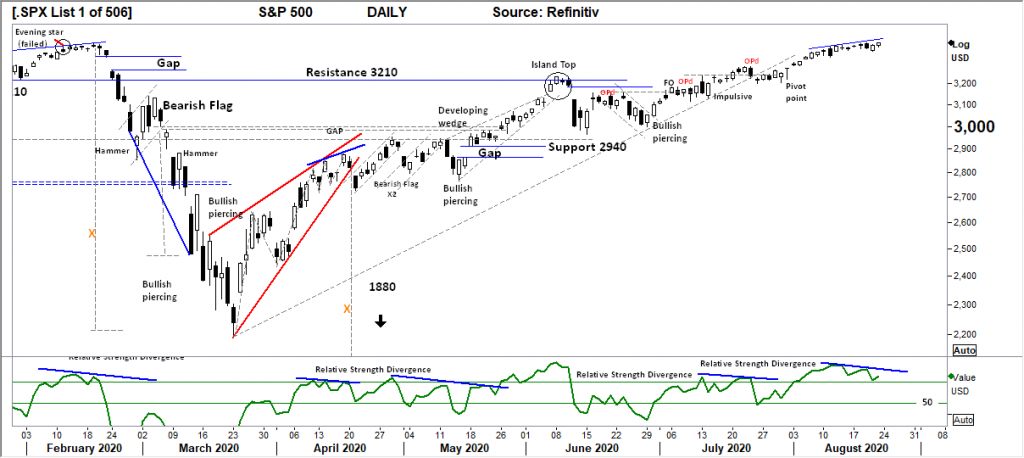
Comments from last week: The daily movements have clearly “flattened out” at this key historic resistance level. The outside bar on Tuesday has the potential to mark a short term high in place. A retest of 3210 would be a healthy retracement in the coming days. At best further price consolidation at this level would be ideal for a breakout higher in the coming weeks.
GOLD – WEEKLY
Price structure:
The underlying price structure remains in a Primary UP trend.
The whole world still wants to be “long” Gold, until they don’t.
The Weekly chart of Gold has reached and closed at an important level of support ($1939.65) shown as the midpoint of the rising bar 4 weeks ago.
With the week closing in the lower part of the range sets up a bearish week ahead for the metal. The view remains a retest of the breakout point around $1750 – $1800 is consistent with price theory.
A price move lower will test the weak holders and may add to further margin selling.
Indicator: Relative Strength
Relative strength remains strong but has now turned sharply lower to move below “70”, this can be monitored to remain above the “50” level, as the instrument finds consolidation.
Further selling below last weeks low may see a complete loss of positive momentum.
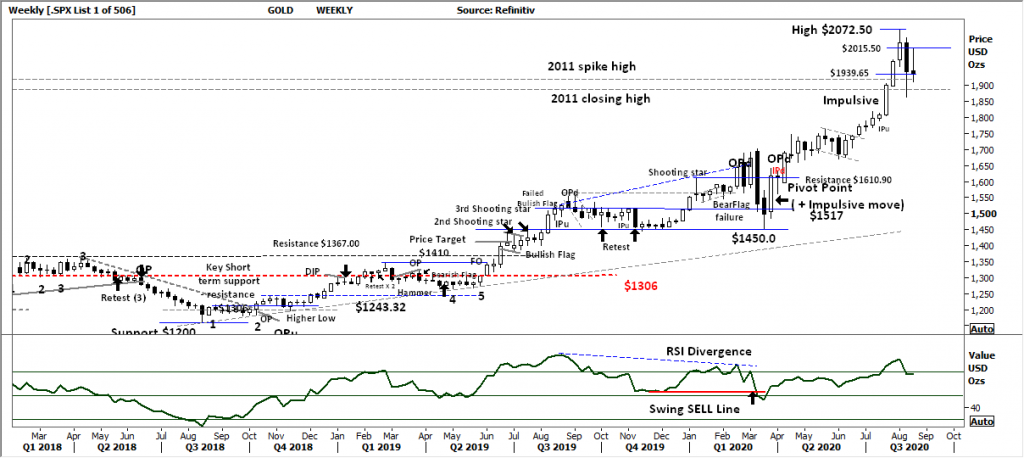
Comments from last week: The Weekly chart of Gold now shows a “pivot point” reversal, initially trading below the key midpoint of 1939.65. The weekly close above this level is an important sign of key support. This weekly chart price chart is now at risk of going into a consolidation period as the buyers find their confidence again. Further selling below last weeks low ($1863) may see a retest of the initial breakout at $1700.
AUD GOLD DAILY
Price structure:
The bearish flag breakdown ( see last weeks note below ) is playing out as the AUD remains strong and USD Gold prices decline. This will continue to have implications for listed Gold producers with a potential risk off event coming. Should AUD Gold move below the marked “ breakout retest” level the market will be defined as a bear market.
Indicator: Relative Strength
With the RSI now falling, the crossover of the 50 level is a bad sign upward momentum maybe at an end in the short term. The flag breakdown would see this indicator move further below 50 showing bearish price momentum.
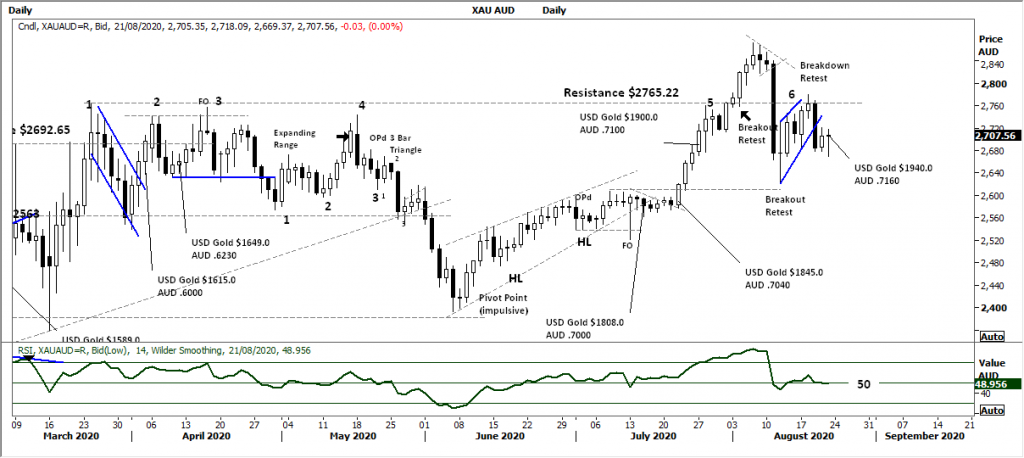
Comments from last week:A resilient Australian dollar against a falling $USD Gold price has seen a sharp corrective movement in this AUD Gold price below what could have been substantial support at $2765.22. The developing Bearish flag with the Wednesday low being the retest of the $2600 level shows price is at risk of moving lower in the coming days. This will have implications for Australian Gold producers large and small. SAR, NCM and NST charts are at risk of moving lower in the coming days.
SILVER DAILY
Price structure:
The daily Silver chart shows an initial Bear Flag break-down, however support can be seen developing at $26.20. this level should now be monitored for further support. A further breakdown in line with Gold has the long term trend line targeted at $22.00.
This would put Silver into a Primary down trend. A best further consolidation could be expected.
Indicator: Relative Strength
The divergence signal from 2 weeks ago has played out in the current price decline.
With RSI now below “70” but remaining above “50” the bearish flag may simply develop into a consolidation pattern.
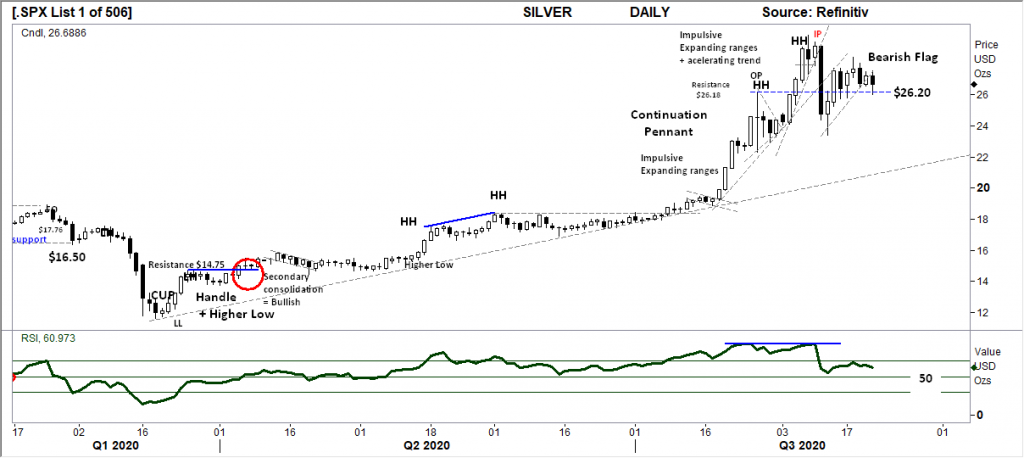
Comments from last week: The current price weakness in Silver failed to find support at past key levels. In particular the $26.20 price point (second last HH). With a bearish flag developing, a breakdown would target the longer term trend line around the $22.0 level. The large down range shown on Tuesday clearly indicates a panic take profit from the late comers into this market. At best a further consolidation pattern may develop. Traders would monitor last Wednesday’s low as a potential price failure point.
COPPER DAILY
Price structure:
The copper chart has made some interesting developments in the past Week with a bullish flag breakout to retest the long term support resistance level at $2.98 – $3.00. A reflection of an increase in China manufacturing and slow reopening of global growth this early indicator should be monitored for further gains. The Weekly “rejection” ( FO ) is not a great sign of immediate gains coming but has been an important development in price structure.
Indicator: Relative Strength
Relative Strength has moved strongly over the 50 level in the past 12 weeks. The current levels only reflect the current strong upward price momentum.
AUSTRALIAN VOLATILITY INDEX
In the background market commentary there remains an overall concern of stalling Global growth and indeed local Australian GDP may become a discussion subject, this is again being reflected in the XVI, along with extreme company valuations. This current rise in the XVI should not be ignored as a potential precursor to a volatility event within the equity markets.
The XVI is the difference of 1-month forward pricing of ETO Options against current month.
As markets anticipate events, the forward priced option volatility changes, hence as forward price changes, this “skew” in pricing is measured in this XVI.
The XVI value works as an inverse observation to the underlying market.
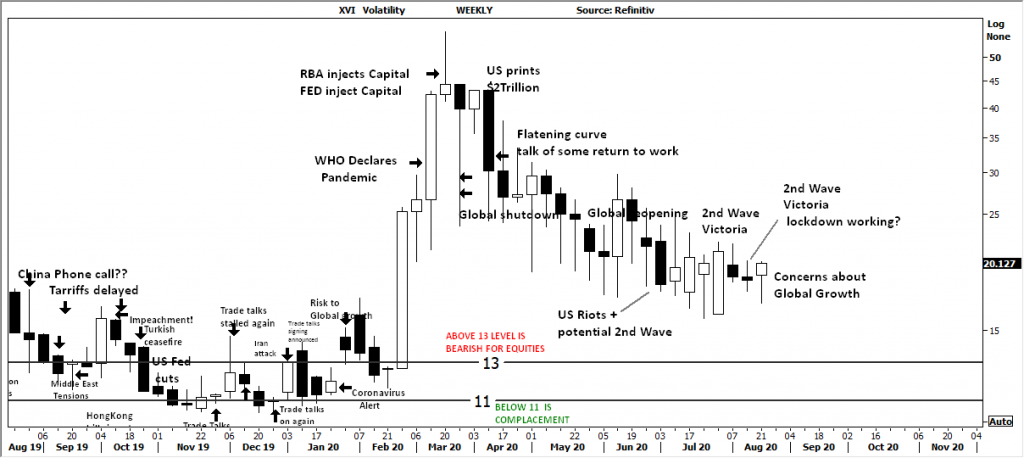
Comments from last week: The current “volatility” within the Volatility index has shown a consolidation period over the past 7 periods. Equities remain constrained while this indicator remains at these levels. The good news is the value is slowly falling, the risk is a rising value will place further pressure on equities in the coming weeks.
USD DOLLAR INDEX
Price structure:
Last week midweek the DXY set a Fake out move lower and completed as a bullish “pipe reversal” with a further retest of the 93.75 level.
The DXY remains in a secondary consolidation phase until either the higher level at 93.75 or lower level at 92.10 is broken decisively.
The June – July period displayed a similar pattern prior to the current breakdown. However further gains would see the AUD trade lower providing support for the AU listed Goldies and Iron ore exporters.
Indicator: Relative Strength
RSI Bullish divergence has eventually played out with the RSI value now moving towards the key 50 level. This type of signal is highly reliable and still may take several weeks to play out back over the 50 level.
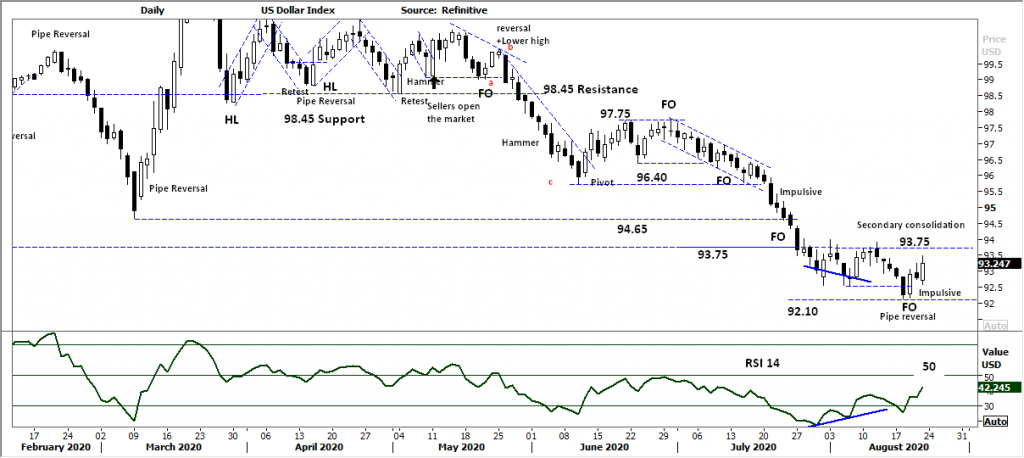
Comments from last week: Further “secondary” consolidation has shown up during the past week, below the key 93.75 level. The only consoling factor in this chart is the “low of the past week has not been broken. A further decline may assist the $AUD to higher values placing pressure on the $AUD Gold price.
WTI CRUDE OIL
Price structure: This commodity is news driven.
WTI opened and closed within a 10 cent range last week. The Oil trader would be frustrated with the current low volatility price ranges. This market looks to be favouring the breakout higher as the probing high from 3 weeks ago is tested. Trader should again keep in mind these low volatility price consolidations often lead to highly volatile breakouts either way.
Indicator: Relative Strength
Relative Strength remains in a divergence phase, however the moving sideways above the 50 level is a good sign that negative price momentum is missing from the price chart.
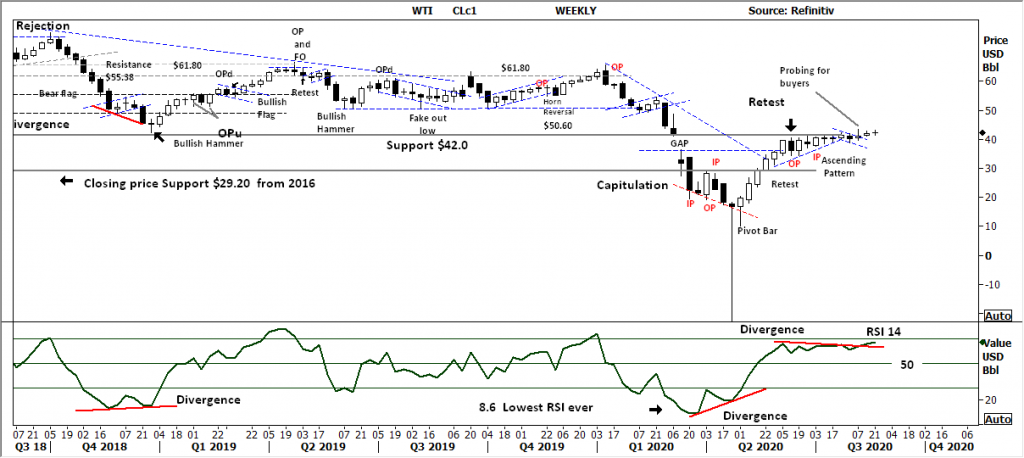
Comments from last weekLast 2 weeks the “probe for buyers” has resulted in a further move above the key $42.0 level. The ascending pattern has the potential to see WTI retest the $50 level. The high volatility from early Q2 2020 has led to an expected period of “low volatility”. However the structure remains bullish for further gains.


 Access +10,000 financial
instruments
Access +10,000 financial
instruments