
The outside range showing in the S&P 500 (SPX) is telling of the battle between the buyers and Sellers within the market.
The low close only suggests further selling to come, as market participants digest the volatility within the Tech stocks and the continuing impact of Covid19 on major economies.
The major Australian indices XJO and XAO remain at risk of setting a broad distribution top, the result of a cooling economy, these indices being heavily weighted with banks and retail.
Many opportunities remain within the market for active traders.
Oil markets at risk of a sell down have recovered to retest a major resistance level and will offer potential upside for energy companies.
As Tech cools down this may be the sector to watch.
XJO WEEKLY
Price structure:
The week resulted with an inside range (from the previous week), this is where the market comes into balance. Coming into balance, but below the midpoint following a sell down.
This remains a Bearish picture for a potential retest of the 5725 level.
This type of trading range when the low (5725) is once again tested may be the precursor to a further Bull run, however trading ranges can take many months to resolve.
Indicator: Relative Strength
Relative Strength, again maintains the dip below “50”, this is not a great look for the Bulls in the market.
Further consolidation in the price chart may this this dip further below the key 50 level targeting the 30 level.
Indicator: MACD
MACD remains a swing “buy” signal, This week has continued with a further dip in the fast line now closing in on the slow signal line, only reflecting the slowing momentum. The impending cross over would be the Sell signal.
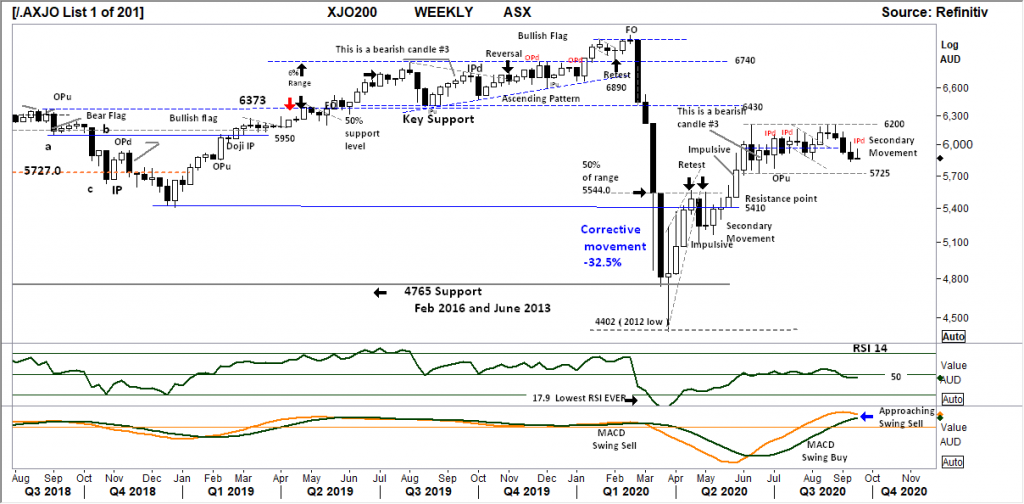
Comments from last week: Last week saw the index continue to move below the “midpoint” of the current secondary movement consolidation. The expanded range bar is bearish and indicates the potential for further declines. The weekly support level at 5720 is the first target in this current decline. Over-all the Primary trend remains UP, overall however these consolidation periods can last for MANY months.
XJO DAILY
Price structure:
Last Wednesday saw the breakout from the Wedge pattern, true to form the location of the pattern is not ideal and prone to failure.
The real issue here is the developing broad distribution top, the volume increase on down days is the giveaway. ( disregard the ETO expiry volume). The lows of June 2020 may well be tested in the coming days. The key observation will be if the daily ranges start to expand to the downside.
Indicator: Relative Strength
RSI has turned lower again in line with the chart price movement putting in a lower high a signal for further momentum losses as the indicator moves below the key 50 level, and remains at risk of again dipping below the key 30 level.
Indicator: VOLUME
Volumes continue increase on the “down” days, this is of concern as it suggests distribution not accumulation. Significant volume increases need to show on the up days to confirm the longer term bullish view.

Comments from last week: A picture of fundamental and economic uncertainty. Increasing volume on the down days indicates a distribution pattern underway, Last Wednesday’s large range is a very bearish signal in the short term for further declines. 5720 remains the downside target as the baseline of this consolidation pattern now entering its 4th month. The current “descending wedge” pattern can be a bullish structure, however when trapped inside this consolidation area carries less influence in the price structure.
S&P 500 WEEKLY
Price structure:
Two outside ranges in 3 weeks shows the battle between the buyers and the sellers, both remain defiant. An important retest of 3200 is underway, observed as the weekly closing price remains at the low. This is not a bear market signal (yet) but an important retracement in the advancing Bull trend. But overall this market needs some strong economic news flow soon to keep this bullish commentary intact.
Indicator: Relative Strength Indicator
Relative Strength turning lower is simply a reaction calculation of the weeks price range. There is not much to glean from its position as the prior move was not over the “70” level. A move below the 50 level is a signal of bearish momentum.
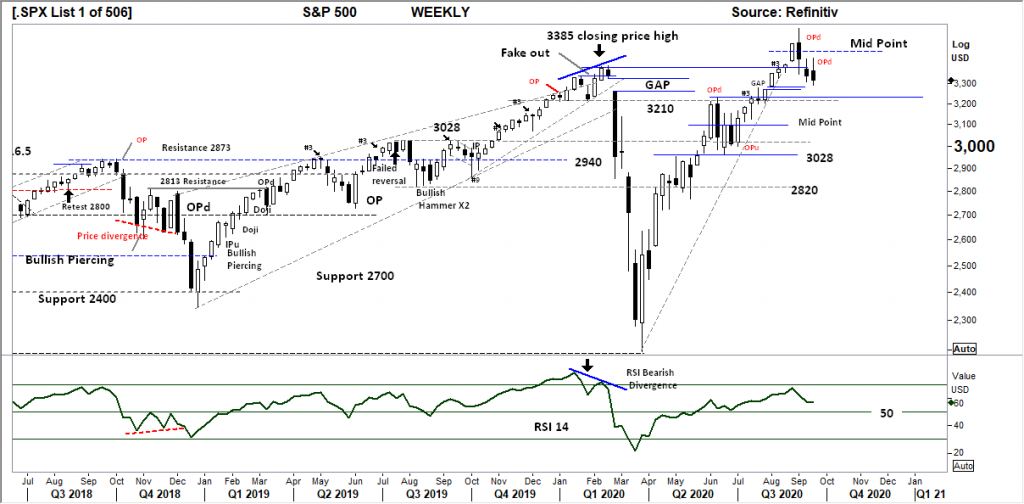
Comments from last week: With the follow through lower, it is noted last week was a smaller “range” showing a less decisive sell from the bears but confirms a reversal pivot point. The small “gap” area will be the first point of interest in any further decline. The preferred observation is the beginning of a consolidation area above 3200 and below 3500 points. Primary trend remains UP.
S&P 500 DAILY
Price structure:
The past 9 trading days remain within a tight range, with the “c” wave of the structure to complete. The small price Gap above 3200 would be the first downside target in any further bouts of selling.
The support / resistance level shown at 3350 will remain the marker for the first potential recovery rally. This would be strong signal if accompanied by the RSI moving over the key “50” level in the coming days (unlikely)
Indicator: Relative Strength:
Relative Strength has again turned lower and at risk of crossing the “30” level. Traders should be aware that the RSI crossing the 30 level does not generate a buy signal. As this type of price consolidation can last for many months.
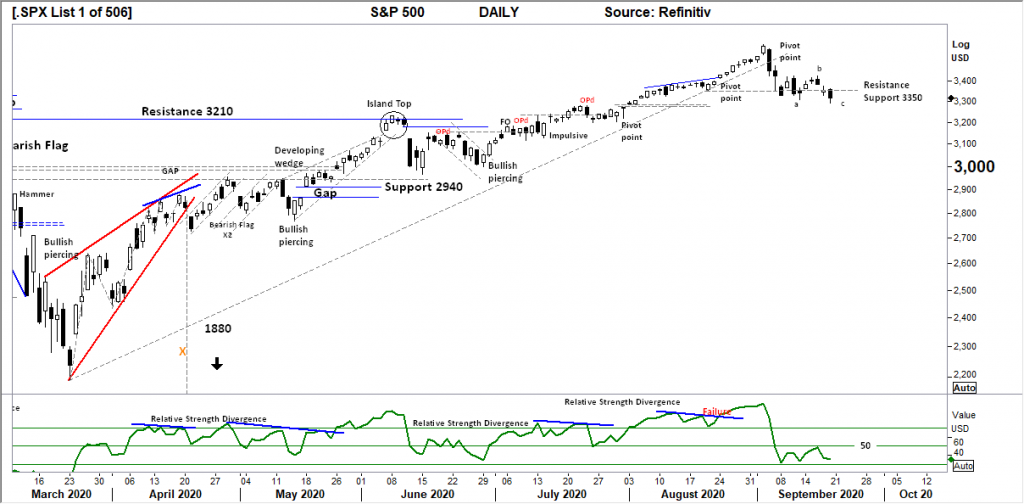
Comments from last week: The first signs of consolidation showing in the Daily chart along the 3350 level. Many false short and long signals can be observed in the short term making it difficult for the day trader. However the current pattern is not a Bearish sell signal, the current take profit has further to develop before the Bears take control. Further consolidation would be expected, with 3500 the upper breakout level and 3200 the lower support level in the coming days.
USD Spot GOLD – WEEKLY
Price structure:
The underlying price structure remains in a Primary UP trend.
The whole world still wants to be “long” Gold, until they don’t.
Gold continues to consolidate below closing price resistance at $1964.0 and support at $1939.65. As the consolidation drags on (and can last for many months) a retest lower would be the expedient outcome to test the resolve of the long-term holders.
When applying Ichimoku the future cloud and Kijun-sen (green) are showing major support at $1760.0, while price sitting on the Tenkan-sen line (blue) is at risk of breaking lower
Indicator: Relative Strength
Relative Strength remains strong but has now turned sideways to lower to move below “70”, this can be monitored to remain above the “50” level, as the instrument finds consolidation.
Further selling below last week’s low may see a complete loss of positive momentum.
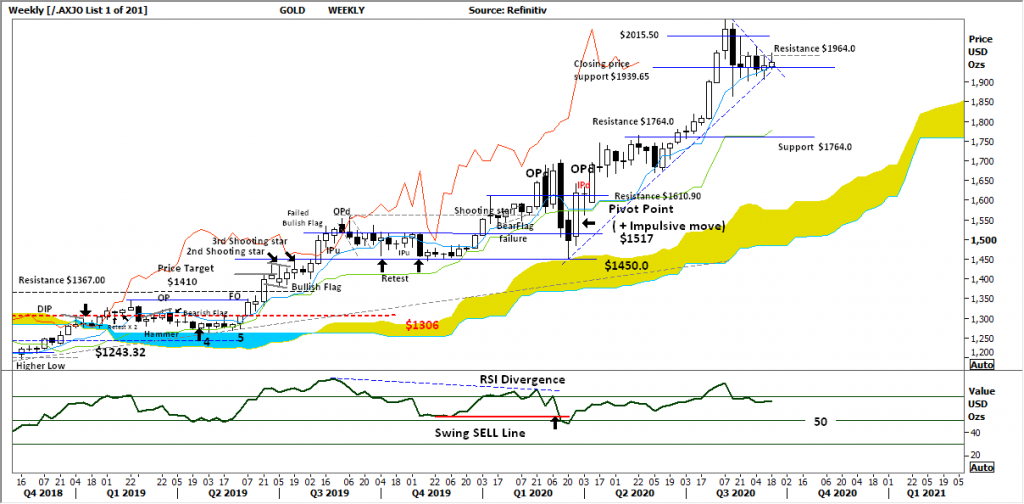
Comments from last week: Gold continues to consolidate along the key level of $1939.65. The current pattern would suggest a breakout higher, however after the recent July exponential move into the highs this market will need SIGNIFICANT news flow to push to a new high. As these consolidation patterns develop the shorter term traders will start to liquidate as better opportunities develop elsewhere. Traders should be aware a break of the current trend-line would be a significant event and potential precursor for further selling.
AUD GOLD DAILY
Price structure:
Australian listed Gold producers have not been able to find a consistent bid, a reflection of the underlying uncertainty in the AUD Gold price.
A further move lower would be expected to complete the “c” wave.
$2600 remains the major support level.
Until this chart, a reflection of the Australian Dollar price of Gold makes a significant upturn the local producers will only see lower prices.
Indicator: Relative Strength:
With the RSI now falling, the crossover of the 50 level is a signal upward momentum maybe at an end in the short term. The flag breakdown would see this indicator move further below 50 showing bearish price momentum.
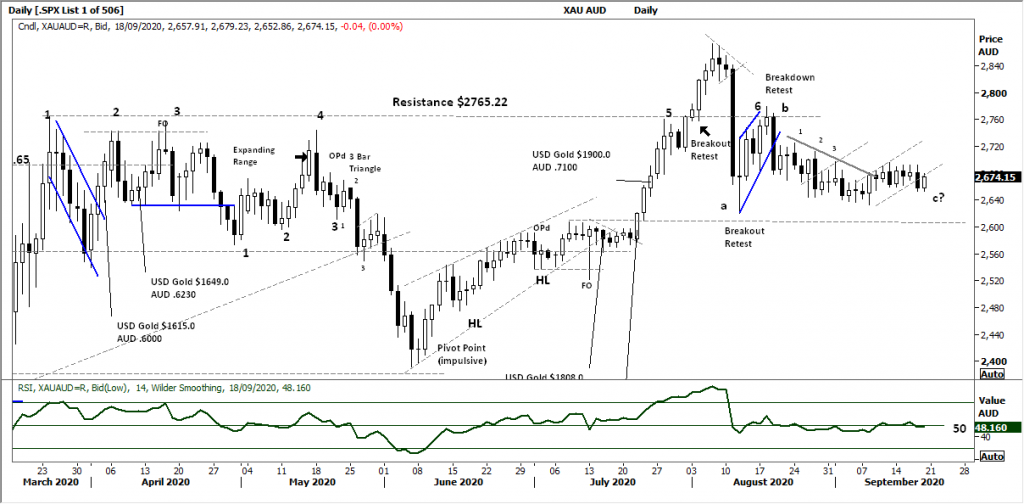
Comments from last week: Current price movement not display any conviction for a directional move in the coming week other than further consolidation. This last week can be seen as a bearish pattern, but remains within the larger consolidation below $2765.22 and above $2600.
The marked up a,b,c? pattern is shown with the “c” wave yet to fully play out.
This will not work out well for the larger Australian listed and producing Gold stocks, with many well down of the recent highs. (Not to be confused with the speculative Gold play’s.)
SILVER DAILY
Price structure:
Silver has now shown a well defined price channel between support at $26.18 and resistance shown at $28.50.
Two very strong down days in early September have not been resolved with the recent price consolidation in the lower half of this price channel.
Over time the weaker holders may find better opportunity elsewhere.
Indicator: Relative Strength:
With RSI now below “70” but remaining above “50” the bearish flag and current Bullish flag may again simply develop into further consolidation pattern.
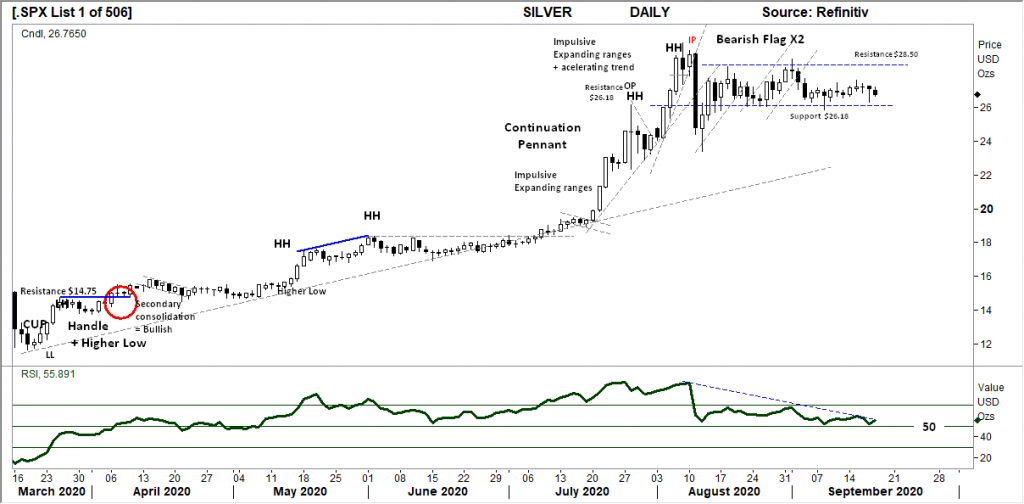
Comments from last week: A similar but different picture to the Gold chart so many continue to hold.
This Daily view of silver shows how the exhaustion highs can simply lead to long consolidation periods.
Very small daily price ranges along the $26.18 support level shows lack of conviction.
A price break below this support level would bring the short term holders to sell on stops.
The favoured outcome is a retest of the long term trend line currently at $22.00.
COPPER DAILY
Price structure
On the fundamental side Copper remains at risk of a supply shortage.
The Weekly chart of Copper remains very bullish for further gains into the $3.20 resistance level. Good range and a high close for the week, show the buyers in control.
The potential for an extended move exists as the retest of 2 weeks ago looks complete with this weeks new high in place. OZL, Metals X and Orocobre the ones to watch.
Indicator: Relative Strength
Relative Strength has moved strongly over the 50 level and now 70 level in the past 12 weeks. The higher levels only continue to reflect the current strong upward price momentum, not necessarily an over brought sell signal.
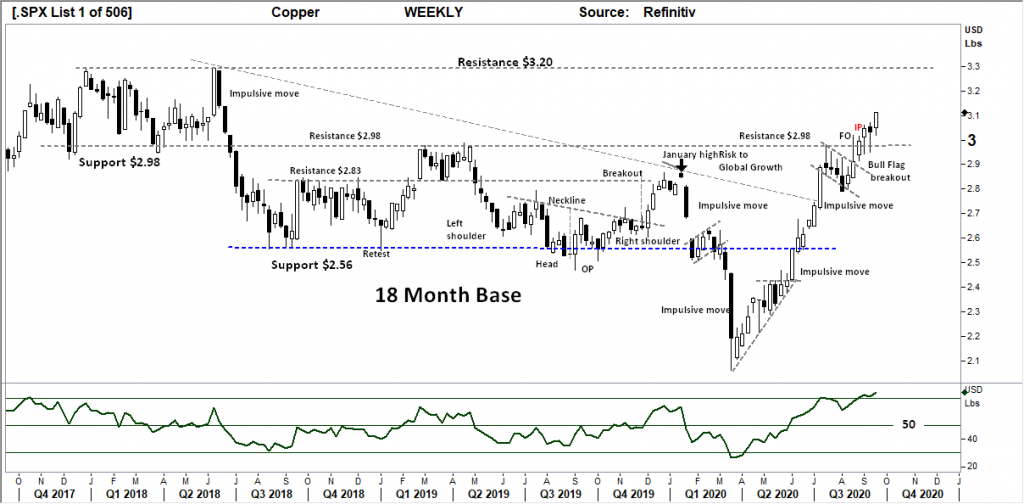
Comments from last week: The current breakout above the $2.98 – $3.0 level is holding with 2 intra week retests of this level. The weekly candles with the long lower shadows while closing towards the highs are the first sign a consolidation of price may occur along this important $3.0 price level.
The next resistance level shown at $3.20 remains the preferred upside target.
AUSTRALIAN VOLATILITY INDEX
Volatility remains relatively high, but has settled into a range as the Victorian Covid situation looks to be resolving itself.
And leads from the US indices may indicate a more orderly decline rather than a further correction.
These current levels still remain bearish for equities.
The XVI is the difference of 1-month forward pricing of ETO Options against current month.
As markets anticipate events, the forward priced option volatility changes, hence as forward price changes, this “skew” in pricing is measured in this XVI.
The XVI value works as an inverse observation to the underlying market.
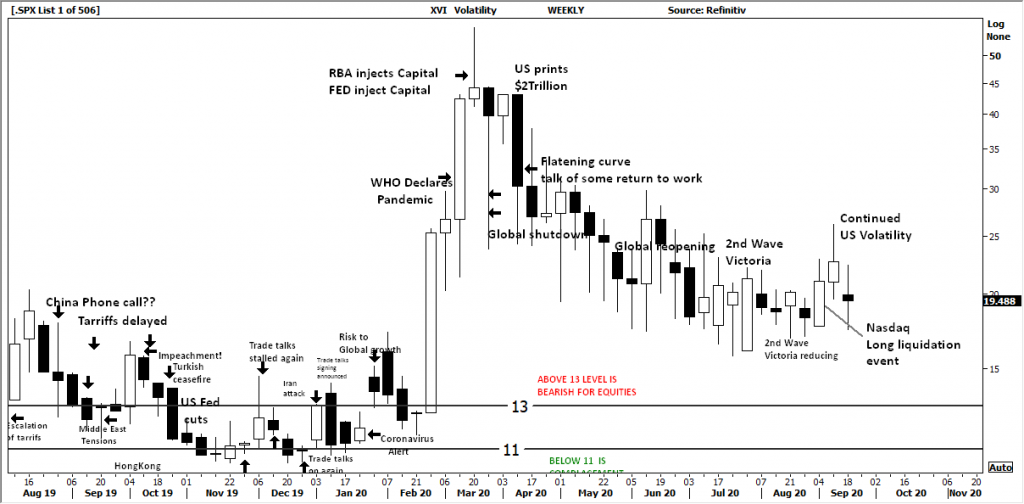
Comments from last week: Rising volatility and falling equity prices. Volatility levels continue to reflect the liquidation event in the Nasdaq. Uncertainty around future economic growth and financial stability will keep levels elevated for some time to come.
USD DOLLAR INDEX
Price structure:
Solid resistance remains at 93.75 as this 3 month sideways consolidation continues, a breakout either higher or lower below 92.10 will be decisive as these low volatility consolidation events lead to high volatility movements.
Indicator: Relative Strength
Bearish divergence remains, from early September.

Comments from last week: It seems the whole world is consolidating, the USD index remains within the defined boundary resistance at 93.75 and support at 92.10.
This consolidation is playing out in the Gold index and remains the greatest threat to the equities market. Commodities players are looking for a weaker USD to support metals prices. While a stronger USD would pressure the economic recovery in the US as goods and services become more expensive.
WTI CRUDE OIL
Price structure:bThis commodity is news driven around supply demand.
The potential sell signal has been avoided in the reversal from the retest 2 weeks ago of the $35.81 level.
The current “pivot point” is a bullish signal for further gains.
$42.00 will remain the first resistance level and the level to hold should a breakout occur.
Indicator: Relative Strength
RSI has made a sharp recovery over the key 50 level, a very good signal of increasing positive price momentum.

Comments from last week: The ascending pattern has moved into breakdown, the intra week support at $35.80 will be the key level to hold in the coming days. A breakdown from this level would be at risk of continuing the already in place Primary down trend in to a retest of the 2016 support level of $29.20.


 Access +10,000 financial
instruments
Access +10,000 financial
instruments