
Trading ranges and consolidation remain the key observation of last week’s price action.
As the World contemplates rising inflation and economic pressures from 3rd and 4th wave Covid outbreaks, prices continue to work within support and resistance ranges.
Historically the current Q3 to early Q4 is a volatile period as earning reports are processed and companies re-rated.
The Nasdaq, S&P500 and Dow30 have put in two negative weeks as the winds of “risk off” continue to sweep across the markets. The catalysts for a (20%+) full correction are not in the market, however profit protection remains the theme.
Gold and Silver continue to price within trading ranges, both putting in negative weeks, the metals remain highly tradable both long and short, however a Bull market in the metals remains elusive.
XJO WEEKLY
Price structure:
Last week shows an Inside range, indicating the market remains in balance, so the breakout either way will be decisive. Looking into market structure, it is clear the large resource codes are putting a cap onto gains made in other sectors within the index. The reality remains that 7530 is the key resistance level to close above on any Weekly market gains. The tentative trendline has now been decisively broken leaving the key support levels open to being tested. The first being the 7200 area and the 6900 level.
Indicator: Relative Strength 14
RSI has remained below the 70 level after negating the potential momentum divergence signal, but as mentioned has set a new 3-month low reading.
The RSI should be monitored for a continued move below the key level of 50 to show a shift lower to negative price momentum.
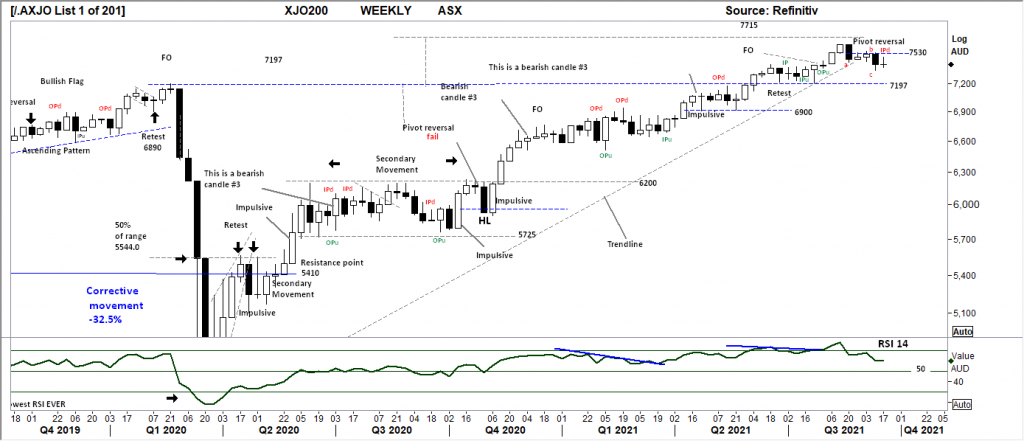
Comments from last week: Since the February lows of 2020, the XJO Index has not put in a reversal of the type that has developed in the past 4 weeks. During the close of last week, the market saw weakness in the banks with some closing strength in the resources. However close inspection shows last week has set a 6-week closing low with the Relative Strength reading a 3 month low a, b, c type retracements are a Bullish pattern, to confirm this the Index value would be required to regain the 7530 level with a strong close to confirm the Buyers are in control.
XJO DAILY
Price structure:
The Daily chart shows a clear Bear flag developing, this daily view shows the importance of the 7430 level being earlier Support and now setting resistance, last Thursdays close above was not followed through to higher prices with Friday’s close setting a 5-day low (close). The sellers have control of prices, 7216 remains the next lower support level.
Indicator: Relative Strength 14
With the indicator remaining below the key 50 level this would be monitored for further weakness. Daily price momentum is now regarded as negative.
Indicator: VOLUME
High volume on last Friday is the settlement of Thursday’s Options expiry, high volumes indicate the volatility in the market leaving many options series both Calls and Puts in the money and open too automatic exercise and the buying and selling to stock to cover.
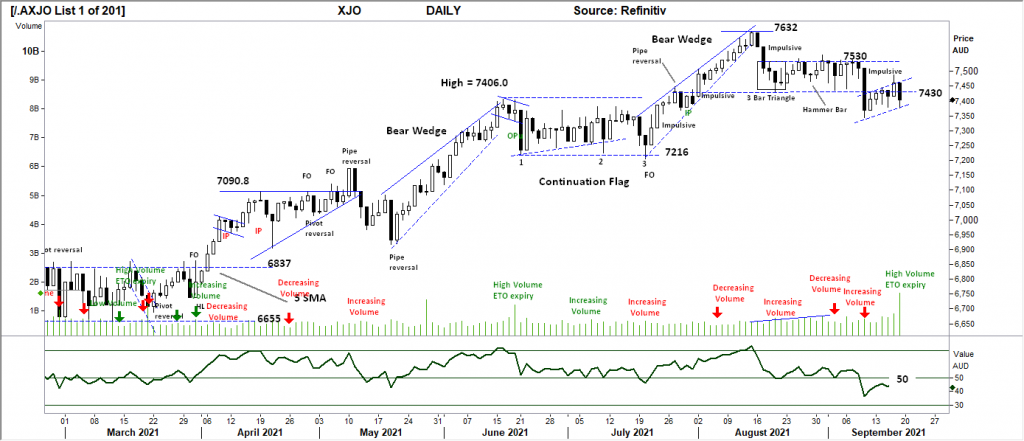
Comments from last week: A significant impulsive price move following many attempts to break out over 7530, the most important observation is the “retest” of the breakdown level at 7430. What could have been a breakout higher has failed and the breakdown is now underway. Traders would watch the short-term resistance of 7430 for further selling, in the coming days. This 7430 level will provide the first signal for the long side traders that the lows may have been set.
S&P 500 WEEKLY
Price structure:
A short-range week last week, but a down close and new 4 week low outside of the defined rising wedge pattern. This may be regarded as the first real reversal signal of the past 12 months and should be taken seriously. Several support levels remain to be tested, the first at 4320, this will be the further and real test of this current price weakness being displayed.
Underlying Primary trend remains “UP”.
Indicator: Relative Strength Indicator 14
Relative Strength has again remained below the 70 level, in line with the underlying price decline. The Sell line is shown around the 65 level, this has now been reached. It can also be observed that the RSI can track sideways below the “70” level and above the 50 level as price creep/consolidation takes place.
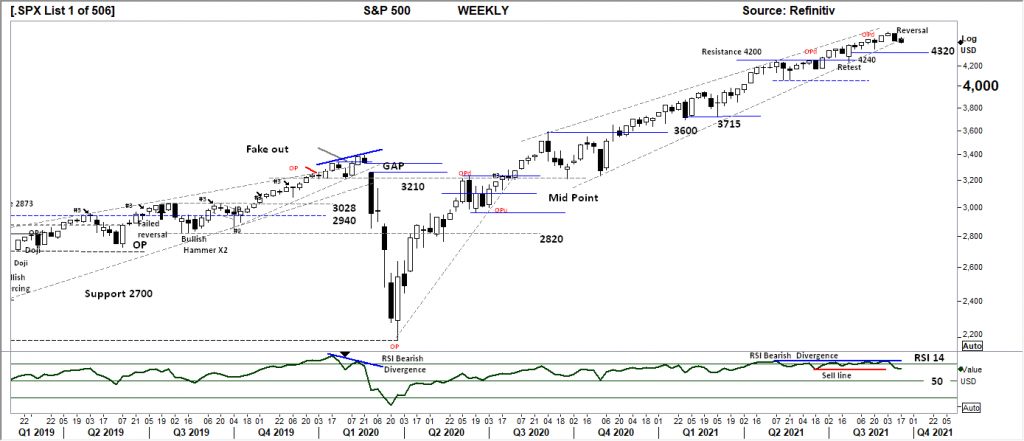
Comments from last week: Last week saw a large range bar (reversal) testing the lower parameter of the Wedge pattern. This type of movement is common within this Weekly chart, a follow through and breakdown of the wedge would set this apart from other previous observations and attract further selling with the potential to see 4320 tested in the coming week.
S&P 500 DAILY
Price structure:
The daily chart gives a better short-term perspective with price closing below the first level of support at 4444. The daily trendline has been broken decisively, in this case support levels have to be used as a gauge to market sentiment. Overall, the daily price is within a trading range albeit closing at the low side. Further weakness may target the 4367 level.
Indicator: Relative Strength 14
The RSI moving below the 50 level would indicate a loss of price momentum and would be viewed as a signal for price to retest the support levels at 4367. Price momentum is now regarded as negative. This is now at risk of moving to the 30 level on an underlying bearish momentum price movement. Traders will now monitor the RSI for a movement above the 50 level to confirm any Bullish price action.
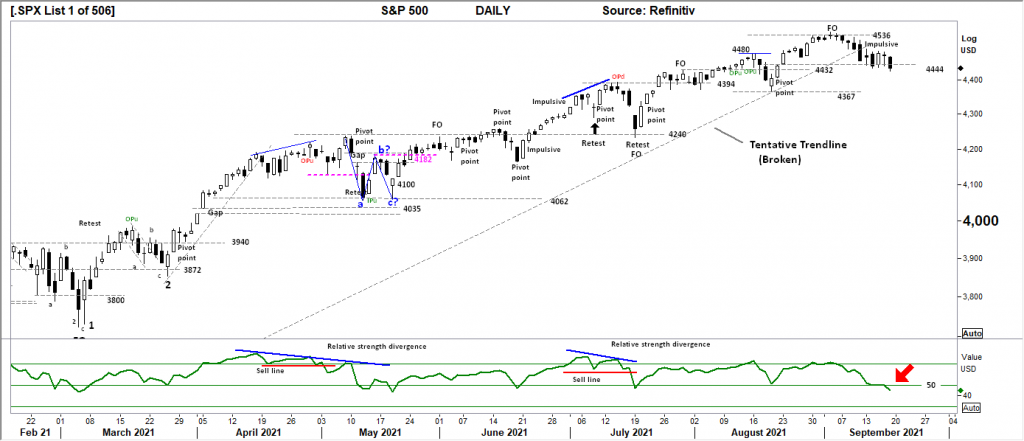
Comments from last week: Last week’s commentary mentioned a large range reversal could be the first observation of an overall reversal in price trend. Last Friday the S&P traded a large range bar also breaking the tentative trendline and the small support area of 4464. This type of committed selling clearly has the potential to follow through lower in the coming days. To remain Bullish price must close above the 4464 level to regain buyer confidence. A small price GAP is showing at 4444.0, this level should be monitored for price reversal patterns. A breakdown to 4367 would place the S&P into a trading range environment.
NASDAQ DAILY
Price structure: This Index is the most concerning for traders
The first short term trendline is now being challenged with the next support shown at 15184 as the go to level on further weakness in price. With 9 down close days in the past 15 the “key reversal” bar of Friday 2 weeks ago shows the Bears taking control of price as the first resistance level of 15534 came into play last week. Last Friday’s close reaffirms this premise. Within Nasdaq stocks there has been some extraordinary gains over the past 12 months, traders should expect some consolidation and profit taking.
The Nasdaq remains within the definition of a Primary UP trend.
Indicator: Relative Strength 14
The Relative Strength Indicator has turned lower last week. The first bear signal can now be gleaned from the RSI with the move below the 50-level indicating negative price momentum.
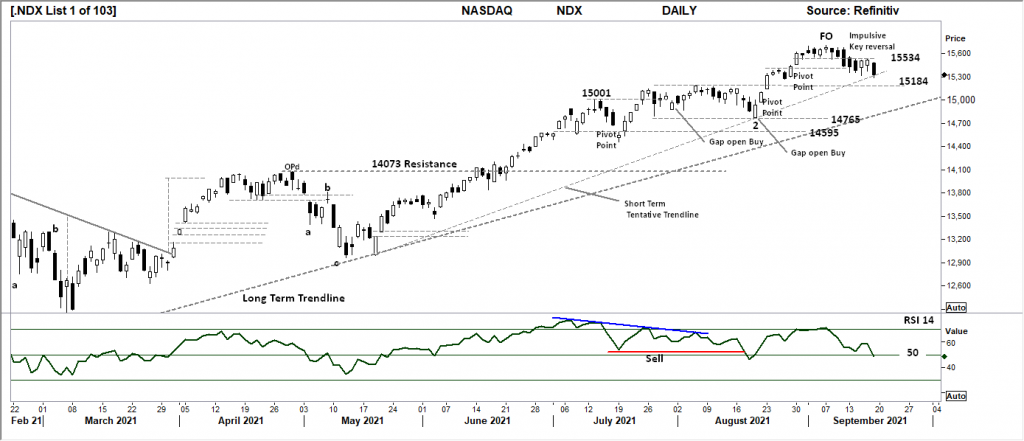
Comments from last week: This key (large range) price reversal has broken 15534 short term support. The lower levels of 15184 at the short-term trend line is now the key level to hold on further weakness. A retest of the initial breakout at 15184 could be viewed as a bullish consolidation, putting this as the level to hold would alert the trader to a potential retest of the lower trend line on price weakness below this now key level.
USD Spot GOLD – DAILY
Price structure:
No Bull market here, not even a signal. The inflation hedge is not working. The current price move below $1764.30 has been decisive with the large range bar of last Thursday. The first observation is for the Weekly trendline to be tested in the coming days, as Friday’s movement has “back tested” this important level and closed towards the low of the session. Gold has remained within a large trading range with $1834.0 as resistance and $1764.30 as support, this key support level has now been breached on a strong momentum price move.
Indicator: Relative Strength 14
The Relative Strength moving below the 50 level is heading back to the 30 level, a signal of decreasing price momentum and should again be monitored for a further move lower.

Comments from last week: Comments from last week have clearly been wrong, with Gold rejecting the $1834.0 level with an impulsive price movement lower to again find support at $1788.0. The trading range developing similar to the June – July period this year could be a bullish signal IF the $1788 level holds. The final trading days of last week indicate this level may not hold with the prospect of a further price test of $1764.30 underway.
SILVER DAILY
Price structure: The Silver Bulls are wrong.
Silver is clearly the weaker of the two frontline precious metals. Silver last week, set a 12-month closing price below $22.50. The potential Fake out low (FO) where price crosses below a previous spike low point, is the current observation, only price trading back over this level would give a small bullish signal.
The favoured move is to retest the $21.60 level in the coming days.
Silver remains within the definition of a Primary down trend.
Indicator: Relative Strength 14
Current Relative Strength is now viewed as lost upward momentum, with the continuing movement below the 50 level. The 30 level is easily the first target, here traders should look for a swing bullish divergence signal as the first sign of real support.

Comments from last week: Commentary around Silver from last week also clearly wrong with further immediate rejection of the down trend line and failure of the Strong close of Friday 2 weeks ago to follow through higher. This chart has again turned bearish in line with the existing Primary downtrend from the May 2021 high price area. The OPd (outside period) is often a turning point following an extended price movement. The current 5 bars of price decline do not fit this requirement. A strong close over the downtrend line is required to shake the sellers who have again taken control of the price action.
AUD GOLD DAILY
Price structure:
The lower high set below the $2477.0 is a bearish move in the $AUDUSD gold price, and indicates the potentially bullish a, b, c pattern has failed with a new low being made. The potential is for a move to retest the $2326.0 level. This would require a weaker $USD gold price or a rally in the $AUD or both to some degree. With the current $AUD declining in line with Gold, at best observation is consolidation of price at these key levels and remains between resistance of $2541.0 and support of $2360. This should see some further consolidation of the current low prices in Australian Gold producers.
Indicator: Relative Strength 14
Relative Strength moving back below the 50 level is in line with price movements. Price momentum has again turned negative, further declines in price will see the RSI decline further.
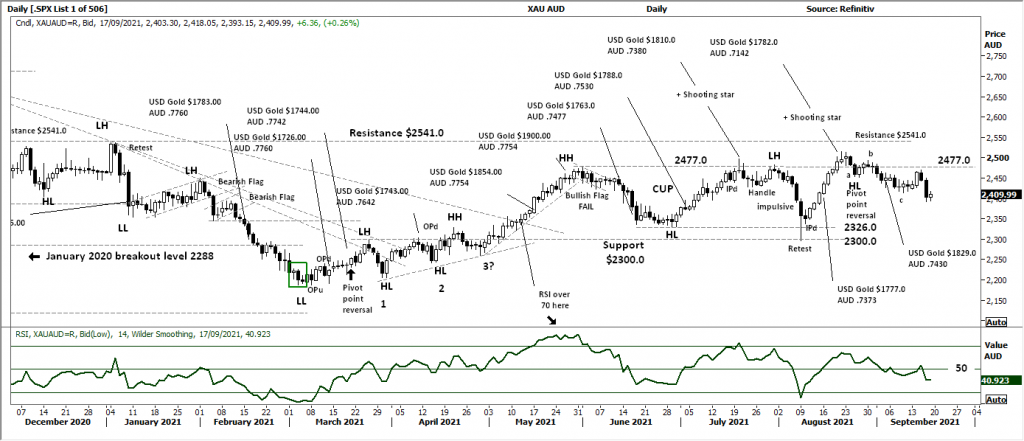
Comments from last week: The current trading action of $AUD Gold is described as a secondary reaction (overlapping price bars), this is often a bullish signal. The a, b, c type retracement is also confirmed with the current retracement, also bullish.
2477.0 remains the key resistance level for price to cross.
AUDXAU remains within a large consolidation pattern, however there is potential for the current retracement to set a new higher low as a precursor for a breakout higher to test the $2541.0 level.
COPPER DAILY
Price structure: LME Inventories still remain historically low.
The best bullish indicator of 2 weeks ago has now failed with price again moving below the key level of $4.33 following what is now a retest of the $4.50 level. Last week’s range is strong and could be reviewed as a key reversal range testing the longer-term trend line. The price structure of the past 5 weeks is setting up a bearish flag pattern for a retest of $4.00 the potential move to come.
Indicator: Relative Strength 14
In line with the weekly price loss the RSI has turned lower and is at risk of again crossing below the 50 level as upward momentum slows.
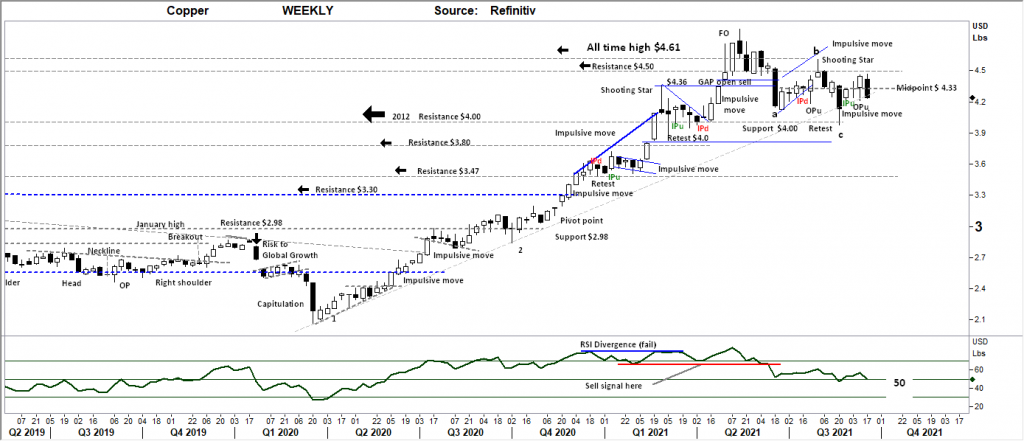
Comments from last week: Last week saw a significant price movement higher in Copper as price closed above the $4.33 level to close in on the $4.50 level. Copper still remains within a trading range, the a,b,c retracement now looks complete and will only be confirmed with a close over the “b” high price of $4.61.
Traders should monitor the $4.33 level for support on any price decline, however the closing price in the high part of the weekly range is a bullish signal for further gains.
AUSTRALIAN VOLATILITY INDEX
Over the past weeks the comments stated, “Volatilities can change very quickly on news items and trader sentiment.” Last week’s higher reading may again be an early signal of a further risk off event in the equities markets approaching.
The tenant that states low volatility precedes high volatility has held true.
Risk insurance IS being priced into the premiums as forward options are being priced higher.
The XVI is the difference of 1–3-month forward pricing of ETO Options against the current month.
As markets anticipate events, the forward priced option volatility changes, hence as forward price changes, this “skew” in pricing is measured in this XVI.
The XVI value works as an inverse observation to the underlying market.

Comments from last week: Over the past weeks the comments stated, “Volatilities can change very quickly on news items and trader sentiment.”
USD DOLLAR INDEX
Price structure:
Strong bullish day’s have underscored last week’s price movement. Although the DXY remains within a tight range of 92.07 to 93.45. Current price movements should see the 93.45 level tested; a breach higher over this level would be an important signal for the bullish for a retest of 94.70. This will bring a further bearish cloud across the FX market outside of the USD as money floods into the USD.
Indicator: Relative Strength 14
The Relative Strength has decisively crossed the 50 level to turn bullish. This is a very good indicator of strong bullish momentum underway.

Comments from last week: With the Index failing to test the 91.66 level the strong reversal from last week has ended the week as a developing Bullish flag pattern. Should a further price decline to the 92.07 level take place the pattern is viewed as weak and a further breakdown could be expected. But this chart has the potential to put in a higher low point in the coming days prior to a further retest of 93.18. The DXY remains within a trading range.
WTI CRUDE OIL
Price structure: This commodity is news driven by supply -demand.
It should be acknowledged the current price range from $61.80 to resistance of $75.20 has remained above the major trading ranges of the past several years, $66.0 being the key level to hold going forward. The WTI contract looks ready to retest the $75.20 level on a momentum move. Oil remains within the confines of a Primary UP trend. Should a solid closing price over the $75.20 level occur, this chart will be setting out higher resistance levels up to $100bl.
Indicator: Relative Strength 14
RSI set a sharp reversal from the “30” level to reach 50, look for a further rise in this indicator as confirmation of the underlying Bullish view in the current price action.

Comments from last week: Last week saw a 2nd retest of the $66.00 level, a good signal of support developing at this level. The OPu from 3 weeks ago has continued to hold the price structure. WTI oil remains within a trading range from $61.80 to $75.20. The current price structure would suggest a retest of the $75.20 level is underway.


 Access +10,000 financial
instruments
Access +10,000 financial
instruments