
Indices posted key reversal signals last week, as uncertainty enters the investing area, the Gap open sell signal mentioned last week has played out into lower prices.
However many WEEKLY equity charts are now showing a MACD buy signal and strong underlying Relative Strength.
Gold and Silver have held ground but have not made new highs within their overall Primary trend.
WTI Oil sees some profit taking following a great run into the $42 resistance level.
XJO WEEKLY
Price structure:
The last weekly bar shows a higher low and higher high wit a close towards the low of the range. Rejection at the 6200 point level has become immediate.
However last week was the follow on from 2 very strong trading weeks. Look for consolidation in the coming week.
Going forward a close below the 5756 point low would signal a complete reversal with a potential retest of the 5410 level.
Indicator: Relative Strength
Relative Strength last week moved over the key 50 level a signal of positive momentum, a continued reading over 50 would indicate bullish continuation however the “dip” should be of some concern to momentum traders.
Indicator: MACD
The first swing buy signal since Q1 2019, only shows how slow this indicator can be in reaction to sharp price movements. While now a crossover “swing buy signal”, this should be monitored for confirmation of a continuation to higher prices.
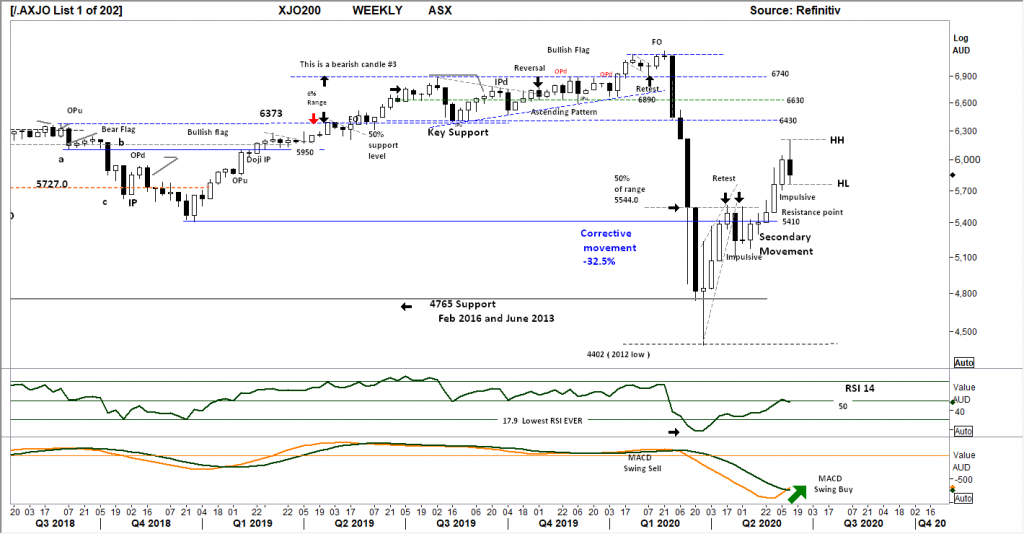
Comments from last week: A strong follow on week from the initial “impulsive” away from resistance. 6430 remains the first real resistance level to overcome, to achieve this level solid price gains will be required from the 4 Pillar banks, WES, CSL and the large miners.
XJO DAILY
Price structure:
5850 will be the daily level to hold in the coming week. Friday’s recovery close shows late buying entering the market. A further breakdown would target the daily support level of 5535 being the original breakout point during the 4th week of May. While the Primary daily trend remains UP, price consolidation above 5850 would be very positive for further gains.
Indicator: Relative Strength
RSI has moved below the key 50 and. A loss of upward price momentum would see a return to the 30 level and warn the trader of potential further price weakness.
Indicator: VOLUME
Recently daily volumes can be seen rising on down days with Volumes falling on UP days. This is typical Bear market activity. This current breakout lower has been accompanied by a high volume day, suggesting Sellers remain in control.
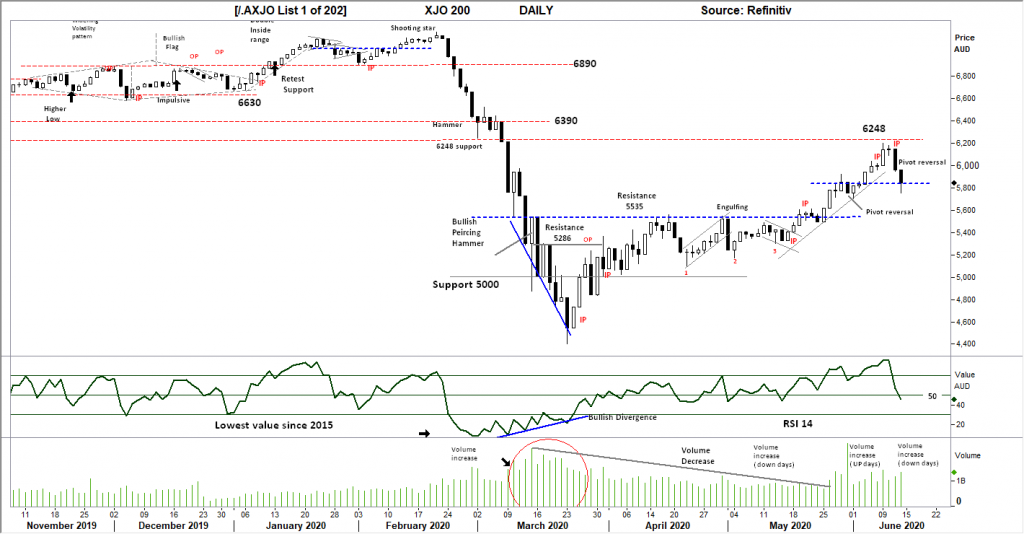
Comments from last week: A very strong trading week with each day making higher lows and higher highs until Friday set an Inside period ( IP ) as markets hesitated prior to the public holiday on Monday. Daily resistance is shown at 6248, a close above this level may indicate a short term exhaustion move, often strong momentum can lead to buyer exhaustion and profit taking.
S&P 500 WEEKLY
Price structure:
Following the strong trading range bar into the 3210 level last week’s engulfing OP (outside period) remains a signal for a top being in place. Important support levels remain in play at 2940 and 2820.
Indicator: Relative Strength Indicator
Relative Strength turning lower from above the key 50 level last week is a sign of a decrease in upward momentum, the RSI needs to remain above the key 50 level for current momentum to remain positive.

Comments from last week: The strong impulsive price move following the Gap open “sell” from 2 weeks ago has the potential to signal a “Blow off” exhaustion move. With the “GAP” at 3300 points insight, this area should be monitored for potential price reversal.
S&P 500 DAILY
Price structure:
Two weeks ago, the “gap open” warned of a potential short term top coming, the following trading days have set an “Island top”. The Gap down on Thursday has NOT followed through to lower prices at 2940 support with Friday closing towards the high of the range.
Further consolidation would be expected at these levels above 3000 points. The loss of the 300 point level would be a very bearish signal of further weakness.
Indicator: Relative Strength
RSI signal line has rolled lower again as short-term bullish momentum has been lost. The level being below the key 50 level is a signal of weak price momentum.
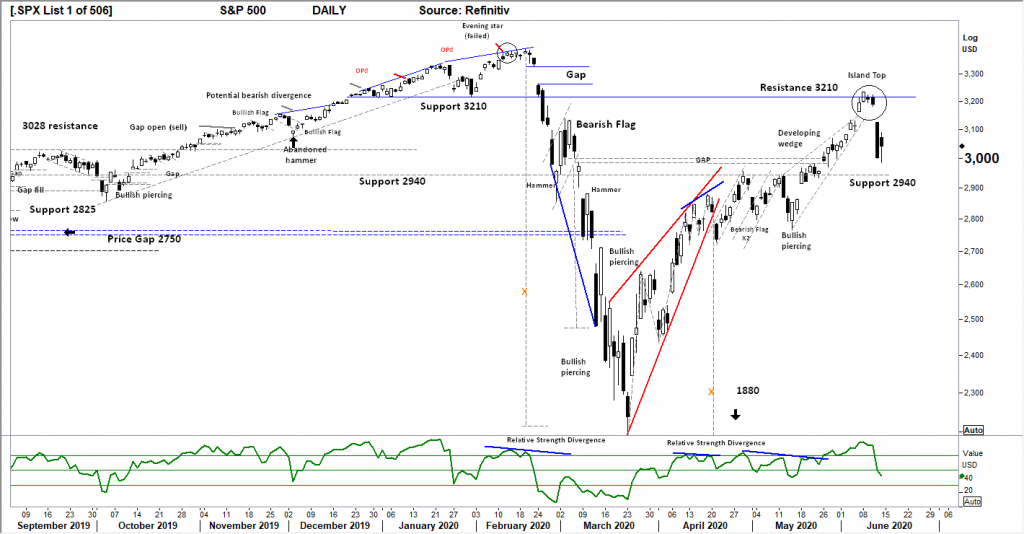
Comments from last week: Last week’s the developing “bearish” wedge set the tone for price weakness. This week the Friday breakout higher to test 3210 could be viewed as a significant “short cover” day.
In the coming days follow through must occur quickly to avoid a loss of momentum bringing in more selling at the first sign of weakness. Friday remains a Gap open day. With these types of days often short-term profit taking will take place in the following days. Without a further breakout higher look for a further bearish movement back to 50 in the coming week.
GOLD – WEEKLY
Price structure:
The underlying price structure remains in a Primary UP trend.
The bigger picture for this consolidation area below $1747 is for further consolidation! Following last week’s inside range, IPu.
Only a close over this now “key level” of $1747 would usher in further buying.
The Weekly price chart is at risk of breaking down towards the $1610.90 level
Indicator: Relative Strength
The Relative Strength Indicator has failed to make a new high in line with the underlying price, an early sign of potential consolidation as the RSI tracks sideways. However, the indicator remains over the key 50 level a sign of positive price momentum, but as the trajectory steepens lower a cross of the 50 would only highlight the already lost upward momentum.

Comments from last week: Last week the “OPd” as a key reversal bar may lead to further price weakness, the range covering not only the previous week but the previous 7 weeks may shake the resolve of short term holders. $1610 set its self up as the first support level. It shows a potential short-term top in place. The Weekly chart of Gold continues to consolidate below the $1747.00 level, while not an outright bearish pattern can be considered the April pennant breakout leading to price failure to follow through.
AUD GOLD DAILY
Price structure:
Last week showed good recovery from the 2380 level with resistance of 2563 now in front for the coming week. AUDXAU remains in a Primary down trend on a weekly basis.
Fridays low close within the Daily range may signal a short-term top in place.
Australian Gold stocks should be evaluated on an individual basis, this relative price weakness will flow through to the AUD miners price performance.
Indicator: Relative Strength:
A sign of overall loss of positive momentum when the RSI falls below the 50 level. The RSI below 30 is now indicating very weak price momentum. The long overall decline is of concern.

Comments from last week: With the $AUD strength last week printing $0.70 and higher coupled with the key reversal in $USD Gold, the Chart of Gold in $AUD terms remains in a primary down trend and a full 11% from the highs. The $2380 is critical support to be monitored in the coming week.A warning for Australian Gold stocks, while they responded strongly to the USD Gold price may be in for a reality check as the AUDXAU price falls back to the long term trend line. Traders would look for this to hold in the coming week, to maintain a bullish view of Australian Goldies.
SILVER DAILY
Price structure:
A bullish flag breakout and failure has marred the potential for further higher prices. Silver enters a consolidation pattern. Fridays close below the key level of $17.50 is not a bullish sign for the short term.
Only a breakout over the recent high at the $18.50 resistance level in the coming 2 or 3 days would set this up for further gains.
Silver is an Industrial metal and will be responsive to improving economic news.
Indicator: Relative Strength
The Relative Strength Indicator has now posted a “swing sell” signal following the divergence from price, a further move towards the 50 level would be in line with falling price, and a potential retest of the $16.50 level.

Comments from last week: The daily chart of Silver shows the potential Bullish flag forming. It is concerning the current closing price is lower than the previous HH point. This is not a sign of price strength.
AUSTRALIAN VOLATILITY INDEX
The significant move higher is a further Bearish signal for equities; however Volatility levels can change quickly, and the trader is reminded to follow the tape.
Current overall volatility levels remain the 2nd highest since the GFC.
It should concern traders the Volatility remains at elevated levels while the equities market is in a bullish phase, clearly the expectation of future price weakness is being priced in.
The XVI is the difference of 1 month forward pricing of ETO Options against current month.
As markets anticipate events, the forward priced option volatility changes, hence as forward price changes, this “skew” in pricing is measured in this XVI.
The XVI value works as an inverse observation to the underlying market.
An XVI over “13” is generally bearish for equities.
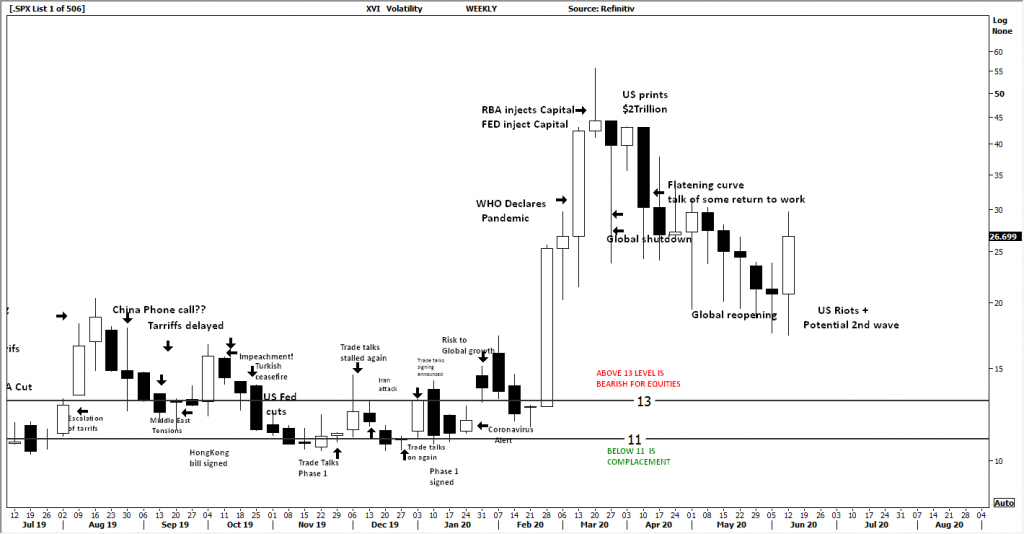
Comments from last week: And although the reading is lower this week, the most important observation is the value has maintained a relatively high reading currently at 20.7, reminding the trader this indicator has the potential to move higher in the next week. A bearish signal.
USD DOLLAR INDEX
Price structure:
Thursday’s completion of the pivot reversal saw further follow through higher on Friday, a good signal for further gains in the coming days, the flow on effect may see a lower $AUD and an improvement in the Australian dollar Gold price AUDXAU.
(an improvement for Aussie Goldies)
Look for resistance at the 98.45 level in the coming days.
Indicator: Relative Strength
RSI shows a sharp turn higher in line with underlying price making larger range days. This remains a strong signal for further gains back towards the key 50 level.
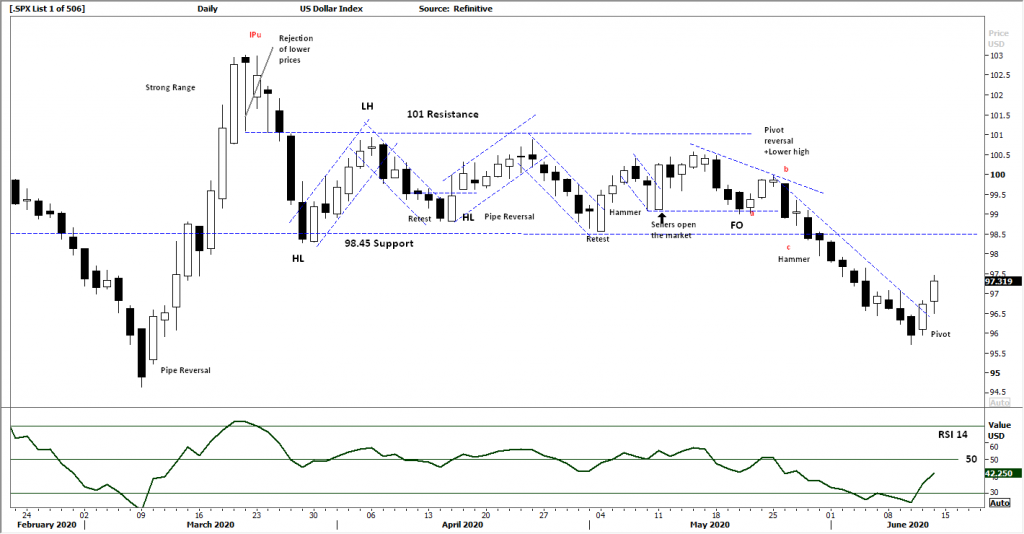
Comments from last week: Significant weakness within the USD Index with Thursday posting an OPd period, the completion of the a, b, c move may be near. Friday’s positive close may be viewed as end of week “short cover”. Monday’s trade has the potential to show the next direction. Any price gains may use the 98.45 level as resistance. The RSI has won the day, as it tracked below the key 50 level and below the 30 level showing weak momentum that has followed through in to lower prices. This can now be monitored for a potential Bullish divergence reversal setup.
WTI CRUDE OIL
Price structure: This commodity is news driven
The $42 level will be the key “test” again in the coming week. Last week reversal remains higher than the previous weeks low, a sign of potential consolidation under the now key $42.00 level. A trading range between $29.20 and $42.00 would be an overall bullish sign for the commoditiy to breakout higher in the coming months.
Indicator: Relative Strength
The key 50 level has now been crossed as a sign of increasing momentum. Look for the RSI to remain above the 50 level. RSI is a momentum indicator, so a reading below 50 would signal weak momentum and the potential for price to retest the key 29.20 breakout level.

Comments from last week: Traders should be reminded that WTI remains in an overall Primary down trend. The current price test of the lower side of the GAP is a good short term signal of price strength. A better signal would be a close over the $40 level and successful test of the $42.0 support / resistance level, followed by a short retracement to see if sellers exist.


 Access +10,000 financial
instruments
Access +10,000 financial
instruments