
There continues to be a growing concern about market valuations with the total value of the Global stock markets now at 115% of Global GDP.
Commodities continue to drive the business end of the XJO higher, backed up with solid gains in underlying prices of Iron Ore, Copper and Oil.
Forward Volatility levels continue to decline and have returned to pre Covid levels this is now underpinning current gains in the equities markets.
Gold and Silver look poised to move lower should recent support levels fail to hold the current consolidation range.
XJO WEEKLY
Price structure:
Two weeks ago, the Weekly chart of the XJO showed a Candle#3 this type of WEEKLY price action is usually a warning of price weakness 2 weeks in advance. Last week we saw rejection from the 6740 level to see the market close on the lows of the week. Following a strong run up to this level some consolidation would be expected. 6430 remains support for the coming weeks. Primary Trend remains UP.
Indicator: Relative Strength
The RSI indicator has remained over the key 50 level, however now showing a slowing advance as the indicator rolls further sideways. Combined with the Fake out signal in the chart, consolidation remains the preferred outcome. But overall the RSI remains a very good signal of Weekly improving price momentum.
Indicator: MACD
MACD remains a swing “Sell” signal again this week and has continued in developing a sideways movement, only reflecting the slowing momentum. The completed full cross over becomes the Sell signal. It should be acknowledged this indicator is very slow to react on a weekly basis and may continue to track sideways in the coming weeks as it did during 2019.

Comments from last week: Last week continued the consolidation in the Index price, behind the scenes individual sectors have outperformed the example is Commodities stocks BHP FMG RIO. The current Weekly #3 type candle has a lower shadow/wick, on a Weekly timeframe this indicates selling into a rising market, the first signal of a potential distribution top. This may not be a trend changing event, simply an indication of further consolidation in the short term.
XJO DAILY
Price structure:
The daily the new high made last Wednesday followed by a sharp reversal, this type price action has the ability to shake the buyers with profits being locked in. The Daily chart shows the short-term support level at 6510, this should be monitored in the coming days, a break of this level may lead to a sharp price movement lower.
Indicator: Relative Strength
Last week this signal was developing, this week confirms the Relative strength has developed a Bearish Divergence signal, the price has set new highs without the RSI setting new highs.
Indicator: VOLUME
During the September October period volumes on down days increased and decreased on UP days showing a lack of interest for any accumulation. The pattern has re-emerged of increasing volume on down days.

Comments from last week: Last Monday saw heavy selling only to see a strong recovery on Tuesday and without further real conviction in the short range bars of Thursday and Friday. The current array of Daily price candles is Bearish. To overcome a sentiment change in the short term a closing price over the Pivot reversal high of 6713 set 2 weeks ago in required. Current support level of 6500 point is the level to hold on any decline in the short term.
S&P 500 WEEKLY
Price structure:
Last week did not see follow through from the late November push higher. From the last pivot reversal the weekly ranges have become shorter indicating a lack of conviction from the buyers. 3400 remains the key support level should price weakness set a reversal pattern.
Indicator: Relative Strength Indicator
Relative Strength remains above the key 50 level and currently is a good signal of continuing price momentum, however the current turn lower is not a bullish sign in this ongoing trend. The RSI now needs to continue to move towards the 70 level as a signal of strong momentum. It should be acknowledged the RSI has remained above the 50 level for the past 6 months.

Comments from last week: Last week closing on the high sets a very bullish continuation pattern, there is no resistance ahead to use as a gauge of market strength. This is a time of caution. The Primary trend remains UP, however a sentiment change may see a significant (read fast) retest of lower levels around 3400. Using the 20 period simple moving average it could be considered a mean reversion move may be ahead as price remains some distance from the indicator.
S&P 500 DAILY
Price structure:
The daily OPd (outside range) has a high degree of marking turning points following an extended move. Last Friday saw the “gap” closed. This is the decision point for the Index, 3580 remains the key support level on further price weakness. There is nothing Bullish about the current price structure and traders should consider a top may be in. While the market is currently news driven around a vaccine, momentum is currently waning and may lead to further declines.
Indicator: Relative Strength
Relative Strength has turned lower, within the structure of the RSI there remains the potential for a Bearish divergence signal to develop. For this the index would need to make a new high, however the RSI should be monitored for a movement below the key 50 level as a loss of upward momentum may be underway.

Comments from last week: Last Monday displayed a very quick retest of the 3580 level before the GAP higher on Tuesday. With the close at the high of the week continuation would be expected in the coming week. An extrapolation of the trading range from August to November would ultimately target 4000 points. It is never a straight line, however the Daily and Weekly chart structure remain very Bullish in the bigger picture. This market is being driven higher on Vaccine news and the expectation of further GDP growth. This type of sentiment can change very quickly.
USD Spot GOLD – WEEKLY
Price structure:
In the immediate, Resistance $1855.00 and Midpoint support shown at $1811.00 key levels to watch in the Weekly chart. Current rejection is indicating lower prices ahead and consider should the $1764.0 level break traders would be forced to exit on Stop adding to the interest from Short selling. Gold remains in a Primary down trend. The long-term trend line remains to price target at $1650.0.
Indicator: Relative Strength
Relative Strength turns higher and remains below the “50” level. The overall declining of the RSI over the past 9 weeks continues as a bearish signal.
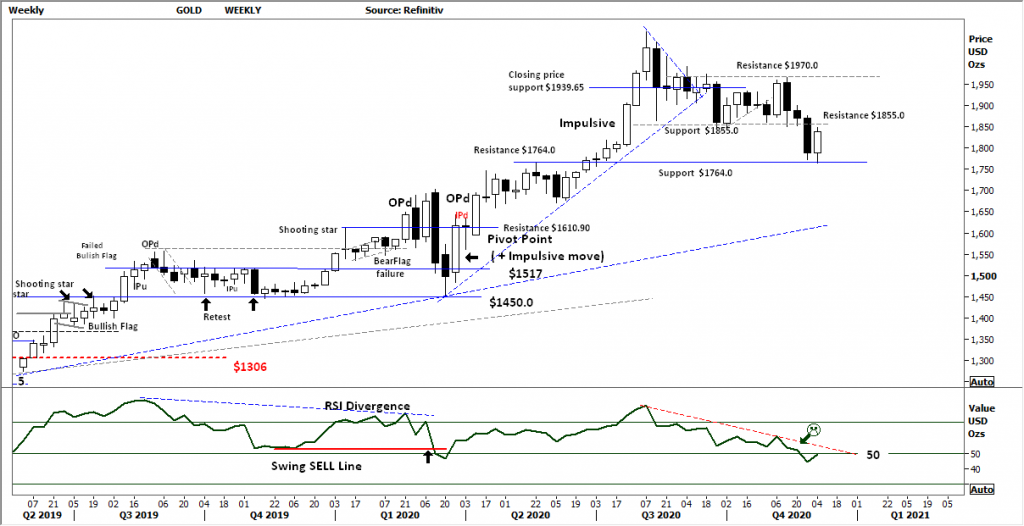
Comments from last week: The Gold price has continued to respect the resistance level of $1855, and Gold remains within a Primary down trend. Continued resistance at this level may see further selling enter the market with a retest of the long term trend-line possible, circa $1650. Should the market set a new close over the $1855.0 level in the coming week a Bullish pivot would be in play potentially bringing in further buying. This would take a news event for a catalyst.
AUD GOLD DAILY
Price structure:
This price chart of Gold in Australian dollars remains under pressure as the $AUD continues to climb higher. Local Gold producers will remain under price pressure as margins are reduced on the falling AUDUSD. $2390 remains the key support level in the coming week. Smaller Gold plays remain dependant on news flow and drilling results.
Indicator: Relative Strength
With the RSI turning lower below the key 50 level showing a complete loss of upside momentum. This indicator has swung around below the 50 level since August. This momentum indicator needs a continued swing higher in line with any price gains to confirm a valid buy signal.
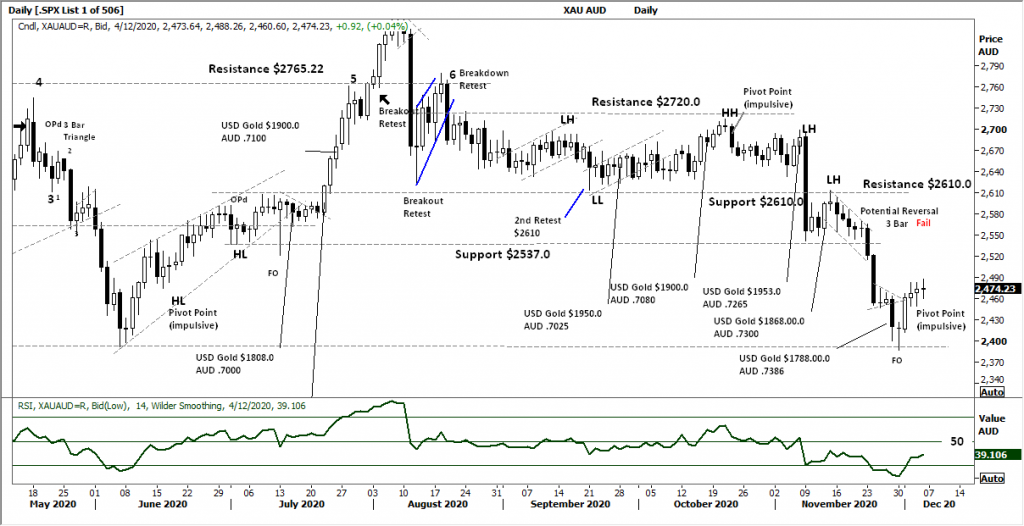
Comments from last week: Initially a good pivot point recovery in the AUDXAU daily chart, but no follow through. Further gains would see resistance set at $2537.0. Australian Gold producers will remain under pressure until the US Gold shows a bullish move or the $AUD declines relative to the $USD. In the current market neither likely to occur in the short term. The Chart remains in a Primary Down trend.
SILVER DAILY
Price structure:
During the past week Silver set a new Lower high. The expectation is for a retest of the lower pivot reversal level around the $22.30 level. Overall Silver remains within a trading range without any momentum signal form the Relative strength indicator.
A retest of the lower trend line seems evident in the coming days without any new catalyst to drive the price higher.
Indicator: Relative Strength
With RSI now moving below the 50 level as last week’s consolidation breakdown develops into a Primary down trend, a further loss of momentum should be expected.
Indicator: MACD
I have removed the MACD indicator, while the price remains with a trading channel the indicator remains a slow reactor to price swings.

Comments from last week: Silver Daily displays a Pivot point reversal without follow through as remains within a 3 month trading range with resistance shown at $26.40. These types of consolidation often leads to volatile directional breakouts, with weakness in the Precious Metals sector, that breakout may be lower as accumulation buyers along the $22.50 support level face stop loss events.
COPPER DAILY
Price structure: Inventories under pressure
A sensational move in Copper coming to an end above the $3.47 level, this level needs to hold in the coming days. Last Fridays price bar is showing indecision. Traders would look for a close below Fridays low to signal reversal of price with a potential retest of $3.30. A successful retest of this level would be a very bullish signal for further gains in the coming weeks.
Indicator: Relative Strength
Relative Strength has moved over the 70 level again underlying the strong momentum move underway. An early BEARISH divergence signal has failed, this will still be monitored in the coming week. Further confirmation of a top will be shown if price moves below last week’s low around $3.43 and the RSI moves lower inline.

Comments from last week: Copper faces potential shortages within the LME inventory system. With demand growing in the Electric Vehicle sector and GDP growth within China, the underlying Copper price is making an exponential price move through old resistance levels. The whole move remains corrective (no trend points) and has the potential to retest the historical resistance level of $3.80.
AUSTRALIAN VOLATILITY INDEX
Volatility levels are returning to pre COVID-19 levels and a level consistently BULLISH for equities as the forward price for risk cover declines. The current level can be seen as the initial breakout level from the COVID-19 pandemic alert. With the past week again dipping below the important “13” level, this remains very supportive of further equities market gains.
The XVI is the difference of 1-month forward pricing of ETO Options against current month.
As markets anticipate events, the forward priced option volatility changes, hence as forward price changes, this “skew” in pricing is measured in this XVI.
The XVI value works as an inverse observation to the underlying market.

USD DOLLAR INDEX
Price structure:
Here we are at KEY support for the USD, last week saw several lows along the support level from 2018. A very good sign of potential gains in the short term. First level to monitor is a retest of 92.10. The Primary trend for the USD remains down and will remain down should the above retest occur.
Indicator: Relative Strength
A complete breakdown of the Relative Strength to move below the “30” level, the current swing lower is a significant implication for further price weakness. The upturn in the RSI from below 30 is a good early sign of changing momentum from down to UP.
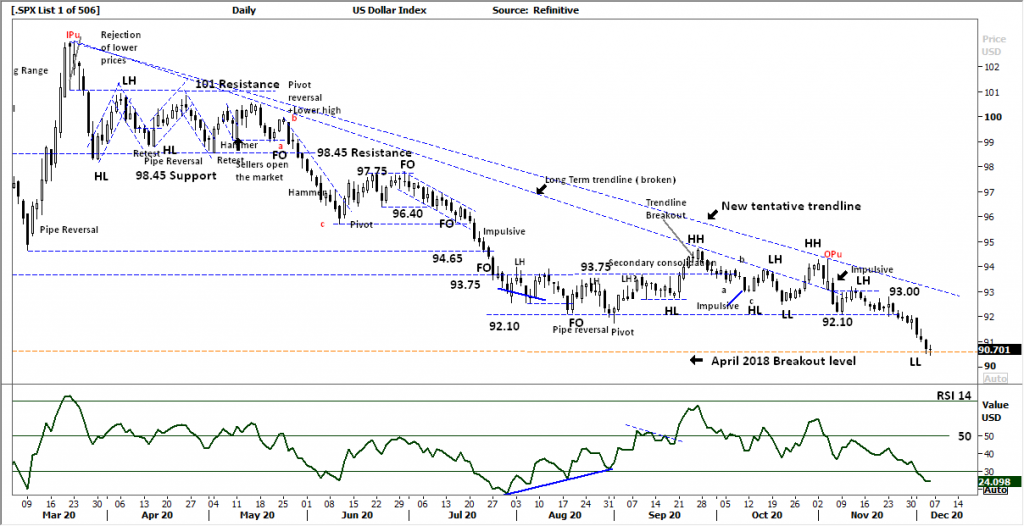
Comments from last week: The USD Index remains in a Primary downtrend, the breakdown below 92.10 remains untested as the Index value grinds lower. This week saw the 90.7 level tested as the support level from 2018. The ultimate result is pressure in Gold pricing along with a rally is associated currencies $AUD, $EUR, JPY
WTI CRUDE OIL
Price structure: This commodity is news driven by supply -demand.
WTI has entered a Primary UP trend with the first real test to reach $50.60. Last week saw some indecision again as the US locks down during the current Covid spread with the potential to increase storage inventory levels.
Indicator: Relative Strength
RSI turning higher over the 50 level remains in a very good place for further momentum price gains, but can be seen “rolling” over now above the 70 level is signal of slowing momentum.
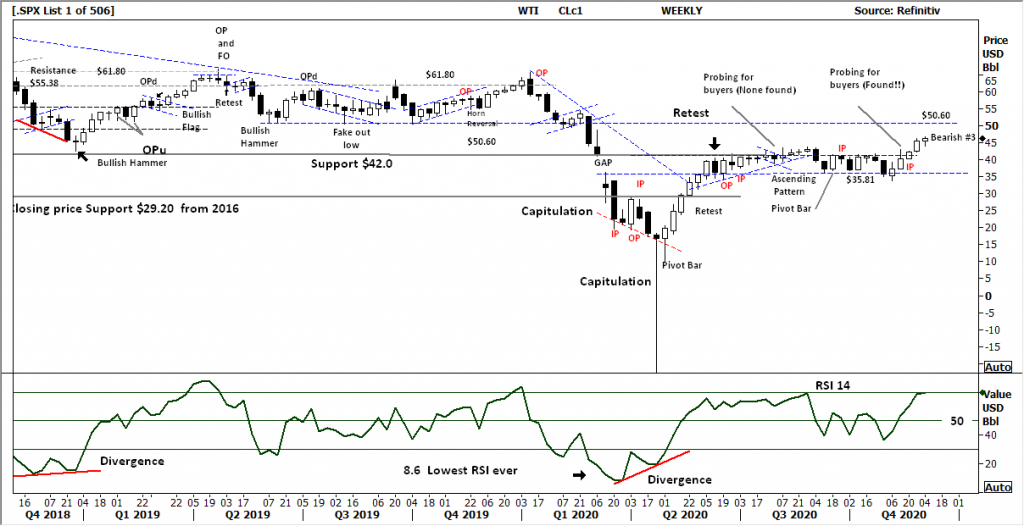
Comments from last week : Although the Oil price closed towards the high of the Week, the lower shadow developed earlier in the Week remains a Bearish signal for the coming 2 weeks. WTI has entered a primary UP trend, however any price weakness should be monitored to see the $42.00 support level hold.


 Access +10,000 financial
instruments
Access +10,000 financial
instruments