
With the Nasdaq pushing higher into Friday last week, there is good Bullish chart structure also to be found in the S&P 500 and DOW 30.
The potential downside for equities is the uncertainty of Virus outbreaks here in Australia and in the US and Europe.
OPEC news suggests a relaxing of production outputs, WTI oil remains at a significant resistance level, this will not help the underlying price structure.
Gold and silver, continue to push higher, along with the industrial metal Copper.
XJO WEEKLY
Price structure:
The weekly closing price below the Mid point of the 5 week range, could be viewed as a Bearish signal, however with the range being an Inside week the consolidation should continue sideways, overall bullish picture. A close below the 5700 level would signal a top in place while a close above 6200 would signal a bullish move underway. This is the most likely outcome given the bullish price structure of this consolidation period.
Indicator: Relative Strength
Relative Strength, still nothing to see here, sits at the “50” level, but pointing UP, suggesting a balance in price momentum remains.
Indicator: MACD
MACD remains a swing “buy” signal

Comments from last week: The Index value remains within a range 6198 to 5719. The current OPu (outside period up close) remains within this range. The closing price is at the top of the range od the bar and above the middle of the overall range. A positive setup for further gains. A weekly close over the 6198 would be very bullish for further gains.
XJO DAILY
Price structure:
The descending pattern remains intact, and has been extended to include the new Higher low at (3). This signals the coming completion of this type of pattern. With volatility falling a bullish breakout is imminent.
Indicator: Relative Strength
RSI has moved back to the 50 level showing balance in momentum, the move higher is the signal for increasing positive momentum.
Indicator: VOLUME
Daily volumes remain mixed with a slight decrease in Thursday’s positive close, this should be monitored for a directional bias.
Should the market move lower an increase in volume would signal distribution. A price breakout higher above the descending pattern line should also be accompanied by an increase in volume, this will again be telling in the coming days.
During June there is an overall general decline on trading volumes, while not immediately bullish, consolidation volume patterns often decline during this phase of development.
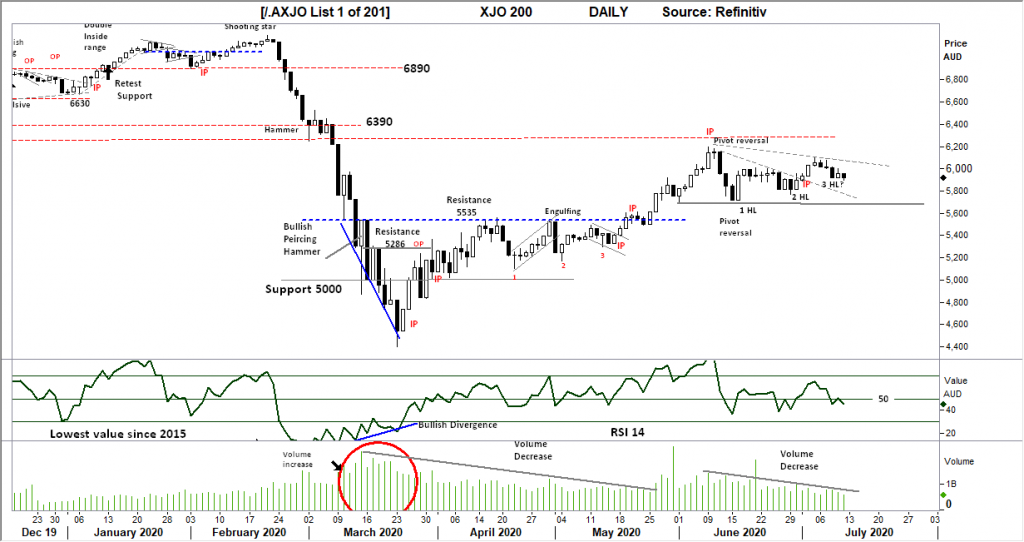
Comments from last week: The breakout of the small descending pattern sets up the retest of 6300 points. The daily underlying trend remains UP. Last Thursdays expanded range is a bullish signal, although Friday’s range was smaller, this may have been a result of that evenings US markets being closed. To remain a bullish picture a Daily close over 6198 is required.
S&P 500 WEEKLY
Price structure:
The close above the “midpoint” of the current trading range 2 weeks ago has followed through with a short range bar closing at top of its range. A good signal for further gains to test the 3210 level with the higher GAP fill a possibility in the coming weeks.
The Primary trend remains UP, with a potential retest of the 3350 highs underway.
Indicator: Relative Strength Indicator
Relative Strength turning higher from above the key 50 level last week is a further sign of a increase in upward momentum, the RSI needs to remain above the key 50 level and continue to rise for current momentum to remain positive.
Look for a move below this 50 level as a signal of bearish momentum.
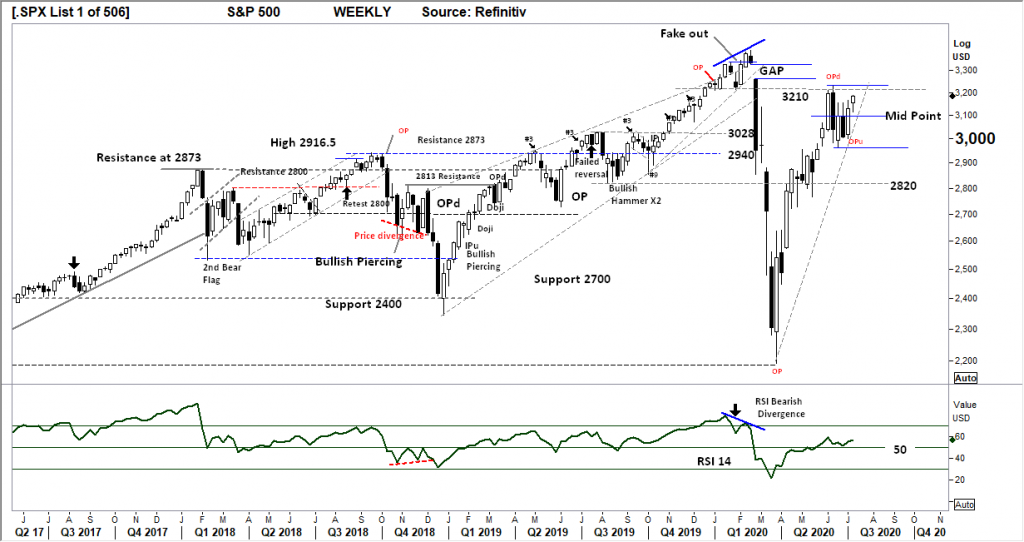
Comments from last week: The completion of a 3 Bar triangle 2 weeks ago has confirmed itself as bullish with the price closing in the high part of the range last week and above the mid-point. The weekly range also an outside period or outside range. A weekly close over 3235 will continue to put the Gap into play at 3260. This would be area to look for rejection in the daily chart.
S&P 500 DAILY
Price structure:
A consolidation week above the top of the Bullish flag now completed. Thursdays OPd has been overcome with a strong close on Friday. The small Gap from the “island top” is closed with resistance at 3210 now in play (see also Weekly note). The past week has been one of confusion in price discovery with the mixture of positive and negative closes. But Fridays closes may lead the way out of this trading range.
Indicator: Relative Strength
RSI signal line has rolled higher again above the key 50 level, upward momentum has been regained.

Comments from last week: The Daily price structure has moved out of the Bullish flag pattern to retest its high at 3154. The final bar shows as a fake out (FO) closing inside 3154. There remains 20 points from Thursday’s high to close the “Island top” Gap. The closing of the Gap will be the inflection level for potential reversal. A further close over 3233 would be very Bullish for further gains. The breakdown level for a reversal to gain weight would be Thursday’s low at 3124.
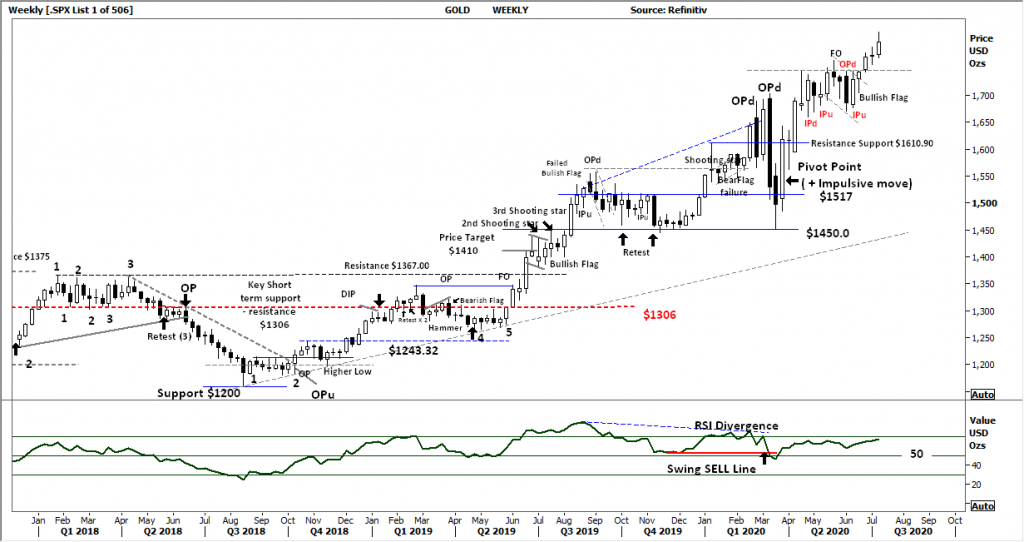
GOLD – WEEKLY
Price structure:
The underlying price structure remains in a Primary UP trend.
The whole world wants to be “long” Gold.
Good long price range week, with a not so strong close on Friday, $1745 remains the support level to hold on any price weakness in the coming week.
Indicator: Relative Strength
Relative Strength remains positive above the “50” level and has made a new high in line with the price chart. This sets up the potential for continued bullish RSI signal.
It should concern GOLD traders; the Relative Strength is not making overall new highs.
AUD GOLD DAILY
Price structure:
The Australian Gold price is at risk of a stronger Australian dollar capping overall price, while the USD Gold price is trading higher for the week and at a 9 year high, The Australian dollar Gold price remains well below the April – May period. The developing bearish wedge is at risk of breaking down lower below $2520.00 the key support level.
Indicator: Relative Strength
With the RSI now rising, the crossover of the 50 level is a good sign upward momentum may continue in the short term. However Traders should monitor this level for weakness and a potential move below the key 50 level.

Comments from last week: The Daily Australian dollar Gold price put in an OPd on Wednesday, a warning signal that a short term / long term top may be in. The chart has other OPd’s marked. The rising wedge pattern has broken to the lower side with $2380 as the bigger target. Australian dollar strength is the key to this chart, as the AUD moves higher AUD Gold value moves lower only offset by the USD Gold price.
SILVER DAILY
Price structure:
Silver is an Industrial metal and will be responsive to improving economic news.
The daily chart of Silver has made the breakout move above the $18.40 resistance with last Friday, “retesting” this level as the inevitable profit taking takes place. Wednesdays strong price move is a decisive action in the underlying UP trend. Overall higher price target remain at $20.00
Indicator: Relative Strength
The Relative Strength Indicator has negated the “swing sell” signal. The current move higher over the 70 level is not necessarily a bearish signal, but should monitored. The RSI over 70 is a reflection of underlying strong price momentum.
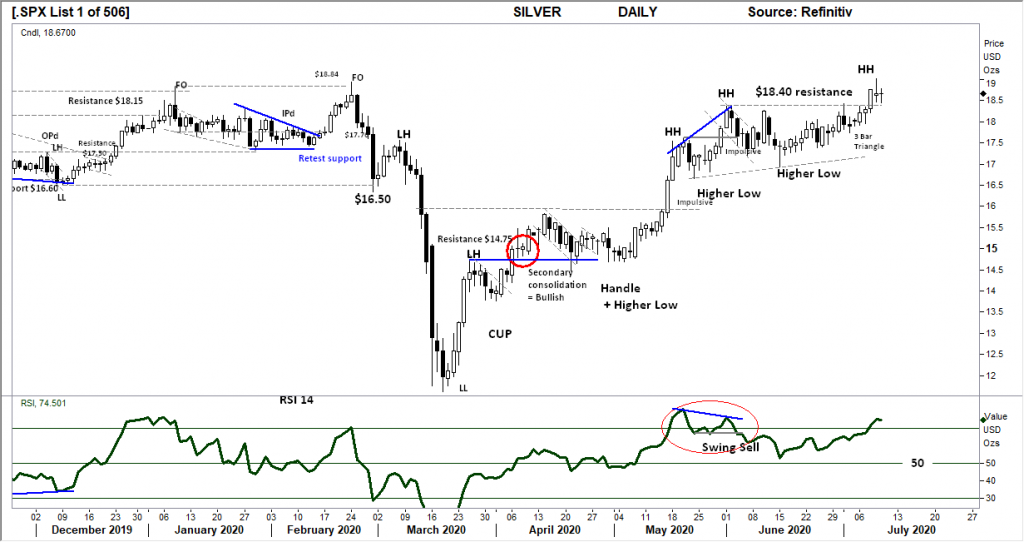
Comments from last week: Gold makes a new high, silver does not make a new high. The daily chart of Silver shows the completed 3 Bar triangle, in this case a bearish pattern as current last bar is in the low part of the 2 prior bars range. The simple “tentative” trend line would be monitored for a breakdown from this level. Silver is developing a large consolidation zone below $18.40 resistance and $17.00 support.
AUSTRALIAN VOLATILITY INDEX
An XVI over “13” is generally bearish for equities. However this current decline is a move in the right direction.
A mid week surge in volatility with a closing value of 19.77 in the lower part of the range. A good sign of for further declines towards the 13 level.
The XVI is the difference of 1 month forward pricing of ETO Options against current month.
As markets anticipate events, the forward priced option volatility changes, hence as forward price changes, this “skew” in pricing is measured in this XVI.
The XVI value works as an inverse observation to the underlying market.
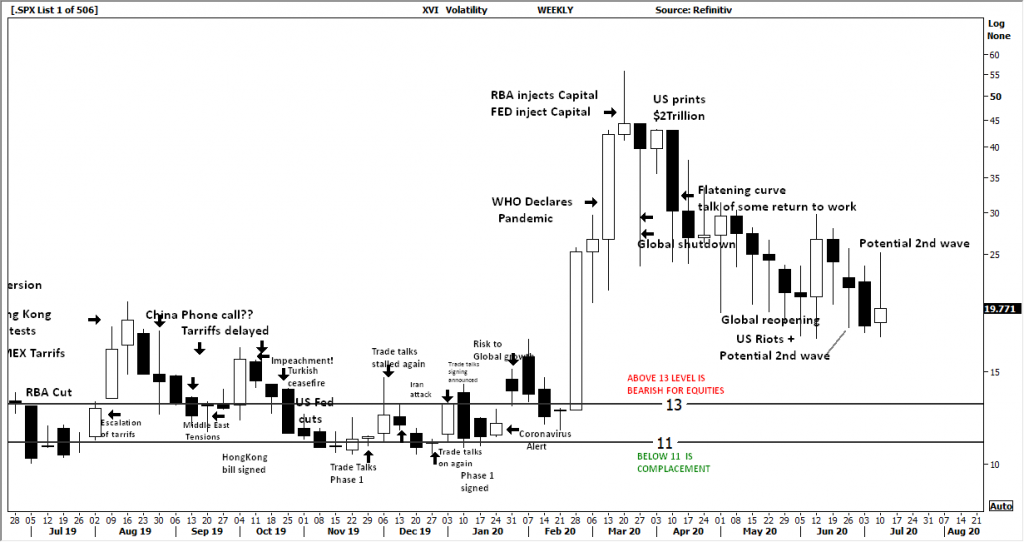
Comments from last week: Last week the XVI volatility index 18.32, has shown a decisive move lower, this remains Bullish for equities as forward volatility prices fall.
USD DOLLAR INDEX
Price structure:
Strong closing price support at 96.40 with a “fake out” (FO) bar setting a bullish start to the week. Look for a retest of the 97.75 level.
Should the Index break the lower support of 96.40 a retest of 95.5 support is the forward target.
Indicator: Relative Strength:
RSI shows a flattening move, below the “50” level, not a sign of strong momentum.

Comments from last week: Consolidation between 97.75 and 96.40. Wednesday’s hammer requires follow immediate follow through to suggest a breakout. The RSI showing benign movement is not a great signal for a breakout. However “low volatility leads to high volatility” is a market truism to be aware of.
WTI CRUDE OIL
Price structure: This commodity is news driven.
OPEC over the weekend announced the relaxing of production output, believing the restarting of economies will lift demand.
The ascending series of 6 weeks of consolidation below the $42.00 support / resistance level sets up a breakout to higher prices.
The OPEC news may dampen this observation. However the underlying price structure remains Bullish.
Indicator: Relative Strength
Relative Strength has remained over the 50 level, having set a lower high point followed by last weeks push higher is a further strong sign of positive momentum.

Comments from last week: With a very positive high close in last weeks range below the current $42 resistance level shows the Bulls pushing for higher prices. As the week finished an “inside period” a breakout will confirm the direction. The past 5 weeks have set up a small ascending pattern, look for a breakout over $42.00. Overall the Primary trend remain Down.


 Access +10,000 financial
instruments
Access +10,000 financial
instruments