
Volatility within the Nasdaq during this US reporting season has flowed into the SP 500 as many stocks are dual-listed between the two.
However, with a strong recovery last week from oversold conditions, the Major Indices have arrived at an inflexion point.
Key surveys suggest market liquidity is thin as buyers remain sceptical of Global political events in the process around Ukraine.
Gold and Silver are like the old report card “works hard but could do better”. Gold and Silver have not responded in a positive way to these events, more importantly, major support levels have held last week with the longer-term picture remaining marginally bullish.
XJO WEEKLY
Price structure:
With the previous test down to 6758, last weeks closing high at 7120 falls short of the resistance level of 7200.
IMPORTANT DISCLAIMER
The information in this report is of a general nature only. It is not personal financial product advice. It does not take into account your objectives, financial situation, or needs. You should therefore consider the appropriateness of this general information in light of these. The Australian School of Technical Analysis (www.astatrading.com) recommend that you refer to the Product Disclosure Statements of any financial products which are discussed in this report before making any investment decisions. ASTA accepts no responsibility for your actions and recommends you contact a licensed advisor before acting on any information contained in this general information report.
Last week’s inside period up close (IPu) indicates the market in balance, but the key observation will be a breakout above 7200. Further consolidation below this level would add to the premiss of a broad top being formed with the “lower high” already set from 5 weeks prior. Should a breakdown below the tested low of 6758 occur, the XJO Index would be declared a Bear market has set a new low?
Indicator: Relative Strength 14
Relative Strength has turned higher, as the reading has moved away from the 30 levels, the next move in the RSI will be telling should it move higher above the 50 levels. The Relative Strength Indicator reflects price momentum the current weekly closing price still reflects slowing momentum.

Comments from last week: The past week was marked with another large high to low range bar, with no upper shadow (wick) indicating selling from the open the sharp move below the key support level of 6900 has been overcome with the weekly bar closing above this important level. The 7200 is now resistance, for the index to set a Bullish signal a close over this level must
be achieved. The key observation is the closing price at 6988 is over the 50% mid-point (6965) of the range low to high.
XJO DAILY
Price structure:
The Month of January on average closes higher only 40% of the time. The past week’s recovery of price has not been strong, showing some indecision in the current rally. With days that “overlap” a secondary movement may be underway, the resistance level of 7216 will be the key level this week. A positive observation is a high volume on Friday’s high close.
Indicator: Relative Strength 14
The Relative Strength Indicator (14) reflects the underlying price momentum has moved sharply higher from below the 30-level indicating a shift to upward momentum. Relative Strength should be monitored for an early divergence signal in the coming days – weeks.
Indicator: VOLUME
Trading volumes have been relatively high during the past week leading to Friday’s high volume.

Comments from last week: Last Thursday set the lowest close since January 2021 (12 months) with Friday showing follow on buying from the open (no lower shadow). The inside period shows the market in balance from Thursdays late buying. To make a further bullish signal the 6900 level must hold as Support. Following a strong sell down for the week it cannot be discounted that Friday has retested the 7000 point level and closed below this level. An immediate closing price above this level may indicate a recovery in price from last weeks low of 6758.
S&P 500 WEEKLY
Price structure:
The key observation is the rejection of the 4545 level in the past week.
From the Bullish “hammer” bar of two weeks, ago the following has been limited to a retest of 4545, this will be the key level in the coming week, only with a cross above this level giving a bullish signal. The broader picture of the S&P 500 is of a consolidation range developing from Q1 2020 confirmed with the retest of 4200 two weeks ago.
Indicator: Relative Strength Indicator 14
The sharp movement below the key 50 level does signal a loss of momentum and potentially further price weakness. The failure at this important level is the key observation from the past week and will be the key observation in the coming week. Price movements are considered positive with a reading above the 50 levels, with this reading below the 50 levels the Index has accrued more loss points than gained in the lookback period of 14 (weeks)

Comments from last week: With a strong recovery into the close of the week, the S&P 500 has set a closing bullish hammer bar after testing support at 4200. The 4545 level is the next key resistance to trade through to confirm a reversal is in place. A further decline would be indicated with a follow on a Weekly close below 4320, a break of this level would have the Sellers in control and potentially testing 4050.
S&P 500 DAILY
Price structure:
The OPu from 2 weeks ago has completed its outcome with the market trading higher. The key observation now is the 3 candles “evening star” reversal set last week followed by Friday mixed range high to low with the narrow open to close. With the market at an inflexion point of 4600 resistance and 4240 support, only a close above 4600 would put the buyers back in control.
Indicator: Relative Strength 14
Relative Strength Indicator (14) has turned lower and is below the key 50 levels. A continued lower close below the 50 levels would alert traders to further decreasing price momentum. A potential divergence signal may develop at these levels, being where the RSI begins to rise on declining closing prices.

Comments from last week: Last Monday – Tuesday the S&P confirmed a 3 Bar reversal pattern as completion of the a, b, c price movement, this has set up a very bullish start to this week with the OPu on Friday. Last Friday’s large range low to high has shown buyers return to close at the high also sets the stage for a sharp recovery back to test the 4545-resistance level.
NASDAQ DAILY
Price structure:
The Nasdaq has also set a 3 candle “evening star” pattern identified by the gap on either side of last Thursday’s high candle, this also sets a reverse “pivot point”. The immediate support level to hold is 14535, the potential to retest 14076 remains as this consolidation area builds. The Nasdaq has entered a Primary downtrend.
Indicator: Relative Strength 14:
Relative Strength has moved above the 30 levels but remains below the key 50 levels, indicating very weak and or negative price momentum on the week’s price movement remains. This is the area to monitor for an early divergence signal in the coming weeks.
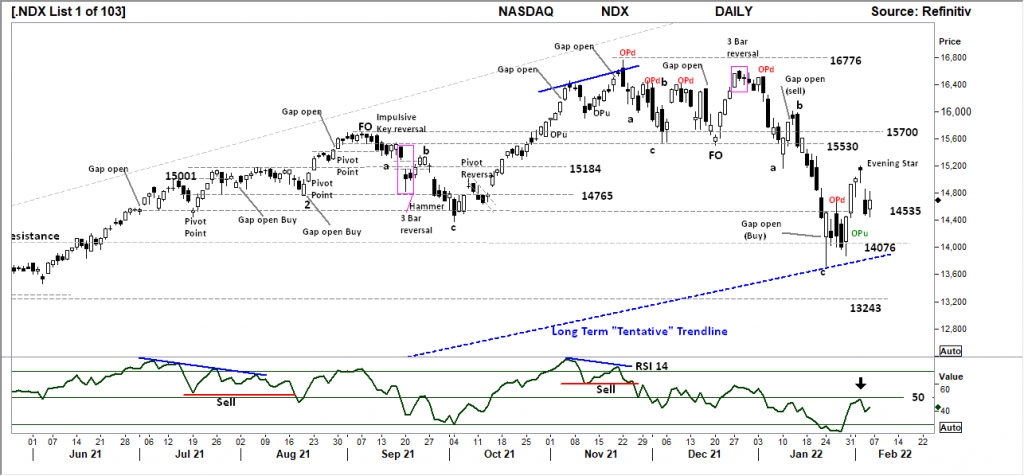
Comments from last week: The breakdown below the key 14535 level has met the June 21 – 14073 point breakout level, this is now the key level of support to hold in the coming week. The large range OPu ( Outside Period Up close) remains a key reversal signal. A further cross higher above the 14535 – resistance level could be expected this week. However, a close below this level would be a very Bearish signal with the potential to retest the 13243 points open Gap level.
USD Spot GOLD – DAILY
No Bull market.
Gold is like the old report card “works hard but could do better”. The current price developments show a Bear Flag building with the potential to again retest the long term Weekly trendline. There is nothing bullish about this chart as Gold remains with a very large consolidation period. In general, over the past 12 month period, the chart shows the down close bars to be impulsive (large range) while the rallies remain muted and of secondary market nature.
Indicator: Relative Strength 14
Relative Strength shows a reading below the 50 levels and turning lower below this important 50 level, as upside momentum continues to be capped and prices consolidate.
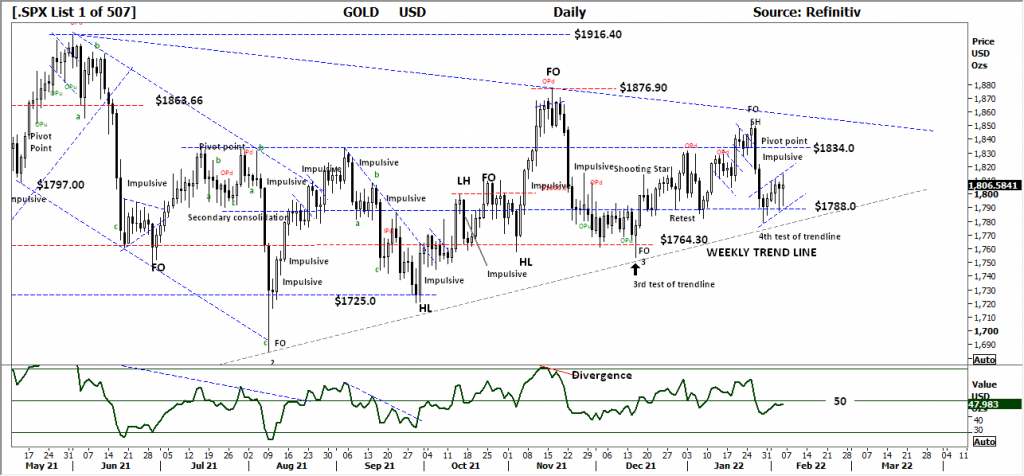
Comments from last week: Gold remains within a large consolidation zone, last weeks retest of the long term trendline is an important development following the Fake Out (FO) sell signal last Tuesday. Last Friday’s close above the key $1788.0 level is further evidence of buyer support. While NO Primary trend exists in the Gold price, this development is an important Technical observation and should be monitored for the development of a bullish Pivot point.
SILVER DAILY
Price structure: No Bull market
Six days of consolidation at the base of a sell-down from $24.50. The $22.50 level identified from the August 2020 low continues to be the resting place as rallies are sold and declines are purchased. The current “neckline” is of concern for a move lower to again retest the $21.60 level.
Indicator: RelativeSstrength 14
Current Relative Strength is moving below the 50 levels and now turning sideways shows price momentum is simply fluctuating, typical of consolidation patterns. A continuing move below the 50 levels into the 30 levels would be very bearish in the short term.
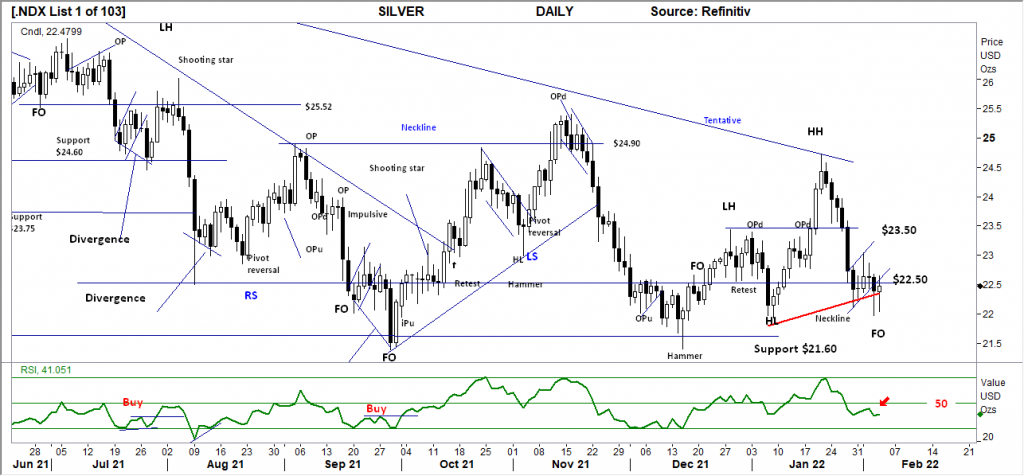
Comments from last week: The failed retest of the downtrend line has set the seller in control with Friday close below the important $22.50 level as Silver remains within a Primary Downtrend. During the equity market corrective sell down, precious metals are often sold has a general risk-off approach. The current poor price momentum may see Silver retest the $21.60 level as further selling may occur on weak price momentum.
AUD GOLD DAILY
Price structure:
The current Pivot point reversal set a new Higher low above the $2477 level a good outcome for the local producers. The potential for the $AUD to spike on any interest rate decision, thus lowering the $AUD Gold price remains a concern for the long term potential for price growth in the local producers.
Indicator Relative Strength 14
Relative Strength moving sideways has turned higher and remains above the key 50 levels from a quick dip below this key level, showing positive momentum, this ranging movement is typical with consolidation areas.
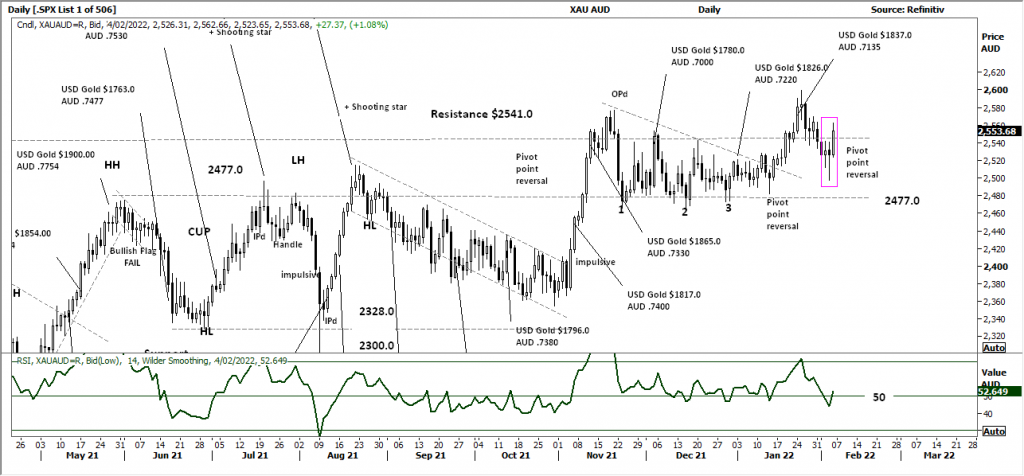
Comments from last week: The AUDXAU chart remains constructive for higher values, last weeks retest of the $2541 level has set up a 3 – bar reversal pattern if followed through may see the $2600 plus levels retested. The underlying Primary trend is UP, however, the large consolidation patterns have weighed on the overall bullish picture. Major and Junior’s Gold players remain news-driven around exploration results, production costs and financial reporting.
COPPER DAILY
Price structure:
A great week for Copper with a side by side reversal at the Trendline support to retest and close in on the $4.50 level. Although Copper remains within a large consolidation area the $4.33 level is the key support area and the potential launching place for a Bullish trend.
Indicator: Relative Strength 14
Current readings swing above and below the 50 levels reflect the current consolidation underway. The key, for now, is the RSI remains above the 50 levels as a reflection of ongoing and any positive underlying positive price momentum.
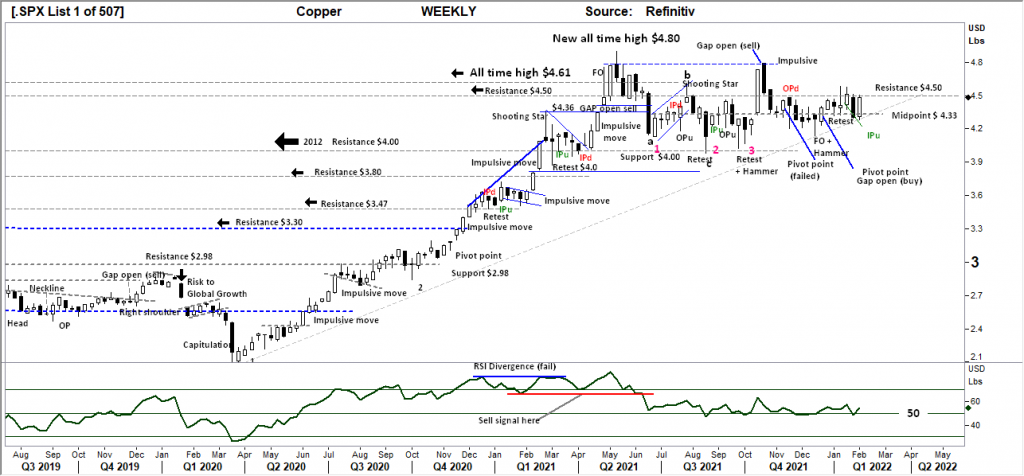
Comments from last week: Last weeks rejection of the $4.50 – $4.60 level has Copper moving to the low of the inside period retesting the key midpoint support level of $4.33 again. Copper remains within a large consolidation zone as the long term trendline is again retested. The current large range movement high to low has the potential to retest the lower support level of $4.00
AUSTRALIAN VOLATILITY INDEX
A reduction in the forwarding price of insurance (Put options) indicates a lowering of volatility within the broader equities market. This will be broadly supportive of gains for the equities market, be aware this can change very quickly on any bearish reversal witnessed in the Indices.
The XVI is the difference between the 3-month forward pricing of ETO Options against the current month.
As markets anticipate events, the forward priced option volatility changes, hence as forwarding price changes, this “skew” in pricing is measured in this XVI.
The XVI value works as an inverse observation to the underlying market.

Comments from last week: A sharp rise to an 11month high in volatility resulting from the bearish move in markets. Last Friday’s reduction in the XVI value shows forward prices for risk are coming off, a bullish signal is setting up for equities. Volatility is falling from the highs hence the forward price of protective ETO’s is decreasing in price as the “Vega – Delta” component decreases. This will be supportive of local equity prices.
USD DOLLAR INDEX
Price structure:
The pivot point in place at last Monday’s close set the stage for a move lower, any price movement higher at this level will set a new “higher low”. The recent 94.6 low and the recent high at 97 suggests a widening volatility pattern is developing, this can lead to a very Bullish break out when complete, which may take 2-3 weeks. The confirmation of this will be a move below 94.60 with a reversal to break above the 97.0 high.
Indicator: Relative Strength 14
The Relative Strength has turned lower in line with price movements and should now be monitored for further weakness as the current reading remains below the key 50 levels.

Comments from last week: Bull market moves are underway in the $USD Index as price Gaps higher. The 97.75 level remains key resistance and may be tested this week. The $USD Index remains within a Primary UP trend with 96.93 becoming the new support level to hold. This will reflect on the value of the $AUD and have inflation ramifications within the Australian economy as the $AUD has the potential to retest the $0.65 cents level.
WTI – CRUDE OIL
Price structure:
This commodity is highly news driven by supply-demand. Political events pushing Oil higher? Or just a good old-fashioned bull run in a controlled supply commodity facing higher demand? The extended range bar last week may signal exhaustion following a strong run from the $66.00 level. A retest lower may set a new higher low and continue the extended run into $100 oil and
a retest of the 2014 high at $107.73.
Indicator: Relative Strength 14
The current price strength has not produced a new high in the RSI, this will now be monitored for a developing divergence signal, although it may take many weeks to develop. The Relative Strength crossing the 70 levels is not a signal of over brought as the reading can remain strong for many weeks.
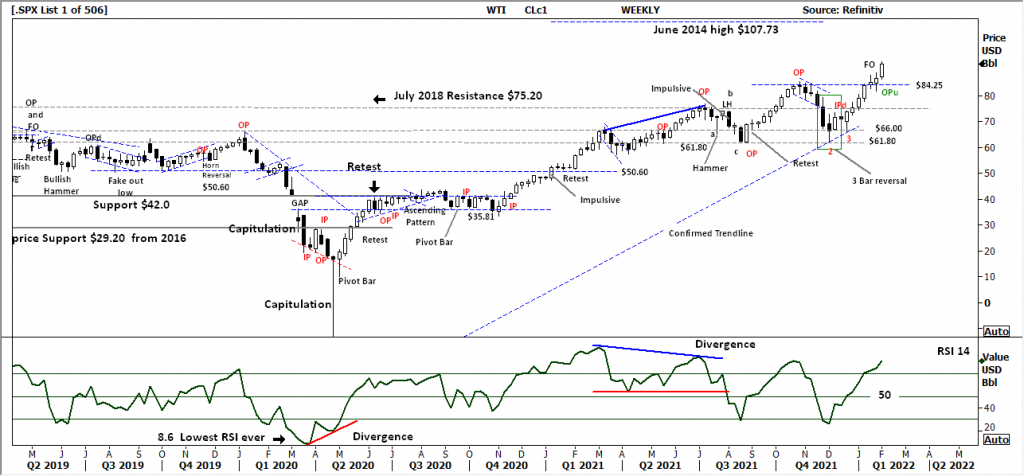
Comments from last week: Last week the WTI contract set an OPu bar. This is statistically a strong signal for a price reversal, as the WTI contract remains within a primary UP trend a retest of the $75.20 level could be expected as part of the trending process. Overall the WTI contract remains on target to retest the June 2014 high at $107.73. The confirmed trendline remains in place as the price diverges higher.


 Access +10,000 financial
instruments
Access +10,000 financial
instruments