
Global equities have posted a bearish reversal last week, the bigger picture risk is a retest of the March 23rd 2020 lows.
Gold sets up an early consolidation pattern, with the UP Primary Trend remaining in play.
Silver remains the poor cousin with further price consolidation following the recent declines.
WTI looks to be setting up a developing Relative strength bullish divergence buy signal and this week posts a bullish pivot point reversal.
Underlying forward Volatility readings remain relatively high and may continue to hold these levels in the coming days.
XJO WEEKLY
Price structure
Last week, the retest of 5544 points was met with immediate rejection. The current wedge pattern is at risk breaking down to test the 4765 level. This secondary market movement that has developed from the March lows is beginning to confirm the corrective movement into a Primary down trend.
Indicator: Relative Strength
The RSI looks to be rolling over as it remains below the “50” level, this signal the loss of upward momentum on a weekly basis. This should be monitored in the coming weeks for a bullish divergence signal.
Indicator: MACD
The MACD has been slow to react to the initial corrective price movement, and currently remains a “Sell” signal.

Comments from last week: The XJO puts in a negative week but can be seen closing off the low of the week. Consolidation at this level could be expected this week. The rejection below 5544 and 5410 is a significant blow to the buyers.
The MACD has been slow to react to the initial corrective price movement, and currently remains a “Sell” signal.
XJO DAILY
Price structure
The daily chart shows the tepid price movements to retest the Daily resistance at 5535 level. With the current engulfing range have a larger range than recent price action the potential for a follow through is very high.
Indicator: Relative Strength
RSI has moved sharply below the key 50 level as the loss of upward momentum comes to a halt.
Indicator: VOLUME
The recent daily volumes can be seen rising on down days with Volumes falling on UP days. This is typical Bear market activity as the overall volume dries up as the market reaches resistance. Fridays negative close on relative high volume, is a very bearish signal
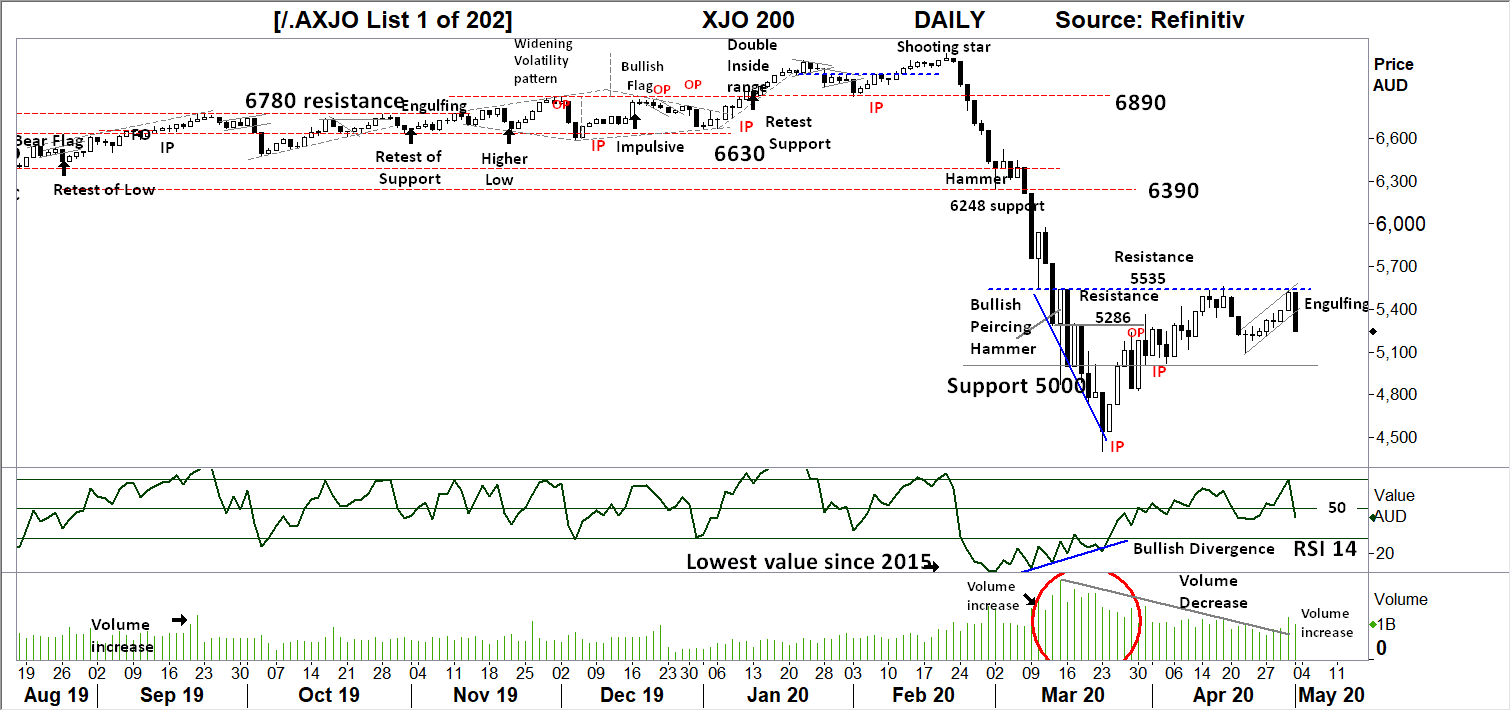
Comments from last week: A bearish picture further developing in the daily movements. A retest of 5000 seems the closet target, in the coming days a breakdown below this level would be a bearish signal for further declines to retest the lows at 4400. Only a solid close over 5535 would negate this view.
S&P 500 WEEKLY
Price structure
With resistance at 2873, last week’s “shooting star” is a warning as it follows the previous week #3 type candle (see Haguro method notes ) also a warning of reversal.
This pattern is at breakdown point, with a potential retest of the lows of 2200.
This type of BEAR Market rally can end as quickly as it developed.
Indicator: Relative Strength Indicator
Relative Strength turning lower below the key 50 level is not a great sign for the Bullish.
Over the coming weeks this would be monitored for a Bullish divergence signal.
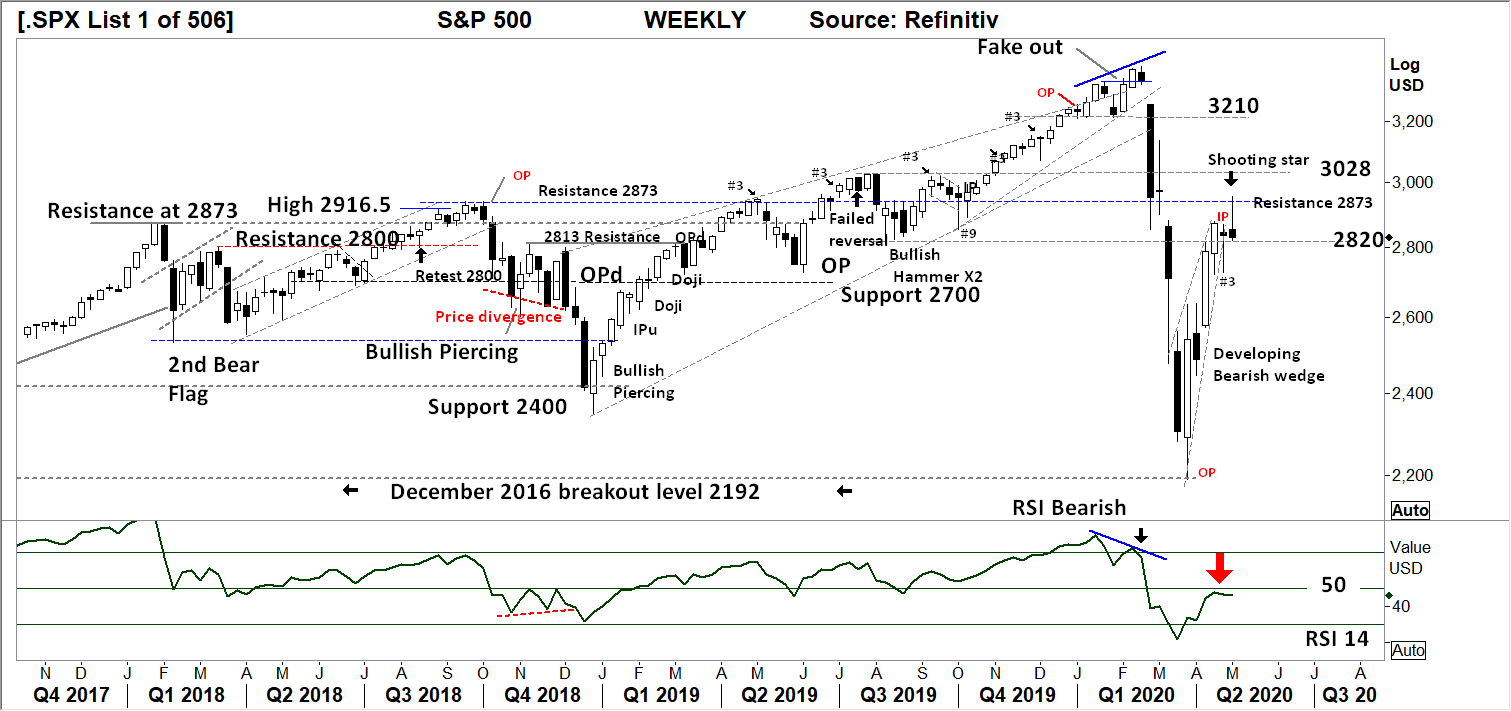
Comments from last week: The developing bearish wedge is showing signs of rejection of higher prices with the inside week (IP) testing lower prices. 2820 will be key level to hold this coming week. A loss of momentum is taking place that may gather momentum with a potential move towards 2600 points. A solid close over 2873 is required to remain bullish.
S&P 500 DAILY
Price structure
Last week the developing bearish flag has broken to the downside of the pattern and closed on the lows of the day.
Further weakness would be expected in the coming days. Traders would look for expanded daily price ranges in the coming week. Price projection suggest the index may move to 1800, although this may take many months to develop.
Indicator: Relative Strength
RSI from last weeks bearish divergence intermittently turned higher, the signal line has rolled lower as bullish momentum has been lost. Look for a further move below 50 in the coming days.

Comments from last week: Daily price structure is setting up a bearish flag pattern as the DAILY wedge starts to break down. The projected downside target is 1800 points.
A solid daily close over 2850 is required to develop a bullish view.
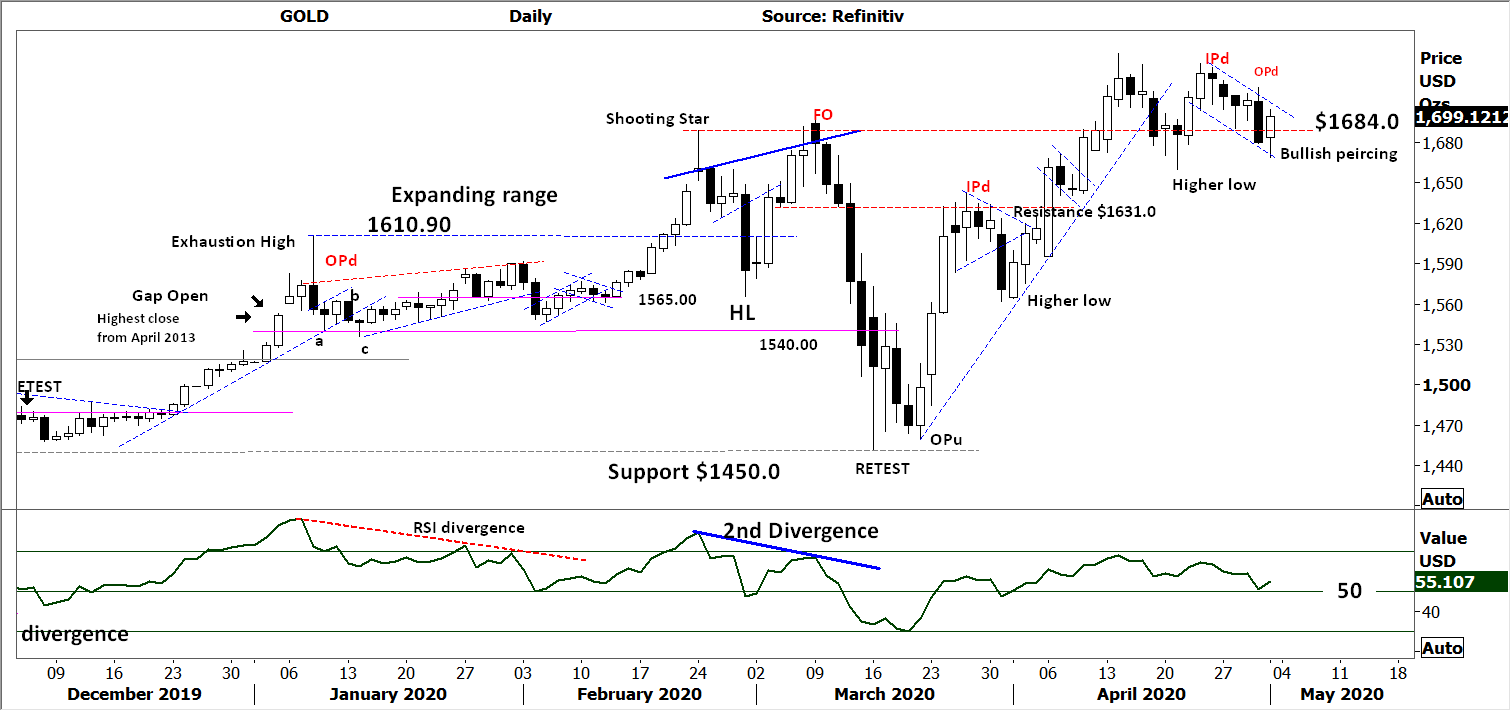
GOLD – WEEKLY
Price structure
The underlying price structure remains in a Primary UP trend.
The Weekly inside period (down close) shows the developing consolidation, the key level of $1700 is to be watched for further resistance, failure at this level would put the $1610.00 level in play for a retest in the coming week.
Indicator: Relative Strength
The relative strength indicator has failed to make a new high in line with the underlying price making a new high, an early sign of slowing momentum. Last week the RSI showed further weakness, this would be monitored for a close below the key “50” level.

Comments from last week: The rejection “shooting star” has not followed thru to lower prices. This week should be monitored for a close below the OPd high $1702.56 as the first sign of genuine price weakness.
GOLD DAILY
Price structure
The daily Gold picture is one of Bullishness with the developing Bullish flag and Friday’s Bullish piercing candle. Bullish flags have a propensity to “fail” prior to the real breakout. Failure would immediately target $1650, with the risk of testing $1610 in the coming days.
Indicator: Relative Strength
A sign of overall positive momentum when the RSI remains above the 50 level. However the RSI is working its way lower in line with the loss of upward momentum as the bullish flag develops.
Comments from last week: Friday’s IP (inside period) a signal of indecision as price approaches the previous weeks highs, the risk is a double top playing out into lower prices. First lower level to test is $1684 followed by $1631. While Gold remains in a Primary UP trend the risk of short term profit taking is showing in slowing price momentum.
SILVER DAILY
Price structure:
The Weekly Chart of Silver remains above the $14.75 level as the Bullish flag pattern breaks down and price moves sideways. The Sliver Chart remains benign, this is not a Bullish picture as confirmation for the Gold chart. $16.50 remains the preferred upside target, however the current consolidation is “weak”.
Indicator: Relative Strength
The Relative Strength has turned lower, blow the 50 level. This should be monitored in the coming days for a move higher in-line with further Bullish price movements, a further move below the 50 level would be in line with falling price.

Comments from last week: The Daily Chart of Silver has developed a bullish flag structure with last week testing the $14.75 support level. However, the breakout currently underway has been indecisive and at risk of breaking down. Silver remains in a short term bullish structure, with $14.75 being the key support level in the coming days.
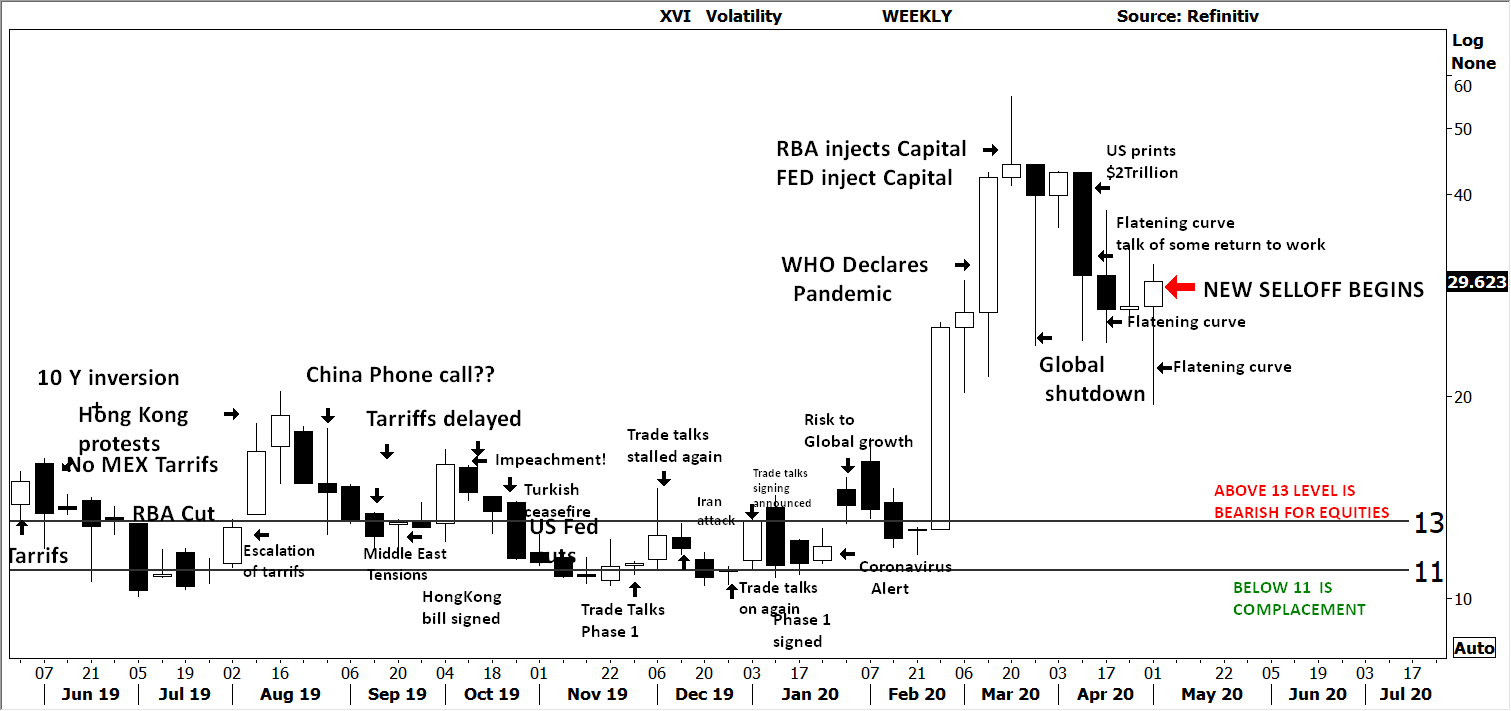
AUSTRALIAN VOLATILITY INDEX
Current volatility levels remain the 2nd highest since the GFC. The recent statistics around flattening the curve had allowed this Volatility measure to retrace lower.
Last week the level began to rise in line with loss of Bullish sentiment in the equities market.
The most important observation is the value has maintained a relatively high reading currently at 27, reminding the trader this indicator has the potential to move higher in the next week.
The XVI is the difference of 1 month forward pricing of ETO Options against current month.
As markets anticipate events, the forward priced option volatility changes, hence as forward price changes, this “skew” in pricing is measured in this XVI.
The XVI value works as an inverse observation to the underlying market.
An XVI over “13” is generally bearish for equities.
USD DOLLAR INDEX
Price structure
Last week’s retest of the 98.45 level finished with a “hammer” candle this bullish sign at the current support level suggest a retest of the highs. However the RSI remains below the 50 level a sign of weak price momentum.
Indicator: Relative Strength
Relative Strength had remained above the 50 level, however the sideways movement is a continuing sign of weak momentum as the indicator turns lower.
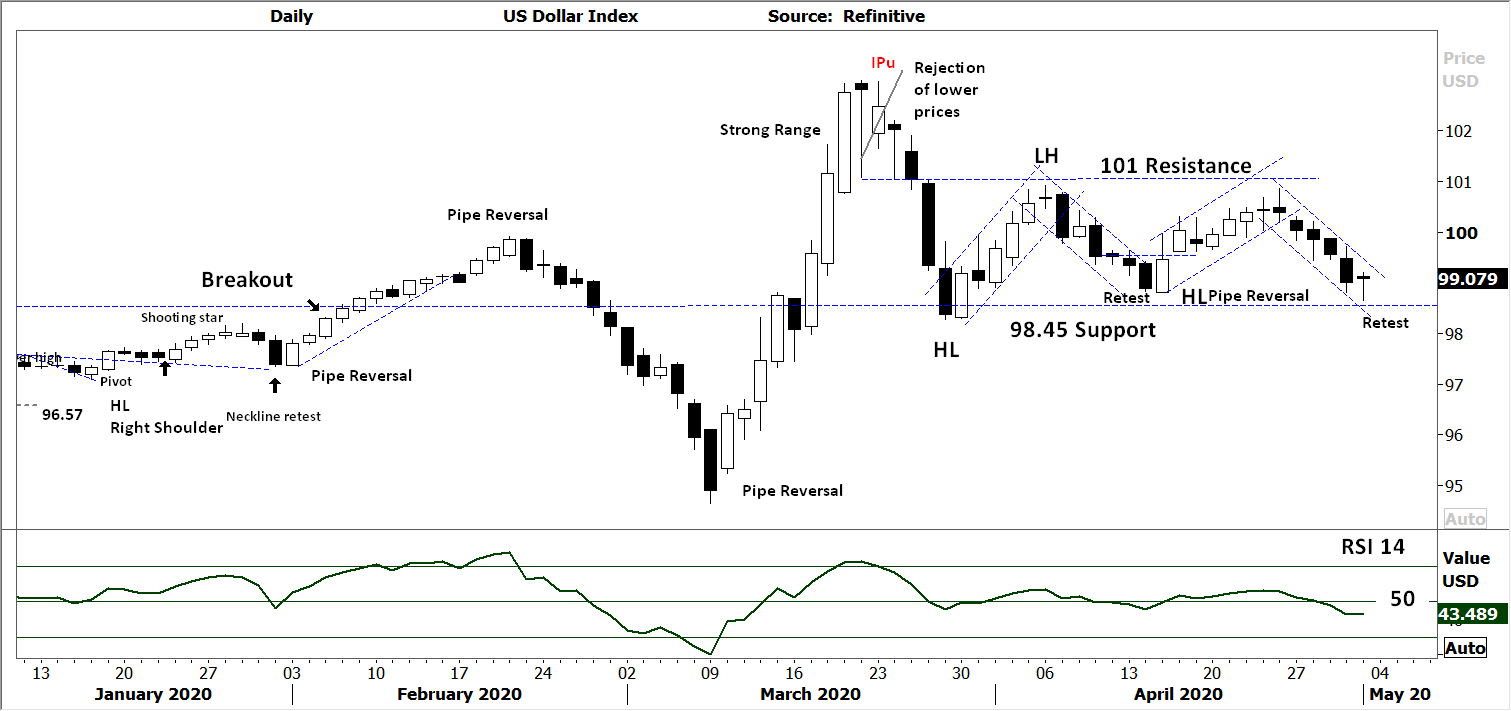
Comments from last week: USD Index remains directionless as it grinds higher towards 101.0. The current bearish structure remains in the developing price channel of 98.45 to 101.0. A potential retest of the lower level underway.
WTI CRUDE OIL
Price structure: This commodity is news driven.
Following the wash out of last weeks expiry debacle the WTI continuous contract has gained some composure as the Bullish “pivot bar” is now in place. A retest of $29.20 is the current target for traders. But be reminded the PRIMARY Trend is DOWN.
Indicator: Relative Strength
Relative Strength remains VERY weak as the reading is below 30.
The developing picture in the RSI is a Bullish divergence Buy signal, a weekly cross of the 30 level would confirm.

Comments from last week: With crude inventory levels at capacity, Oil has paid the price as demand slips away. The consolidation around the $20 level has given way to a further capitulation low. Last week’s Bullish hammer has the potential to retest the $29.20 level in the coming week.


 Access +10,000 financial
instruments
Access +10,000 financial
instruments