
A resumption of the 2019 Bull market is underway as the Primary Weekly trend resumes. The challenge for investors and traders is the underlying fundamentals still do not support higher equity values.
US Indices remain within striking distance of January 2020 highs as the Global economy attempts to resume, the test this week will be the fallout from social unrest in some US states.
Gold consolidating, Silver on a strong breakout, read “catch up” move.
West Texas intermediate current continues to higher prices with major resistance at USD $42.0.
XJO WEEKLY
Price structure:
Weekly resistance at 5544 has been dramatically overcome with a large impulsive move. The closing price being more than 30% down from the high (5922) point of the range, will be of some concern to the short term traders.
Indicator: Relative Strength
Relative Strength remains below the key level of 50, but has changed its trajectory turning higher, a reading over 50 may indicate bullish continuation.
Indicator: MACD
The MACD is rolling sideways and beginning to narrow the spread between the faster and slower indicator lines. While not a crossover “swing buy signal” this should be monitored for confirmation of a continuation to higher prices.
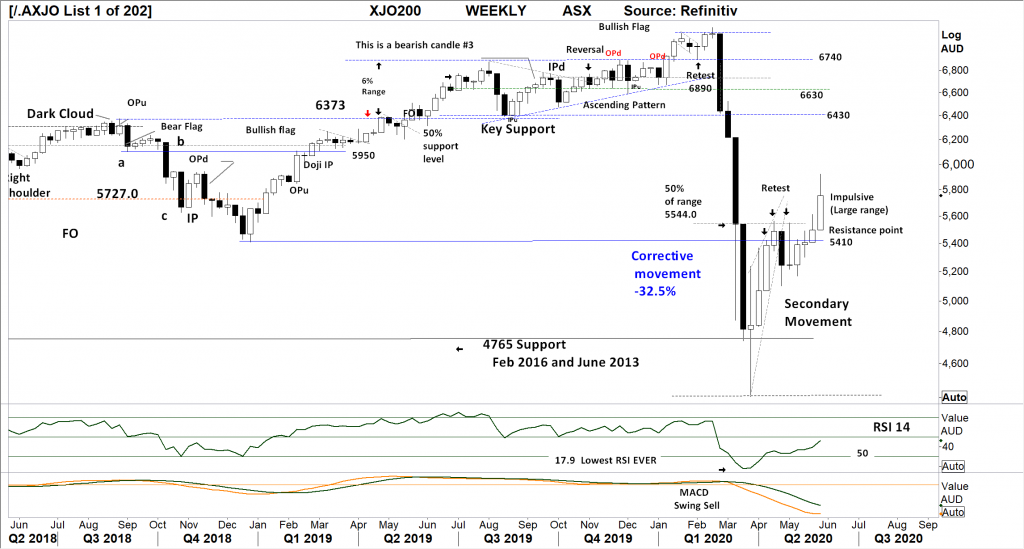
Comments from last week: Last week saw another move over the 5544 level, however the close remains below this level as selling continues. The XJO remains in a secondary consolidation within the corrective move lower. This type of secondary consolidation can precede a new leg lower with a possible retest off the lows. Only a weekly close over 5544 would negate this view.
XJO DAILY
Price structure
Following the breakout from 5535 the Daily XJO shows a pivot point rejection on Friday, this sets up a potential retest of the breakout level of 5535. To remain bullish the 5922 high of Thursday should be exceeded quickly for the buyers to remain in control.
Indicator: Relative Strength
RSI has moved above the key 50 and 70 level with last week’s sharp mid-week up turn rolling over. Any further loss of upward momentum would see a return to the 50 level and warn the trader of impending further weakness.
Indicator: VOLUME
Recently daily volumes can be seen rising on down days with Volumes falling on UP days. This is typical Bear market activity. This breakout was accompanied by high volume days, suggesting Buyers have control.
Fridays negative close on VERY high volume, is unusual and should be treated with suspicion as Friday closed off the high of the day and below Thursday’s low.

Comments from last week: The daily technical picture for the XJO remains “weak”. However the developing ascending pattern with 3 lows in place has the potential to breakout higher. A solid close over the DAILY resistance of 5535 is required to confirm any price bullishness. Traders would monitor the 4 major Bank stocks and the larger industrials Wesfarmers along with material stocks BHP, WPL, RIO for bullish price action driving the index higher.
S&P 500 WEEKLY
Price structure:
The Weekly “V” shaped recovery has been completed with a “gap open sell” signal last week. This should be monitored for a further reversal to test the 2940 breakout.
The OP from 3 week back is statistically still in play as they have a 1 to 3 bar warning of the high. ( Krastins research )
Indicator: Relative Strength Indicator
Relative Strength turning higher from above the key 50 level last week is a sign of an increase in upward momentum, currently the turn higher in minimal and the RSI needs to remain above the key 50 level for current momentum to remain positive.
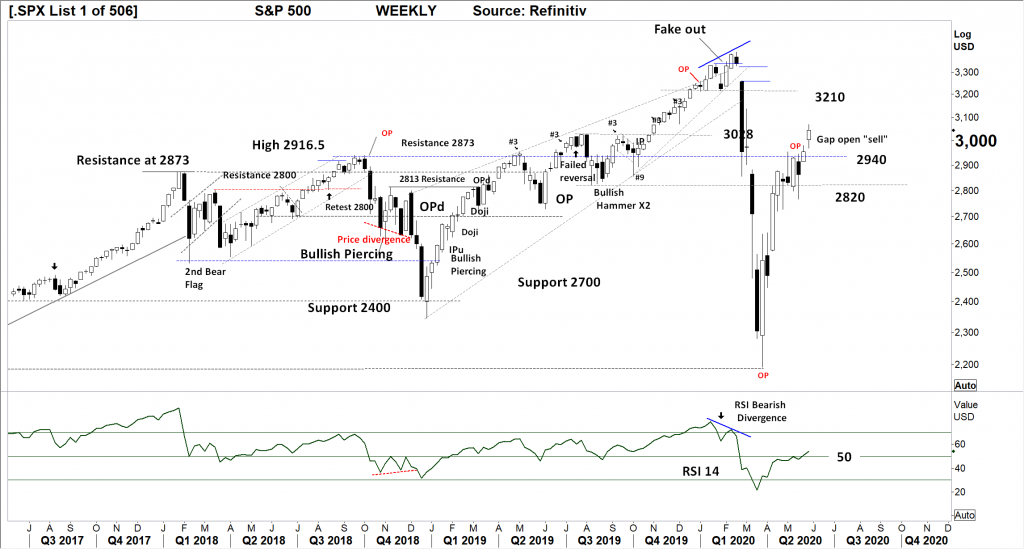
Comments from last week: A new weekly high close above 2940 resistance a sign of price strength? The small range bar last week is not a bullish signal while at this consolidation level. Line #9 from 2 weeks ago continues to play out.
S&P 500 DAILY
Price structure:
Daily price movements continue to push higher above the key 3000 point level. The developing wedge will keep the bears on watch for a break lower in the coming days. The short-range days are not a sign of strength with the overlapping ranges showing lack of commitment of the buyers.
Indicator: Relative Strength
RSI from last week’s bearish divergence intermittently turned higher, the signal line has rolled lower again as short-term bullish momentum has been lost. Without a further breakout higher look for a further bearish movement back to 50 in the coming week.

Comments from last week: Daily price ranges remain in a consolidation below the March 2020 price Gap following last Mondays opening Gap higher. Further price gains may fill this higher gap. A daily closing price below 2940 would be signal for the lower Gap to be filled.
GOLD – WEEKLY
Price structure:
The underlying price structure remains in a Primary UP trend.
The Weekly chart of Gold continues to consolidate below the $1747.00 level, while not an out right bearish pattern can be considered the April pennant breakout leading to price failure to follow through.
Indicator: Relative Strength
The Relative Strength Indicator has failed to make a new high in line with the underlying price, an early sign of potential consolidation as the RSI tracks sideways. However, the indicator remains over the key 50 level a sign of positive price momentum.

Comments from last week: Failing momentum with a Fake out movement (FO) last week, setting Gold up to test lower prices in the coming week. The Pennant breakout from 2 weeks ago has failed to follow thru with higher price last week. Consolidation at these levels would be the best outcome in the coming week. $1750 will remain significant resistance. (see RSI note)
AUD GOLD DAILY
Price structure:
A warning for Australian Gold stocks, while they responded strongly to the USD Gold price may be in for a reality check as the AUDXAU price falls back to the long term trend line. Traders would look for this to hold in the coming week, to maintain a bullish view of Australian Goldies.
Indicator: Relative Strength
A sign of overall loss of positive momentum when the RSI falls below the 50 level. The RSI is now indicating weak price momentum, a move higher would only be reflective of the underlying continuing higher. The long overall decline is of concern.
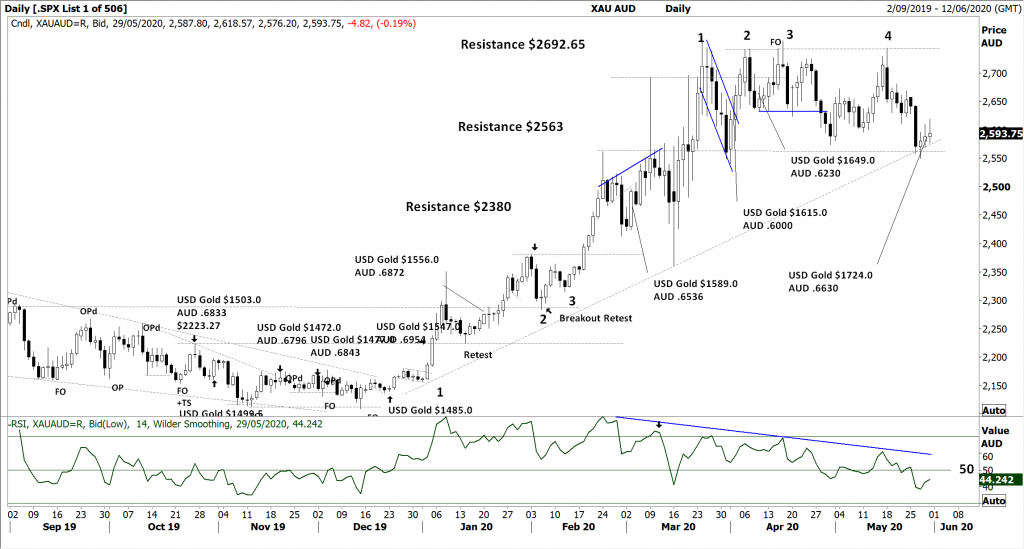
Comments from last week: A fourth high now in place as an outside period (OP). The developing ascending 1,2,3 lows is a good sign the consolidation is becoming complete. With a “3 bar” triangle now in place one move higher could be expected in the coming week. Australian based Gold miners will make longer term price moves around this underlying chart of Gold in $AUD.
SILVER DAILY
Price structure:
The Daily chart of Silver maintains the Primary move with a final impulsive move on Friday. The retest of $16.50 is complete with the metal looking to test the FO ( Fake out ) high from February. (See RSI note)
Indicator: Relative Strength
The Relative Strength has turned sideways, while remaining over the 70 level, a sign of strong momentum. This should be monitored in the coming days for a move higher in-line with further Bullish price movements, a further move towards the 50 level would be in line with falling price, and a potential retest of the $16.50 level.
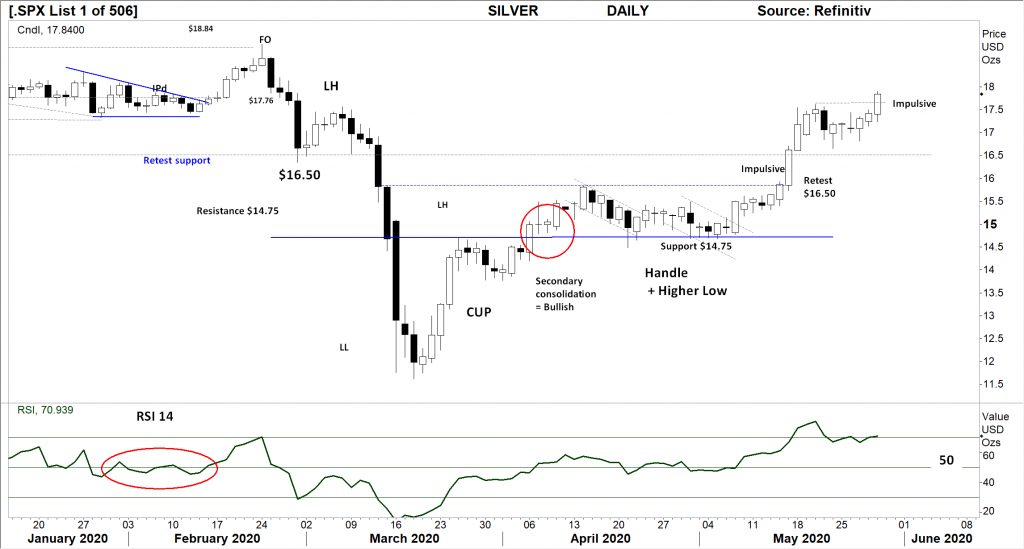
Comments from last week: Good follow through higher from Last weeks impulsive move through the $16.50 resistance level. With the retest of this level on Friday, the high close for the session is a bullish signal for a move back over $17.50.
AUSTRALIAN VOLATILITY INDEX
Current volatility levels remain the 2nd highest since the GFC. The recent statistics around flattening the curve had allowed this Volatility measure to retrace lower.
And although the reading is lower this week, the most important observation is the value has maintained a relatively high reading currently at 21.2, reminding the trader this indicator has the potential to move higher in the next week. A bearish signal.
The XVI is the difference of 1 month forward pricing of ETO Options against current month.
As markets anticipate events, the forward priced option volatility changes, hence as forward price changes, this “skew” in pricing is measured in this XVI.
The XVI value works as an inverse observation to the underlying market.
An XVI over “13” is generally bearish for equities.

USD DOLLAR INDEX
Price structure:
USD Index staged a surprise move lower this week following the expectation of a retest of 101. The breakdown below 98.45 is significant, Fridays hammer bar requires an immediate follow through to confirm the completion of the a,b,c price movement.
Indicator: Relative Strength
The RSI has won the day, as it tracked below the key 50 level showing weak momentum that has followed through in to lower prices.
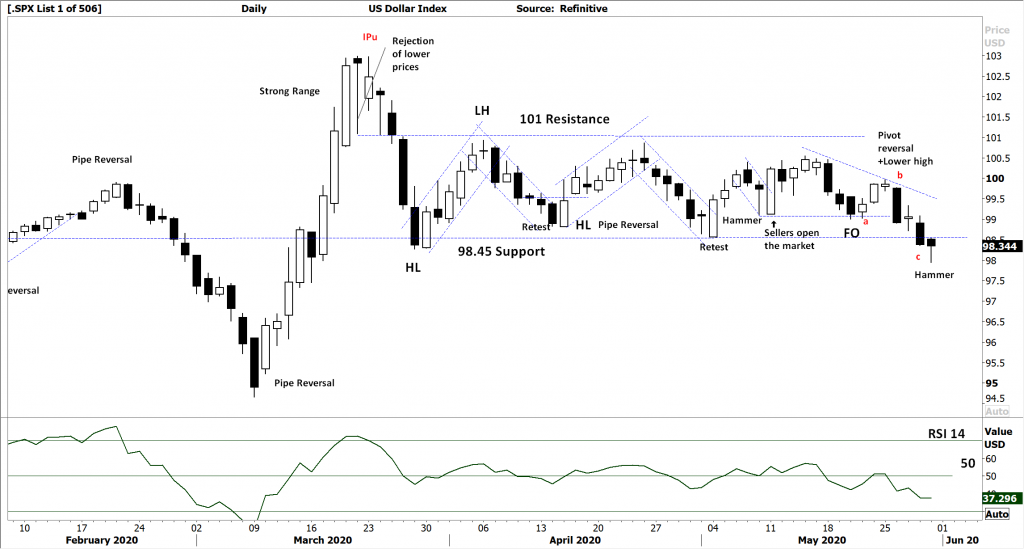
Comments from last week: While a lot of commentary is going on around the USD printing and USD debt. The DXY a measure of the USD against a basket of other currencies only tell of a continuing picture of consolidation below 101 and above 98.45. Last week’s pivot point reversal suggest a retest of 101 underway.
Relative Strength had remained just above the 50 level, however the sideways movement is a continuing sign of weak momentum as the indicator turns flat to lower.
WTI CRUDE OIL
Price structure:
This commodity is news driven
Traders should be reminded that WTI remains in an overall Primary down trend. The current price test of the lower side of the GAP is a good short term signal of price strength. A better signal would be a close over the $40 level and successful test of the $42.0 support / resistance level, followed by a short retracement to see if sellers exist.
Indicator: Relative Strength
The developed picture in the RSI is a Bullish divergence Buy signal, a weekly cross of the 30 level has now confirmed. The key 50 level has now been crossed as a sign of increasing momentum.

Comments from last week: The $29.0 resistance level has been disregarded without any retest, the continued movement over the past 4 weeks, may exhaust into the higher GAP at $36.0. This would be the potential level for short term rejection for a retest of the $29/$30 level.


 Access +10,000 financial
instruments
Access +10,000 financial
instruments