
A strong recovery in the Major Indices suggests a strong short cover from oversold levels is underway. The current recovery of prices has not changed the underlying Primary Downtrend.
The concept of Dow Theory requires the markets “foresee” an indication of some economic recovery, given the rising interest rate environment this seems immediately doubtful.
The indications of economic recovery are increasing GDP along with improving business confidence and investment into capital structure.
Gold, Silver and Copper remain within neutral trading ranges with the risk of a move lower.
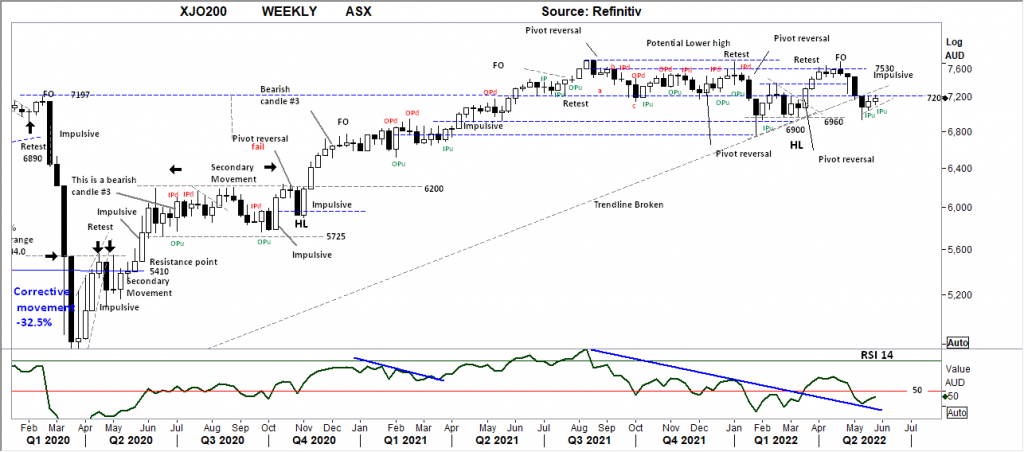
XJO WEEKLY
Price structure: Corrective price movement.
These comments from 2 weeks ago have played out to retest the 7200 level. The strong close of the Futures markets for the last trading day of the month (MAY) suggests a further breakout higher of this key level.
“The retest of the 6960 (6930 low) is complete with the index closing some 145 points from the low. With the strong buying reaction at this lower level, the potential for the Index to recover the 7200 level remains, this would also put the Index above the long term trendline.”
The underlying index has not set a valid “higher low” in this important time frame, the current move remains “corrective”.
Indicator: Relative Strength 14
Relative Strength has again closed below the key 50 levels. Price momentum remains negative. The turn higher is a positive but only a further swing above the 50 levels would signify a positive momentum shift.
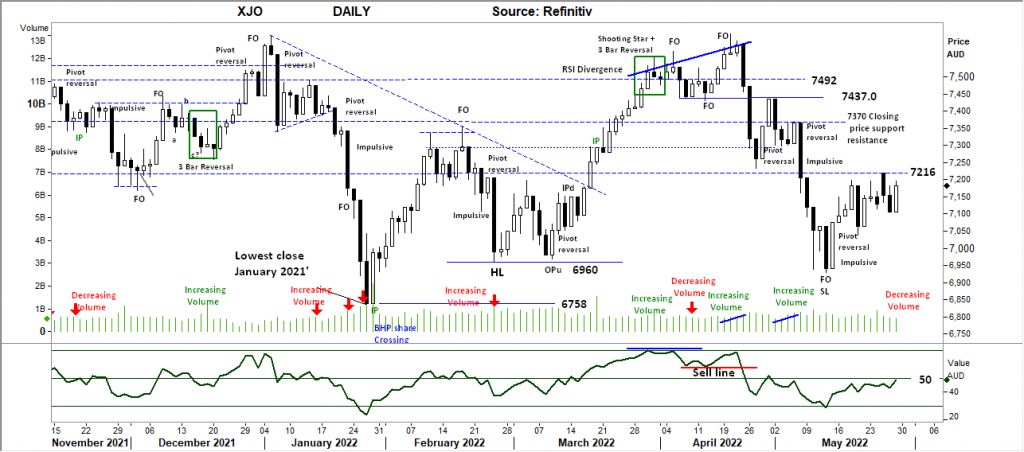
XJO DAILY
Price structure:
Following through from the pipe reversal of 2 weeks ago to again retest the 7200 level, the rejection has been shallow with the bullish reversal bar showing again last Friday. A further breakout above the 7216 level would indicate a retest of 7370 underway.
Indicator: Relative Strength 14
The Relative Strength Indicator (14) reflecting the underlying price momentum has moved higher from below the 50-level indicating a shifting to positive momentum. A move over the 50 levels would be a strong positive for further gains in the Underlying Index.
Indicator: VOLUME
Trading volumes again have not matched the indicated bullish reversal of last Friday. Only strong volumes over 1Bil on a Daily basis would indicate strong buying/selling.
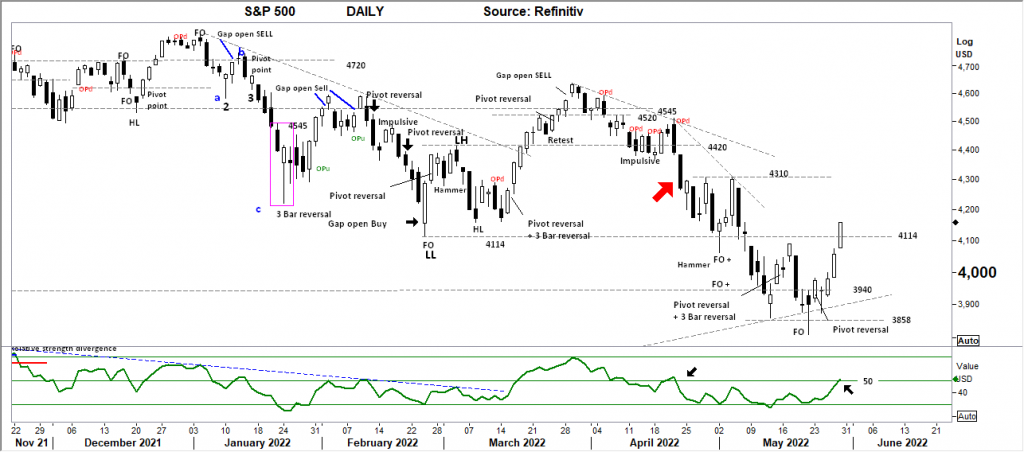
S&P 500 WEEKLY
Price structure:
The S&P 500 has set a significant WEEKLY pivot reversal bar, along with the strong close over the previous 4050 resistance level, and short-term price recovery is underway. This does not change the Primary downtrend in place. The 4200 broken support level may offer first resistance with several levels overhead at 4320 and 4545 to contend with.
Indicator: Relative Strength Indicator 14
Price movements are considered positive with a reading above the 50 levels, with this continued reading below the key 50 level indications are that price momentum is slowing, an ongoing reading below 50 would confirm the continuing Bearish price movement in the price chart. Last week’s reversal is a good start towards positive momentum. The potential for an accelerated move lower remains if the momentum slows and moves lower towards the 30 levels.
S&P 500 DAILY
Price structure:
My comment 2 weeks ago (15th) suggested a short-term price rally underway from the 3 bar reversal. The rally was short-lived, this happens in a bear market price structure. Friday the 20th of May an important retest of the lows took place with a Fake Out low (bullish) being set, followed by the pivot bar set on Monday the 23rd. The new support level of 3858 is an important level to hold in the coming days.
Indicator: Relative Strength 14
Relative Strength Indicator (14) has made a higher reading to close the week on the key 50 levels. The divergence signal has been in play between the 15th and 20th lows, so a move towards the 50 levels and over is required to show improving price momentum.
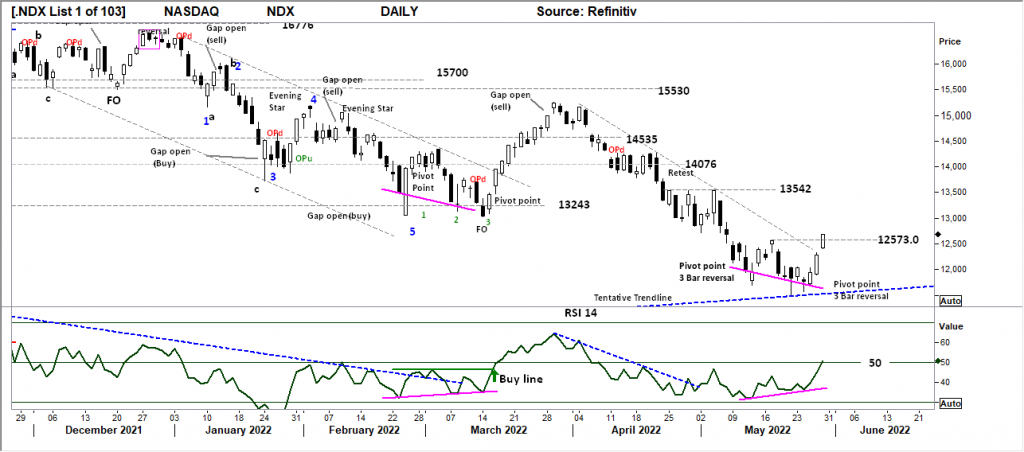
NASDAQ DAILY
Price structure:
The trendline has been lowered to reflect the new swing point, this line is “tentative” with 2 touches. This daily chart of the Nasdaq has also set a Mid-week 3 bar reversal following the recent decline to a 12-month low. This is not a trend reversal signal, and the Primary trend remains down. The expectation would be for a short-term rally to test the resistance level of 13542.
Indicator: Relative Strength 14
Relative Strength has moved sharply higher during the week to the key 50 levels, indicating improving positive price momentum from the 14 day lookback period. The structure also displays a bullish divergence signal, now complete.
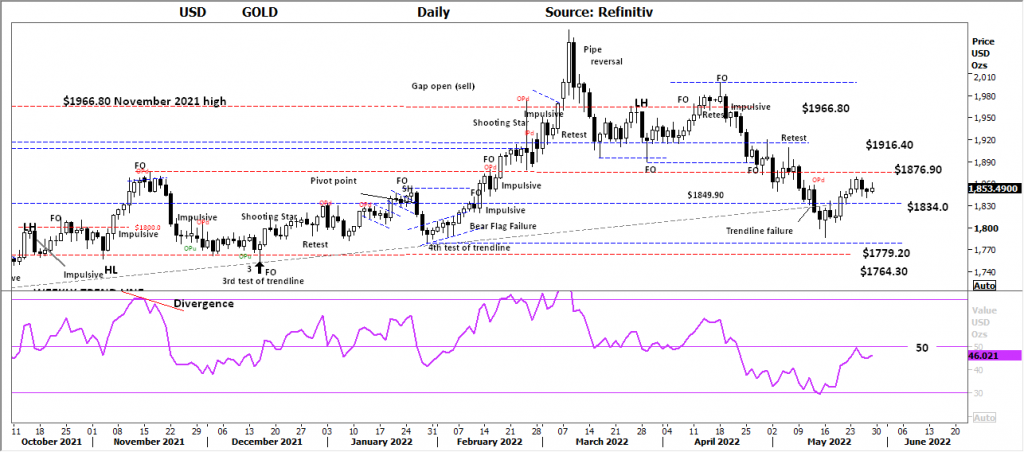
USD Spot GOLD – DAILY
Is it a Bull market? Answer = No
The break of the long term trendline is concerning for the short-term buyers. Gold remains within a Primary Down Trend, the last close above the psychological level of $1834 is an important observation, a further close above the OPd high circa $1860 has occurred, this indicates the low is set in this current analysis period. The lower support levels of $1780 and $1764.30 remain in play on further weakness should Gold move to close below the $1798.0 level on an intraday basis.
Indicator: Relative Strength 14
Price momentum has turned lower as a reflection of the current 2-day retracement, the indicator continuing to move below the 50 levels the 30 levels will be the critical observation again this week as a signal of decreasing price momentum this may continue to move further lower.
SILVER DAILY
Price structure: Bull market? – Early signals are important.
The 3-bar reversal prior to the current secondary consolidation around the $22.00 level. $21.60 is the current intraday support level, the Fakeout move last Friday is a good indicator of sellers remaining in the market. This bar can now be referenced for further bullish movements with a close above the $22.44 high.
Indicator: Relative Strength 14
Current Relative Strength is moving higher but remains below the 50-level, RSI turning higher shows price momentum is improving. A continuing move below the 50 levels and lower would be very bearish in the short term, and the potential for a further decline remains should the price close below the $21.60 level.

AUD GOLD DAILY
Price structure:
These comments from 2 weeks ago have now played out:
“Consolidation between the resistance level of $2712.0 and $2600 support may be about to be breached lower as $USD Gold moves lower. Local producers may be subject to current market sentiment (bearish) pricing.”
The current breakdown below the important $2600 level sets up the potential retest of $2477 support.
Indicator Relative Strength 14
Relative Strength has turned lower below the 50 levels and moving towards the key 30 levels indicating a decrease in momentum. Relative strength may continue to track lower as the price has the potential to retest the $2477.0 level on this break below $2600.

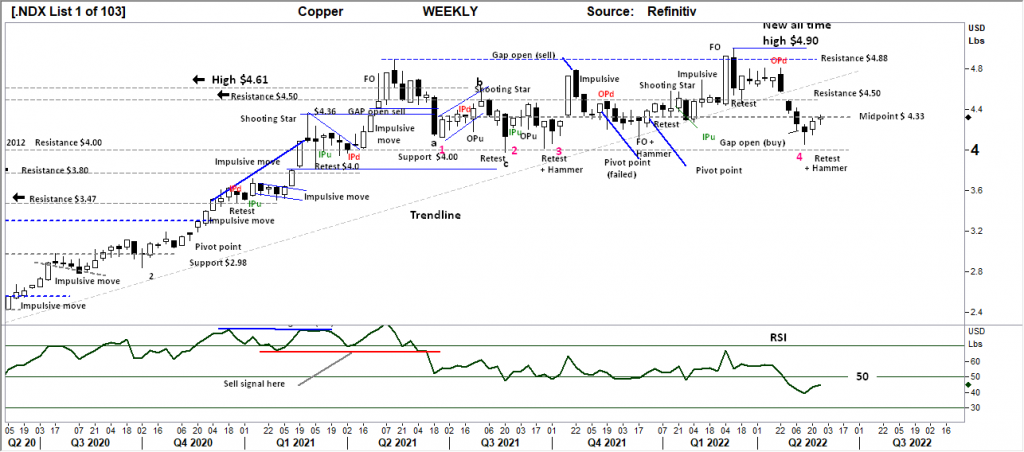
COPPER DAILY
Price structure:
Dr Copper an indicator of global growth and demand for goods has moved below the very important median level of $4.33. The current movement has the potential to again retest the $4.00 level. Last week’s range has narrowed from the previous week showing sellers in control and buyers unwilling to add to positions.
Indicator: Relative Strength 14
The current reading has swung below the 50-level reflecting the current Primary move underway. The key now is for the RSI to move back above the 50 levels as a reflection of ongoing and any positive underlying positive price momentum.
AUSTRALIAN VOLATILITY INDEX:
The decline in volatility has been reflected in the gain in equities, 3 months forward PUT option insurance has decreased, suggesting a more risk-on approach. The cost of 3month forward PUT options is increasing.
The XVI is the difference between the 3-month forward pricing of ETO Options against the current month.
As markets anticipate events, the forward priced option volatility changes, hence as forwarding price changes, this “skew” in pricing is measured in this XVI.
The XVI value works as an inverse observation to the underlying market.
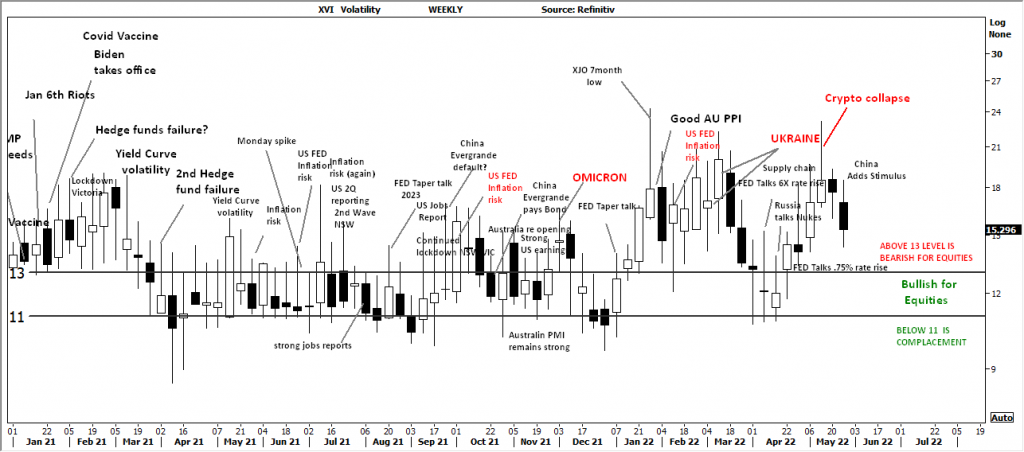
Comments from last week: The XVI value is expected to rise this week as forward protective risk is again priced in.
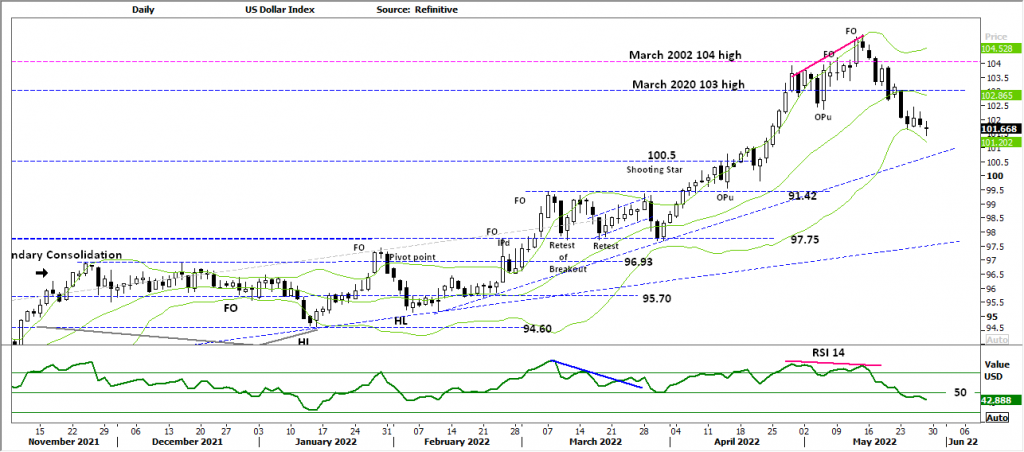
USD DOLLAR INDEX
Price structure:
The current price decline from the 105 high originates from the Bearish divergence signal developed into the high. This price retracement has disregarded potential support levels during the decline to the current 101.66 level.
The Bollinger band overlay has been added to show the price decline is:
- Below the 20-period average,
- The B-Bands are expanding with the current price decline indicating increasing relative volatility. Several short trendlines have also been disregarded on the move lower with the longer-term T Line now in play around 101.
Indicator: Relative Strength 14
The Relative Strength has turned lower in line with price movements and should now be monitored for further weakness as the current reading below the key 50 levels should move lower, a further reading above the 50 levels would indicate positive price momentum. The chart should now be monitored for a Bearish divergence signal should the RSI move below the 30 levels on lower prices.
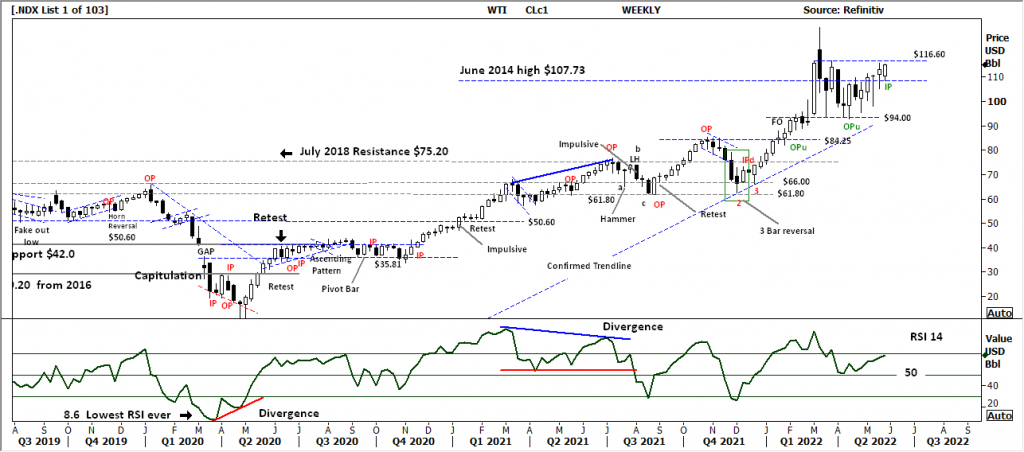
WTI – CRUDE OIL
Price structure: This commodity is highly news-driven around supply-demand.
The close above the $107.73 level is an important support level for the Oil bulls. This will be the level in play again this week, continued closes over this level will set up a very bullish outlook for closes over the $116.60 level to confirm the current Primary UP trend. The ultimate key level to hold is $94.0 a close below this level would see substantial selling back to the $80 level.
Indicator: Relative Strength 14
The current price reversal has produced a second higher low in the RSI, the indicator remains above the key 50 levels a signal of positive price momentum. This will again be monitored for a swing below this key level. The Relative strength crossing and remaining below the 50 levels is regarded as a Bearish indicator.


 Access +10,000 financial
instruments
Access +10,000 financial
instruments