
XJO WEEKLY Price structure:
IMPORTANT DISCLAIMER
The information in this report is of a general nature only. It is not personal financial product advice. It does not take into account your objectives, financial situation, or needs.
You should therefore consider the appropriateness of this general information in light of these. The Australian School of Technical Analysis (www.astatrading.com) recommend that you refer to the Product Disclosure Statements of any financial products which are discussed in this report before making any investment decisions. ASTA accepts no responsibility for your actions and recommends you contact a licensed advisor before acting on any information contained in this general information report.
The current move is impulsive and a confirmed break of the tentative trendline putting the Index on a short course to test 6400. The Index remains within a strong primary downtrend, a break of the 6400 put the index on track to retest the breakout level at 6200. Dynamic analysis is important, the final bar is a Fake out (FO) and can reverse the short term
movement in the following sessions, a close above the trendline would confirm that scenario.
Indicator: Relative strength 14:
Relative strength has again closed below the 50 level and set a lower high as part of the overall decline in relative strength. Price momentum has turned negative on the lower side of 50. However, should Relative strength move above the key 50 level a sign of improving price momentum would prevail.
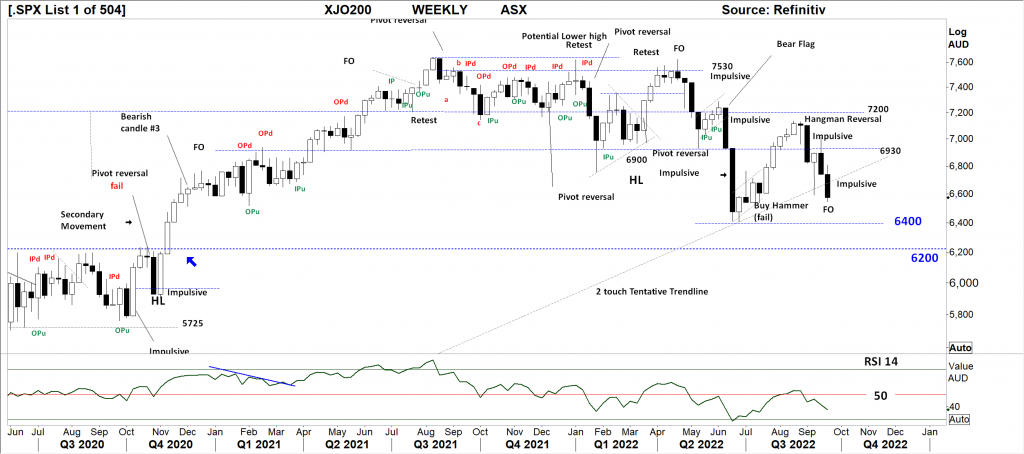
Comments from Last week: Follow through from the BUY hammer was limited with a quick look over the 6930 level before closing at the low and again retesting the tentative trendline. The hangman reversal bar has been further confirmed as a lower high (below7200) with the retest of the June low underway. The “range” high to low is noticeably larger for the down close bars over the past 5 months, something that should be acknowledged by all traders.
XJO DAILY Price structure:
Impulsive daily ranges indicating the seller in control of the price action. With the Daily support level of 6765 now decisively broken, the final bar is now a Fake-out line against point 3 set on the 18 th July. However, no reversal pattern is showing. The daily price trend is confirming the Weekly Primary trend. The FO bar scenario can reverse the immediate price movement but mat not lead to a change in trend.
Indicator: Relative strength 14:
The Relative strength Indicator (14) reflecting the underlying price momentum has moved lower below the 50 level indicating weak momentum. Relative strength is moving in sync
with the trending action of the market and does not offer any trading signal other than momentum is to the downside.
Indicator: VOLUME:
Last Friday’s higher volume bar was developed from an impulsive move lower, high turnover bars can begin to represent a base beginning to build. Only volumes over 1Bil on a Daily basis would indicate strong new money buying.

Comments from Last week: Strong down close bars last Wednesday and Friday, with Friday closing below the 6765 level and on the low for the session. Given the bars are large range high to low shows the sellers in control of the session. The Daily trend resumes to down, a break of the pipe reversal low will have buyers on the wrong side of the market and may bring in Stop loss selling, as the June low become the target level…
S&P 500 WEEKLY Price structure:
The Weekly S&P also shows impulsive movements down below the current support level of 3715 and testing the June low and heading towards the 3600 level a full 23 % decline from
the January high. The OPd of 2 weeks ago is the key reversal signal in play. No current signals of reversal from this level are showing.
Indicator: Relative strength Indicator 14.
The reading below the 50 level again sets up the sell signal, last week the indicator turned higher, indicating a change in momentum, this week reversing the momentum. A movement
towards and over the 50 level would be a very strong short term bullish signal. Positive momentum requires a reading above the key level of 50.
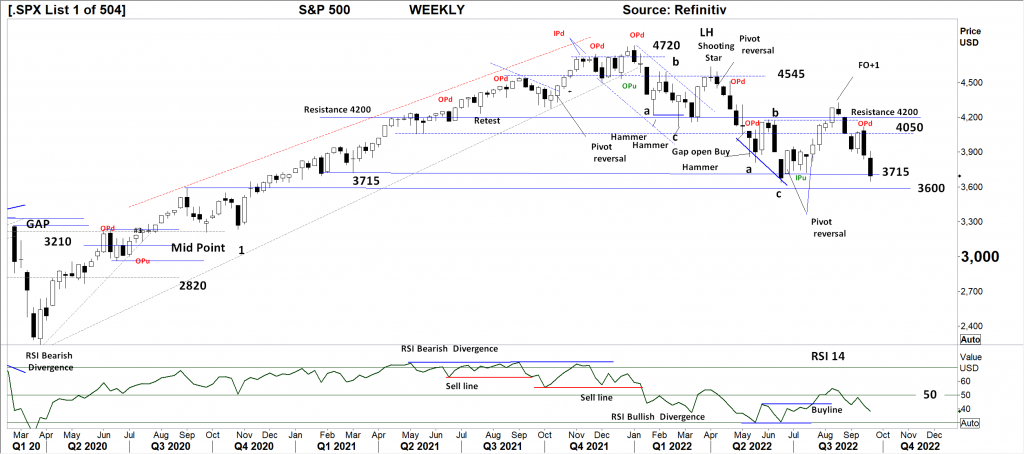
Comments from Last week: Weekly outside range, a very bearish signal of reversal and being conducted at the key level of 4050 points resistance level. This confirms the FO+1 point as the high point until a close above 4050 that may retest that level. The Primary trend of the S&P500 is down with the 3715 level currently being retested.
S&P 500 DAILY Price structure: Developing bullish structure.
From the OPd Outside period last Tuesday the index has moved lower to set both a FO Fake out against the July low and a Gap open buy signal often seen as an exhaustion signal following a fluid movement. Confirmation of reversal would be seen as a Pivot or 3 bar setup.
Indicator: Relative strength 14:
Further price weakness for this index will see the RSI move lower. This is the level to monitor for a bullish divergence signal.
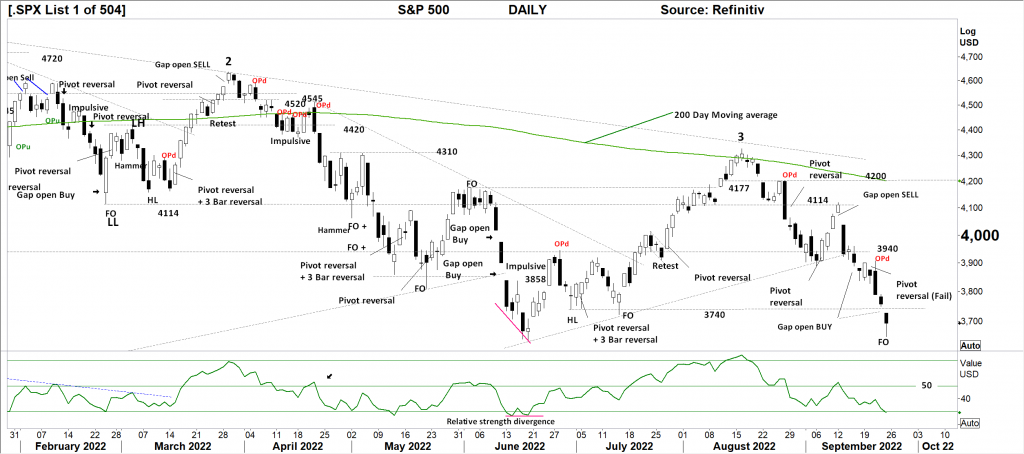
Comments from Last week: Gap open sell confirmed with the large range decline last Tuesday has been followed by a break of the Trendline, however the current gap open is regarded as a short term buy signal within the current down trend. This is the place to watch for a reversal pattern like a pivot point or 3 bar reversal. A test and reject of the trendline would be very bearish in the coming days.
NASDAQ DAILY Price structure: Primary DOWN Trend remains
The Nasdaq Daily chart shows price moving below the “tentative” trendline (this will be removed next week.) The final movement (Friday) is shown as a Gap open buy signal and Fake out of the late June low point. Any rally may target the OPd high as a retest, failure to close past this level would signal further selling.
Indicator: Relative strength 14:
The Relative strength indicator moving back towards the 30 level a signal of slowing / negative momentum. With a continuing move, the indicator may cross lower below the 30 level, price movement will remain negative with a continued reading below 50 and have the potential to retest lower levels.
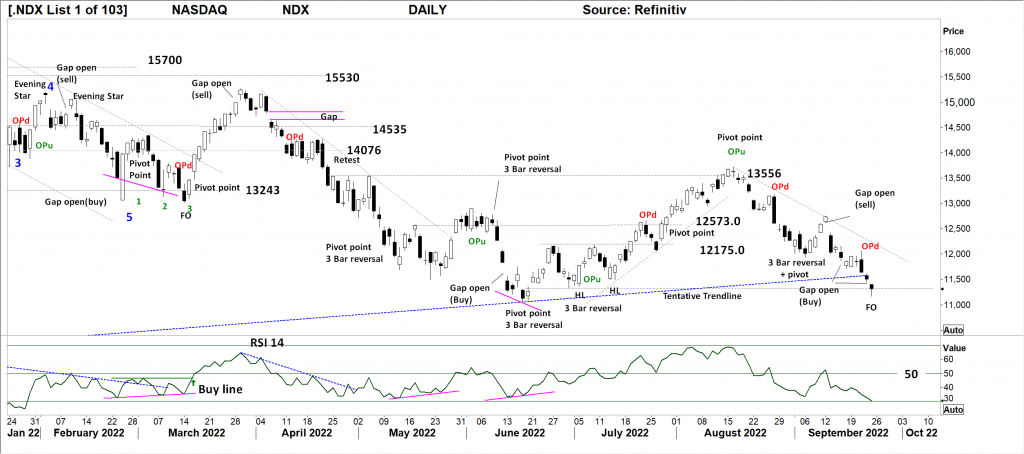
Comments from Last week: The Nasdaq posted a short follow through from the 3 bar low to also post a Gap open sell signal that was immediately followed thru with a large range down close bar last Tuesday. Again a retest of the tentative (2 touch) trendline is underway. Traders would look for support at this level following last Friday’s gap lower. (gap open buy signal)
USD Spot GOLD – DAILY: Is it close to a Bull market? Answer = No
Multiple days below the $1676 level and above the $1656 level had to break one way or another, the primary trend has prevailed with the breakout lower. The range of the bar high to low is large compared to previous ranges, a signal of continuation.
Indicator: Relative Strength 14:
Price momentum is working lower with the RSI settling at an equal low as price makes a closing lower low sets up the divergence signal. (Price consolidation would naturally see the RSI drift back too around the 50 level. A strong movement either way will show the next directional move.)

Comments from Last week: Gold remains with a well defined down trend with the most recent “bear flag” following through with a break lower below the $1676 support to test the March 2021 support point at $1656.0 Currently a small bullish Relative strength divergence signal is developing as the chart also shows an early stage price reversal pattern at this support level.
SILVER DAILY Price structure: Bull market? – Not yet
The initial move higher in Silver has failed to breach the $20.0 level with the decisive move, read impulsive move lower. The bigger observation is Silver is consolidating above $17.50 and below $21.0 for the past 2 months. The underlying primary trend for Silver remains down. The bigger observation is Gold has made a new low and Silver has not.
Relative strength 14:
Current Relative strength is rolling lower with the movement crossing the 50-level, RSI turning higher again would reflect the underlying momentum turning positive or consolidating. A continuing move above the 50 level and higher would be very bullish signal in the short term. Price consolidation results in the relative strength turning towards the 50 level.

Comments from last week: The bear flag described last week has failed with a breakout higher to develop into a bullish flag, identified by the overlapping price bars declining against the previous strong move. Confirmation would see a closing price breakout above the $20.44 level. Silver remains within a primary down trend with a early stage bullish breakout
AUD GOLD DAILY Price structure: Consolidation.
Australian dollar Gold now remains trendless as price consolidates. The break in price higher last Wednesday has not seen any bullish continuation up to last Friday, A continuing move lower could be expected on a weaker Gold price and weaker $AUD. This will keep pricing pressure on the Australian Gold producers and may set lower prices again this week.
Indicator Relative strength 14:
Relative strength has turned sideways and lower from above the 50 level to below the 50 level, this shows a decrease in positive price momentum and remains a strong warning for further declines.

Comments from Last week: Australian dollar Gold now remains trendless as price consolidates. The reversal pivot at the 2537 level sets up a retest of 2440. The Australian dollar gold price has remained within a large consolidation range for all of 2022 so far. In face of rising material and wage costs for Australian Gold producers the margin squeeze on profit is holding Goldies lower.
COPPER DAILY Price structure: “V” recovery failed.
The breakdown of the $3.47 support level is concerning and indicating a retest of the trendline level at the $3.3 low point is underway. The underlying short term primary trend remains down. The expectation would see further price consolidation above $3.30; a breakdown of this level would signal a retest of the $2.98 support level underway.
Indicator: Relative strength 14:
Current reading has swung from below the 30-level to again turn lower as downward momentum has slowed to the pipe reversal 2weeks ago, however the current reading remains below the key 50 level. The key now, is for the RSI to swung back above the 50 level as a reflection of ongoing price gains. A sharp cross of the 50 level is required to offer a strong buy signal.

Comments from Last week: Last week saw a retest both ways between resistance at $3.80 and support shown at $3.47 with the closing price equal to the opening price for the week. Expect consolidation above $3.47 in the coming days, a breakout over the $3.80 level would signal a ne Primary UP trend underway
AUSTRALIAN VOLATILITY INDEX:
Volatility reading has moved sharply higher and remains above the 13 level indicating forward pricing of PUT options remains strong. In general, lower equity prices or consolidation of equity prices is indicated as the reading remains above the 13 level. For continued support of equities, the XVI should move below the “13” level.
The cost of 3month forward PUT options is decreasing from recent elevated levels. The XVI is the difference between 3-month forward pricing of ETO Options against current month.
As markets anticipate events, the forward priced option volatility changes, hence as forward price changes, this “skew” in pricing is measured in this XVI. The XVI value works as an inverse observation to the underlying market.

Comments from last Week:
USD DOLLAR INDEX Price structure:
The wrecking ball of currencies, the US dollar Index has crushed the pricing on commodities and FX. With the US 10 year bond rate now moving towards 4% this current momentum
may continue. The USD Index remains in a firm primary UP trend.
Indicator: Relative strength 14:
The Relative strength has turned higher in line with price movements indicating a increase of upward momentum and should now be monitored for further consolidation as the
current reading is above the 70 level. This will move lower to sideways should price decline, only a continued reading above the 70 level would indicate continuing strong price momentum.
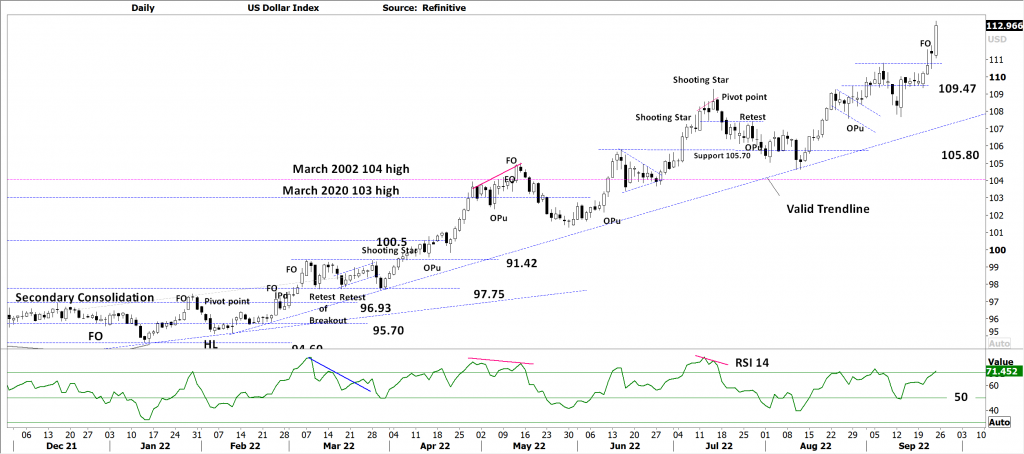
Comments from Last week: Current price action displays a consolidation pattern above the 109.47 level, following the strong impulsive move last Tuesday. This current 109.47 support level will the key area to hold into next Friday’s close. A further move higher will bring pressure onto commodity prices and place selling pressure onto equity price movements..
WTI – CRUDE OIL, Price structure: Full Bull Market remains-just.
This commodity is highly news driven around supply -demand.
This decisive breakdown below key support is heading to lower support of $75.20. Current price structure is moving below the 2021 November December highs. Next significant support shows at $61.80, a further move lower into this level would be viewed as a corrective movement.
Indicator: Relative strength 14:
The RSI running below the 30 is a result of strong price declines as upward momentum slows, price remains at risk of moving lower only a move over the key level of 50 would signal increasing positive price momentum. This is the level to monitor for a divergence signal, these signals take many days to develop.


 Access +10,000 financial
instruments
Access +10,000 financial
instruments