
The Australian XJO Index closed the week trading 107 points from an all-time high and is currently leading Global indices. Inflation cycles offer some great trading opportunities in the Commodities stocks and Futures.
The CRB commodities index has closed at an all time high (again). US and European Indices continue to set new lows as concerns around inflation and Global growth weigh on risk as the US10 year yields reach 2.85%. Gold and Silver are developing early signals for a break away price move higher. Also, in the commodities space the WTI Oil contract as again moved over the key $100 level closing the week off at $106.95
XJO WEEKLY Price structure:
A second week of consolidation under the 7530 level and 107 + points short of an all-time high.
Look for a further close over this important level as a very bullish signal for further gains. Although the Index has remained within a large consolidation zone for the past 12 months, the recent retest of the trendline has set up the market for a bullish run from the strong
close over the 7200 level. Continued rejection at this level would be a very bearish signal should the index value fall and close below the weeks low point at 7420. The underlying Primary trend remains UP.
Indicator: Relative strength 14:
Relative continues to close over the key 50 level. Price momentum remains positive, this will now be monitored for a downturn should prices consolidate below 7530 points. As the Relative strength Indicator reflects price momentum the current weekly closing price displays slowing price momentum.

Comments from Last week: The XJO has again found resistance at the 7530 level with price rejection to close at 7478 points. The past week shows consolidation below this important level, with a heavily weighted commodities component along with stability in the financials the index could be expected to hold these levels prior to a breakout higher. This 7530 level has provided resistance for the past 9 months, only a solid close higher would be a significant change and set a bullish signal for further gains.
XJO DAILY Price structure:
Last Wednesday’s FO (Fake out) low below the 7437 level has setup the strong move for the current strong close shown on Friday.
With the Index having a strong commodities weighting a further higher close would be expected in this seasonally bullish period. The Daily chart should be monitored for an early price rejection pattern. Rejection patterns are the 3 Bar reversal or bearish pivot point or the OP outside period or simply rejection of the recent 7573 high. (FO)
Indicator: Relative strength 14:
The Relative strength Indicator (14) reflecting the underlying price momentum has moved lower from the 70-level indicating a shift to slowing momentum. The current swing higher is a very positive signal to have at this important resistance level. The Daily chart remains in a divergence sell. Only a further cross above the 70 level will provide a signal of strong price momentum.
Indicator: VOLUME: Trading volumes have been increasing during the past week leading to last Friday’s high volume close, volume will be monitored for any further increase as a signal of buyers entering the market. Strong volumes over 1Bil on a Daily basis would indicate strong buying.

Comments from Last week: The Daily chart shows an intimate resistance at 7492, tested during last Friday’s trading session. This market is displaying a potential failed retest of the highs, the first indication being the Fake Out (FO) set last Tuesday with Fridays retest not closing above the 7492 resistance level.
S&P 500 WEEKLY Price structure:
The shooting star pivot point from 2 weeks ago has played out lower from the very important 4545 resistance level. This now sets the stage to trade lower with the first level of support shown at 4320 points. The ultimate support level is shown at 4200 points a close below this level would set a significant top pattern in place and set the market into a primary down trend.
Indicator: Relative strength Indicator 14.
Price movements are considered positive with a reading above the 50 level, with this continued reading turning sideways and moving below the key 50 level indications are that price momentum is slowing, an ongoing reading below 50 would confirm the Bearish rejection bar setup in the price chart.
The potential for an accelerated move lower remains as the momentum slows and moves below the 50 level.
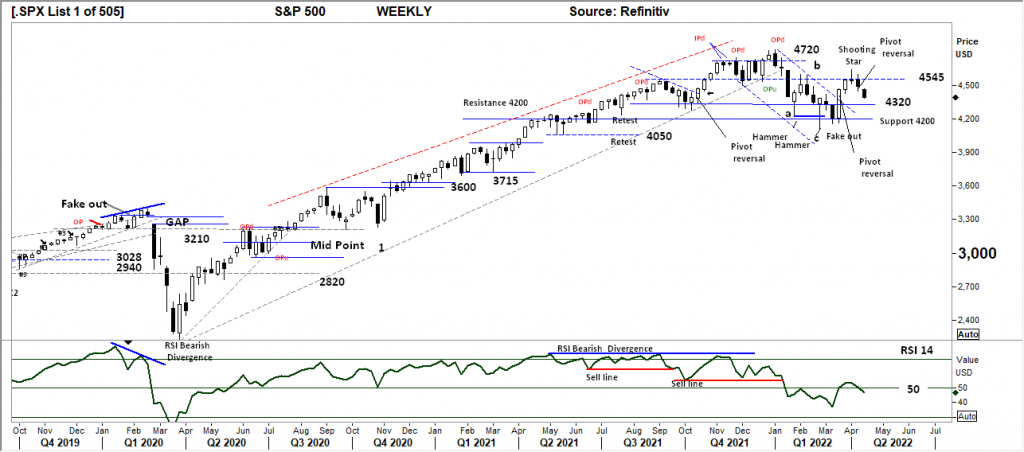
Comments from Last week: The S&P shows the early development of a “lower high” being set as the week ended with a bearish pivot
point close. Resistance of 4545 is again developing from the earlier support shown during Q4 2021. To remain bullish a Weekly close over 4545 is required, failure to do so will result in a lower high being set and a retest towards the 4200 level becoming best case scenario.
S&P 500 DAILY Price structure:
The intimate rejection at 4520 resulted in the Gap down last Tuesday with consolidation around the 4420 level. With price moving to “retest” the trendline at around 4300 level, the chart shows 2 OPd’s (outside period with down close) as buyer taking the market higher were overwhelmed by selling. With last Friday closing at the low the momentum move will be a lower print in the coming week.
Indicator: Relative strength 14:
Relative strength Indicator (14) has again moved lower remaining below the key 50 level. A continued lower close below the 50 level would alert traders to further decreasing price momentum and potential price breakdown too and below the 4300 level.

Comments from Last week: All of the signals for lower prices. The “Gap open sell signal” followed by the “OPd” (outside range) followed by daily resistance setting up at 4520. With price consolidation a bear flag has developed within the last 3 trading days, a breakdown would see the first target of 4420 in play. A continued move lower would further confirm a “lower high” is now in place.
NASDAQ DAILY Price structure:
The Nasdaq has set the lowest close for the past 21 trading periods, the OPd in place set a very bearish tone. Look for a retest of the “trendline” area at 13500 points. The corrective movement shown during the month of March has proven to be a Bear market rally as the
lows are again tested. A close over the 14076 level would set a reversal signal.
Indicator: Relative strength 14:
Relative strength has turned lower remaining below the key 50 level, changing to bearish price momentum from the 14 day look back period.
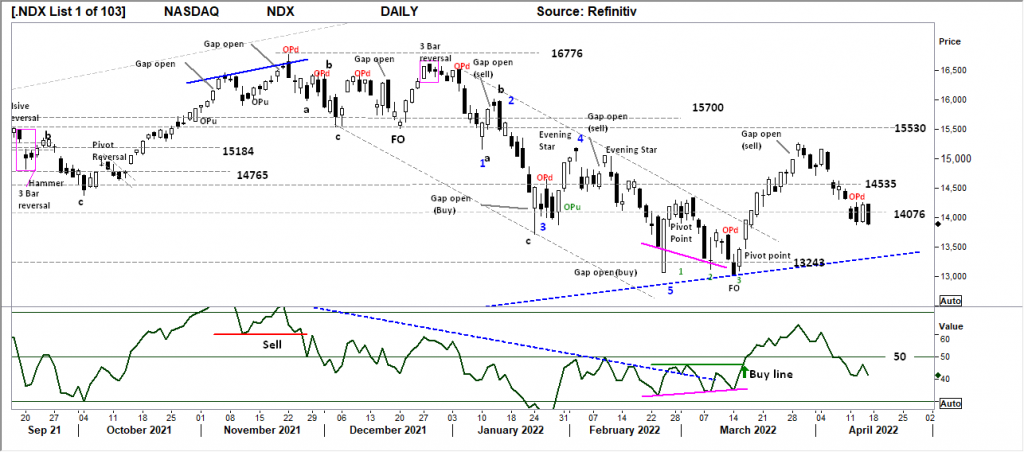
Comments from Last week: The price rally during the March period is now confined to a corrective move with a developing bear market.
Price rejection of 14535 has seen the Nasdaq close on the lows of the week confirming a “lower high” in place and a retest of the 14076 level is underway.
USD Spot GOLD – DAILY: Is it a Bull market, Maybe.
From the notes last week, a strong close over the $1966.80 level would give a Bullish signal. Last Friday saw a retest of this level with a close of $1974.0 and towards the high of the range setting a further Bullish signal for a move higher. At best further consolidation above this level this week would add to the bullish view. A closing price below this level would put the PM on a trek to retest the $1916.40 level.
Indicator: Relative Strength 14:
Price momentum has rolled higher, the indicator continuing to move above the 50 level will be the critical observation this week as a signal of increasing price momentum this may continue to move higher above the 50 level towards the 70 level.
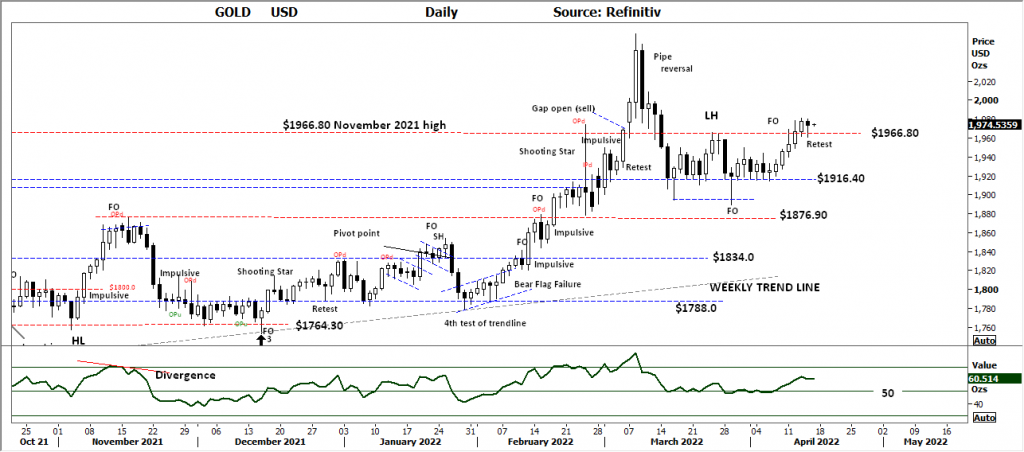
Comments from Last week: Strong support is developing along the $1916.40 level. Gold remains within the consolidation range of $1916.40 to resistance of $1966.80, last Friday’s strong price action is setting up a retest of the $1966.80 level. Only a strong close above this level would give the first bullish signal required for a potential retest of the $2000.0 plus level.
SILVER DAILY Price structure: Bull market – Maybe.
Current price range from $25.40 to 25.80 is critical to hold this week, the high range close on Friday suggests a further breakout higher.
Last Thursdays OPd may set the market for further consolidation, so a close over the high of this bar would be very bullish.
Indicator: Relative strength 14:
Current Relative strength is moving above the 50 level and now turning higher shows price momentum is increasing in this retest of the $25.80 area. A continuing move above the 50 level and higher would be very bullish in the short term, and the potential for a further rally remains as price consolidates above the $25.40 level.

Comments from last week: Silver showing a swing low in place as price now closes above the key level of $24.73 ($24.75). This overall Bearish decline from the $27 highs has room to move lower to retest the breakout levels at $23.50. In the immediate price action, Silver remains within the confines of a Daily down trend. For a bullish case to persist a close towards the $25.4 level is required.
AUD GOLD DAILY Price structure:
With the strengthening $USD Gold price and weakening $AUD the AUDXAU price has rallied strongly towards the resistance level of 2712.0.
This provides a good signal for local GOLD producers.
Indicator Relative strength 14:
Relative strength has turned higher from below the 50 level and moved towards the key 70 level. Relative strength may continue to track higher as price retest the 2712.0 level. The RSI divergence ( although a move below the 30 level did not occur) is in place.

Comments from Last week: The initial break of support at $2541.0 has quickly reversed as the 3 Bar reversal pattern has followed through higher above the $2600.0 level. This now sets a bullish signal for further gains, and support for the local Gold producers. A further rally in the $USD Gold price could facilitate further gains for the $AUD Gold price to retest the $2712.0 level.
COPPER DAILY Price structure:
Another week of consolidation ( 6 and counting ) in the Copper chart. These periods of low volatility often breakout into high volatility moves. The expectation is for a breakout above the $4.80 level as a signal buyers are in control.
Indicator: Relative strength 14:
Current reading has swung sideways above the 50-level reflecting the current consolidation move underway. The key for now is the RSI remains above the 50 level as a reflection of ongoing and any positive underlying positive price momentum.
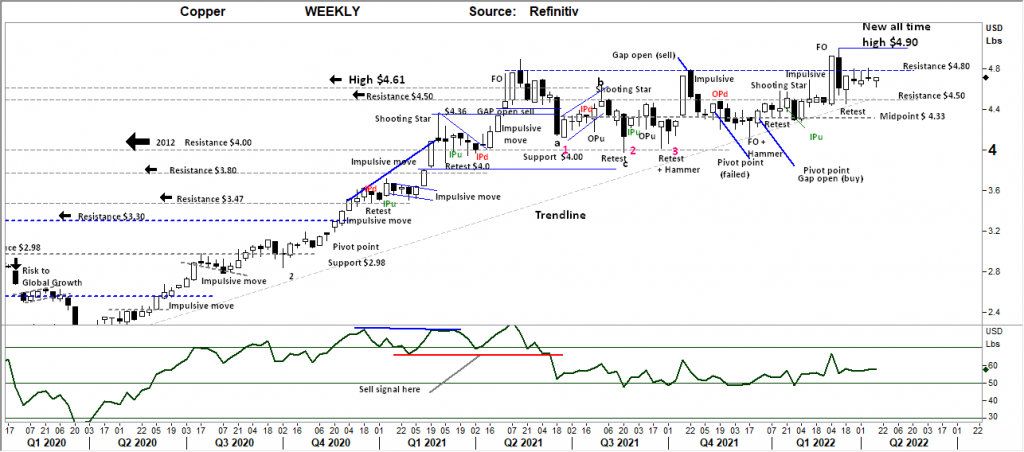
Comments from Last week: Another week of consolidation in the Copper chart, however last week sees a higher high and higher low to the previous week. This may build into a Bullish flag with the potential to retest the $4.90 high price area. The whole price structure from Q1 2021 remains bullish as resistance levels become support levels, the most recent is the $4.50 level acting as price support 4 weeks ago.
AUSTRALIAN VOLATILITY INDEX:
Last week saw underlying volatility again decline sharply as markets price in some clarity around interest rates and the Ukraine war.
The late week rise in the XVI value again underscores the reversal signals in the Major Indices, forward protection is now being priced in by the Options market. Only a further increase in the XVI this week would provide a Bearish undertone for markets as future risk coverage is taken.
The XVI is the difference between 3-month forward pricing of ETO Options against current month. As markets anticipate events, the forward priced option volatility changes, hence as forward price changes, this “skew” in pricing is measured in this XVI. The XVI value works as an inverse observation to the underlying market.

Comments from last Week: Forward pricing of PUT options remains on a high skew to current pricing. The market is paying the highest prices since Q4 2020 prices for forward protection. The outcome remains as Bearish pressure on local equities.
USD DOLLAR INDEX Price structure:
The OPu may signal a high is in place, statistics indicate a 94% chance. With that in mind further consolidation below the 100.5 level would be bullish for further gains. The 91.42 level remains the key support area during a consolidation phase.
Indicator: Relative strength 14:
The Relative strength has turned higher in line with price movements and should now be monitored for further strength as the current reading over the key 50 level should move higher, a further reading above the 70 level would indicate very strong positive price momentum.
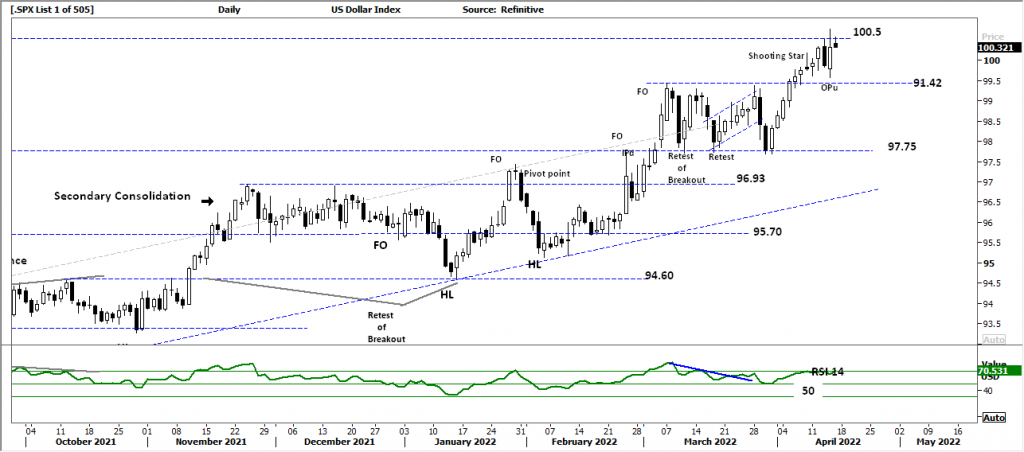
Comments from Last week: The USD Index traded to the 100 level last week only to set a rejection “shooting star”. A retest of the 99.5 level remains the first level of support. Overall the Primary Trend remains UP.
WTI – CRUDE OIL, Price structure:
This commodity is highly news driven by supply -demand. The $94.00 has confirmed as a major support level as the WTI contract sets an OPu, a statistically strong indicator of a turning point at these levels. With the high close towards the $112.00 level further gains would be expected this week.
Indicator: Relative strength 14:
The current price reversal has produced a new low in the RSI, but the indicator remains above the key 50 level. This will again be monitored for a swing below this key level. The Relative strength crossing and remaining below the 50 level is regarded as a Bearish indicator.


 Access +10,000 financial
instruments
Access +10,000 financial
instruments