
SUMMARY:
The ascent of the US dollar has finally ended with a retracement below key support. Commodities have set a strong technical reversal signal. US indices have potentially set a “higher low” in the Daily time frame, translating into a key reversal signal in the Weekly charts. Gold and Silver continue to languish, attempting to build a base, Silver remains the weaker of the two.
WTI broke significant support to retest an important level, this looks bullish.
XJO WEEKLY Price structure: Extended move.
IMPORTANT DISCLAIMER
The information in this report is of a general nature only. It is not personal financial product advice. It does not take into account your objectives, financial situation, or needs. You should therefore consider the appropriateness of this general information in light of these. The Australian School of Technical Analysis (www.astatrading.com) recommend that you refer to the Product Disclosure Statements of any financial products which are discussed in this report before making any investment decisions. ASTA accepts no responsibility for your actions and recommends you contact a licensed advisor before acting on any information contained in this general information report.
Following the impulsive price movement 2 weeks ago the Index has moved lower to fulfill the impulse lower. With late week buying the high close has set a “hammer” bar buy signal. With follow through higher this may set a higher low point and early indications of a new trend. However, the close remains below the 6930 level. A close over this level would signal a retest of 7200 underway.
Indicator: Relative strength 14:
Relative strength has closed below the 50 level and set a lower high as part of the overall decline in relative strength. Price momentum has turned negative on the lower side of 50. However, should Relative strength move above the key 50 level a signal of improving price momentum would prevail.

Comments from Last week: Last week set a strong impulsive move underway without respect for potential support at 6930 in this weekly view. The strong range high to low sets up a retest of the tentative trendline at 6640. Underlying Primary trend is down..
XJO DAILY Price structure:
Buying has set a late week pipe reversal signal at the completion of an identifiable a,b,c movement a highly reliable reversal pattern evidenced by the follow through last Friday. A
further close over the 6930 level would offer a further bullish signal, First daily resistance remains at 7130.
Indicator: Relative strength 14:
The Relative strength Indicator (14) reflecting the underlying price momentum has moved lower blow the 50 level indicating weak momentum. The Daily Relative strengths sharp upward recovery may signal a continuing momentum retest towards the 6930 and lower level on this slowing momentum.
Indicator: VOLUME:
Last Thursday and Friday’s higher volume bar is encouraging signal to indicate buyers/money is entering the market following the early week low volume readings.
Only stronger volumes over 1Bil on a Daily basis would indicate strong new money buying.
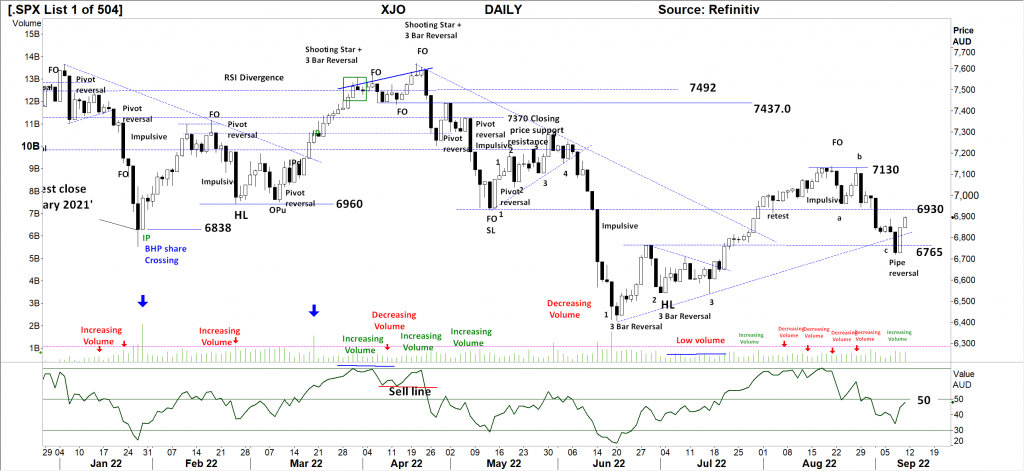
Comments from Last week: Rejection of 7130 has set 2 strong movements lower in the past week. The 6930 level did provide some short term support, however the impulsive move lower towards 6765 sets up the potential for further support, a close below this level bring into play a retest of the June lows circa 6400 points.
S&P 500 WEEKLY Price structure:
The outside period set last week (OPu) is a highly reliable signal indicating a low is now in place with a close at the 4050 resistance level. A decisive follow through would be very bullish for a retest higher past 4200 to again test the 4545 level. A breakout above the 4250 level sets a new primary trend in place. Price reversal at this juncture would be a very bearish outcome for a strong move lower.
Indicator: Relative strength Indicator 14.
The reading above the 50 level sets up the buy signal, last week the indicator turned higher, indicating a change in momentum. A movement towards and over the 50 level would be a very strong short term bullish signal. Positive momentum requires a reading above the key level of 50.

Comments from Last week: A decisive follow through week below the weekly support of 4050, this only sets up for a retest of 3715 as the Primary down trend confirms a second lower high at the FO+1 high. Of note is the weekly price ranges high to low have remained strong during the overall down trend from Q2 2022. Often referred to as a “committed sell” and offers no evidence of buying support.
S&P 500 DAILY Price structure: Developing bullish structure.
The pivot point from last Wednesday has setup a primary movement. The opening gap on Friday is regarded as a continuation gap. The higher low is now in place. The Primary trend remains down, a breakout over the 4300 point level would indicate a new primary UP trend underway.
Indicator: Relative strength 14:
Relative strength has continued to move higher from above the 30 level to rest below the 50 level as price action move higher. Price weakness for this level will see the RSI move lower.
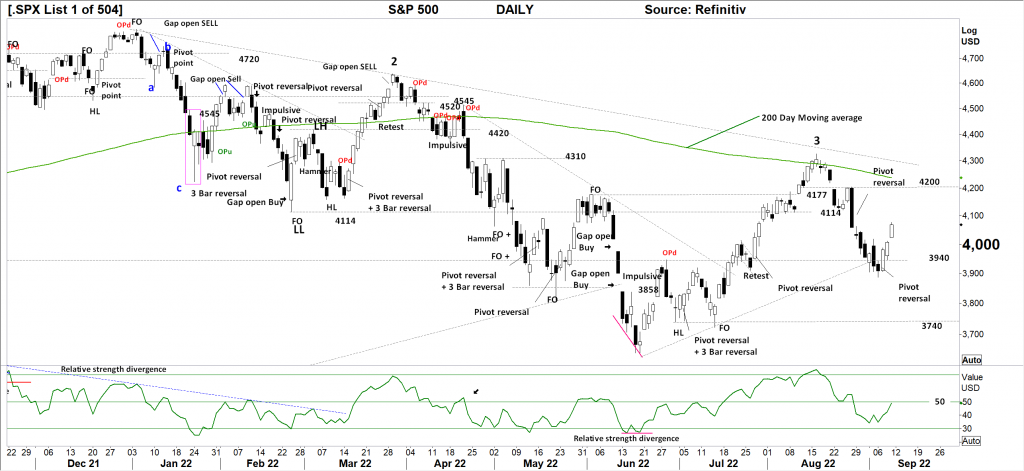
Comments from Last week: The pivot reversal discussed last week has followed through with 1 period of support at the 3940 level before continued selling lower. The break of the short term trendline is further evidence of the “committed sell” underway. This has the potential to retest 3740 very quickly. The RSI uptick last Friday may be discounted very quickly as further price declines occur.
NASDAQ DAILY Price structure: Primary DOWN Trend remains
The current higher low not retesting the long term trendline and setting a higher low indicated by the 3 bar reversal pattern is a very bullish signal for further gains, an immediate
retest of 13556 is underway. As with the other Indices the Nasdaq has gapped open last Friday indicating buyers well in control.
Indicator: Relative strength 14:
The Relative strength indicator moving back towards the 50 level a signal of positive momentum.
With a continuing move, the indicator may cross lower below the 50 level, price movement will remain positive with a continued reading above 50 and have the potential to retest higher levels.
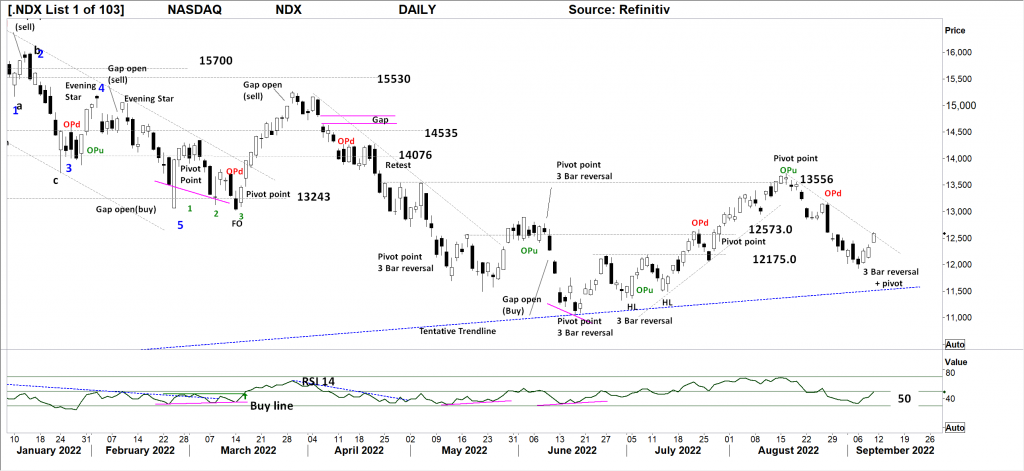
Comments from Last week: The continued movement lower from the “Opd” sets up the trendline target circa 11,500 points. This seasonally weak period of the year may be self-full filling, so the current declines cannot be ignored as a signal of further weakness given the current close below the 12,175 level.
USD Spot GOLD – DAILY: Is it a Bull market? Answer = No
Gold is developing a second bear flag pattern with the potential to retest lower towards the $1676 level. These flag pattern have around 50 % success rate of indicating direction,
however given price has remained within the declining channel. The underlying Primary trend remains down.
Indicator: Relative Strength 14:
Price momentum is working lower with the RSI turning higher below the 50 level is a result of the bear flag consolidation. (Price consolidation would naturally see the RSI drift back too around the 50 level. A strong movement either way will show the next directional move.)
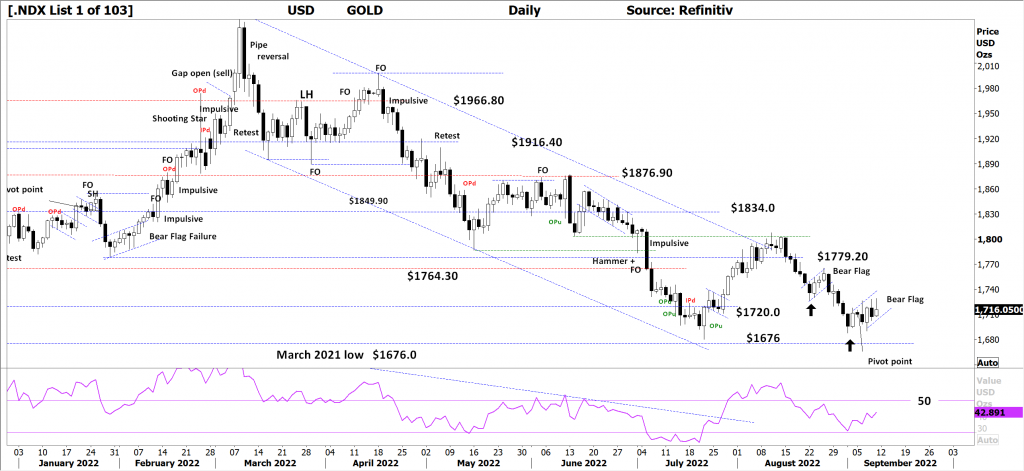
Comments from Last week: Gold continues the decline back into the channel, next support level indicated is $1676.0. Fridays close sets up a bullish pivot point, however this reversal signal is set against the Primary down trend and without any further catalysts for price support further declines should be expected. Price momentum has again turned negative, the current “uptick” my be discounted very quickly.
SILVER DAILY Price structure: Bull market? – No
Silver is setting up a bear flag pattern within the down channel with the next target of $17.20 being a support level from June 2020. The $18.40 level is the 2020 breakout level where Silver moved to the higher to the $27.0 level. Silver remains with the definition of a Primary down trend.
Relative strength 14:
Current Relative strength is rolling higher with the movement above the 30-level, RSI turning higher would reflect the underlying momentum turning positive or consolidating. A continuing move above the 50 level and higher would be very bullish signal in the short term. Price consolidation would see the relative strength turn towards the 50 level.

Comments from last week: Unlike Gold, Silver has set a decisive deeper low in this case below the $18.40 level with a test towards the $17.20 level. The potential for a retest higher to the $18.40 as resistance would give an indication of buyer strength or not. Silver remains within a Primary down trend without evidence of a base pattern or strong reversal.
AUD GOLD DAILY Price structure: Consolidation.
Australian dollar Gold now remains trendless as price consolidates. The reversal pivot at the 2537 level sets up a retest of 2440. The Australian dollar gold price has remained within a large consolidation range for all of 2022 so far. In face of rising material and wage costs for Australian Gold producers the margin squeeze on profit is holding Goldies lower.
Indicator Relative strength 14:
Relative strength has turned sideways and lower from above the 50 level, this shows an decrease in positive price momentum and remains a strong warning for further declines.

Comments from Last week: Again, nothing to report form this steady decline. Australian Gold producers will continue to trend lower as the $AUDXAU price decline. The $AUDXAU price remains within a very large consolidation zone and will continue to place Australian producers under price pressure.
COPPER DAILY Price structure: “V” recovery
Copper remains at risk of moving lower. However the pipe reversal is a strong signal buyers have re-entered giving price support for a retest of $3.80. A further close over $3.80 may set
a new primary movement to retest the $4.0 level.
Indicator: Relative strength 14:
Current reading has swung from below the 30-level to read higher as downward momentum has slowed to the pipe reversal, however the current reading remains below the key 50 level.
The key now, is for the RSI to swung back above the 50 level as a reflection of ongoing price gains. A sharp cross of the 50 level is required to offer a strong buy signal.
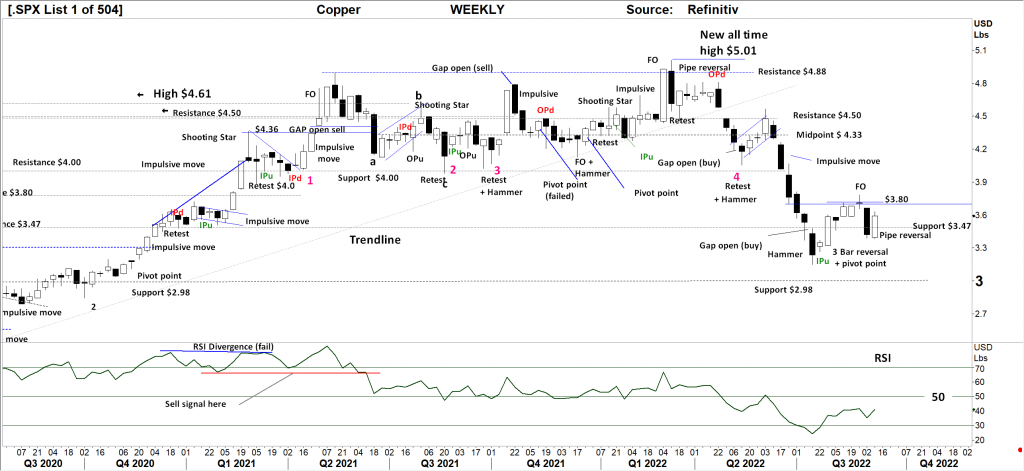
Comments from Last week: The FO discussed last week has followed through with lower prices, importantly the impulsive range close below the $3.47 level sets up a further retest of the $3.20 previous low level. Copper remains within a Primary down trend.
AUSTRALIAN VOLATILITY INDEX:
Volatility reading has moved lower and remains above the 13 level indicating forward pricing of PUT options remains strong. In general, lower equity prices or consolidation of equity prices is indicated as the reading remains above the 13 level.
For continued support of equities, the XVI should move below the “13” level.
The cost of 3month forward PUT options is decreasing from recent elevated levels.
The XVI is the difference between 3-month forward pricing of ETO Options against current month. As markets anticipate events, the forward priced option volatility changes, hence as forward price changes, this “skew” in pricing is measured in this XVI. The XVI value works as an inverse observation to the underlying market.

Comments from last Week:
USD DOLLAR INDEX Price structure:
The current retracement in the USD is providing support for commodity prices. The underlying primary trend remains UP. The last bar (Friday) is mildly bullish for further gains.
Indicator: Relative strength 14:
The Relative strength has turned lower in line with price movements indicating a loss of upward momentum, and should now be monitored for further consolidation as the current reading is above the 50 level but below the 70 level. This will move lower to sideways should price decline further, only a continued reading above the 50 level would indicate continuing strong price momentum.
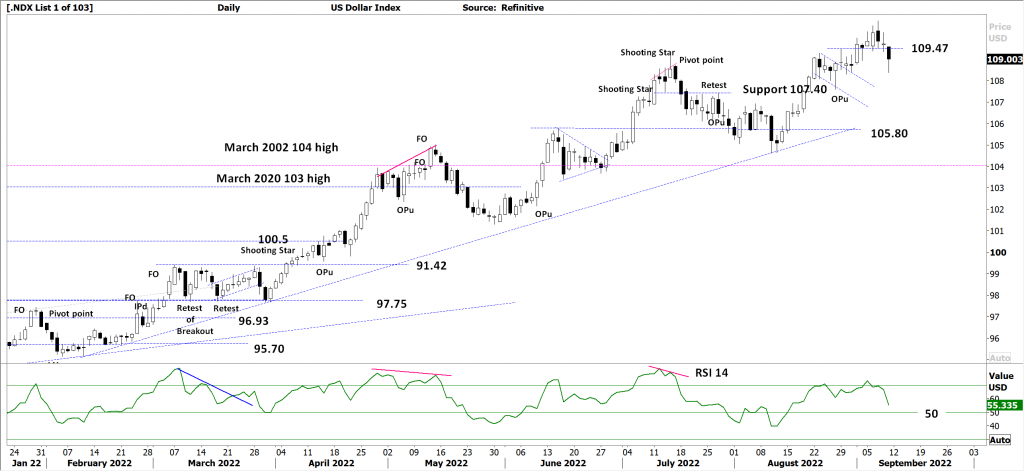
Comments from Last week: The close above the 110 level was quickly rejected last Friday, the potential now is for the DXY to enter into a consolidation phase above the 108 level. Underlying primary trend is UP. In the short term a continued close above the 109 level may follow through higher very quickly.
WTI – CRUDE OIL, Price structure: Full Bull Market remains.
This commodity is highly news driven around supply -demand. Oil is consolidating below the $94 support level, the breakdown below $94.0 could have followed through lower. Strong support is indicated at $84.25 provides a floor in the short term. The long term trendline is no longer relevant as price moves sideways.
Indicator: Relative strength 14:
The RSI turning towards the 30 is a result of strong price declines as momentum slows, a move over this key level would signal increasing positive price momentum.


 Access +10,000 financial
instruments
Access +10,000 financial
instruments