
XJO WEEKLY Price structure: Bearish Flag playing out
The XJO continues to build some support above the 3 Bar reversal pattern with an important close above the 6640 level.
The expectation is for the 6640 level to provide support in the coming week.
A close below this level would place the sellers in control with the potential to again retest the “tentative trendline” around the 6500 level.
The underlying Primary trend remains down.
Indicator: Relative strength 14:
Relative strength has closed above the 30 level. Overall price momentum remains negative.
Relative strength should now be monitored for a Bullish divergence signal.
A divergence signal is only possible should the Index make a new low below the 3 bar reversal level, while the RSI sets a higher low.
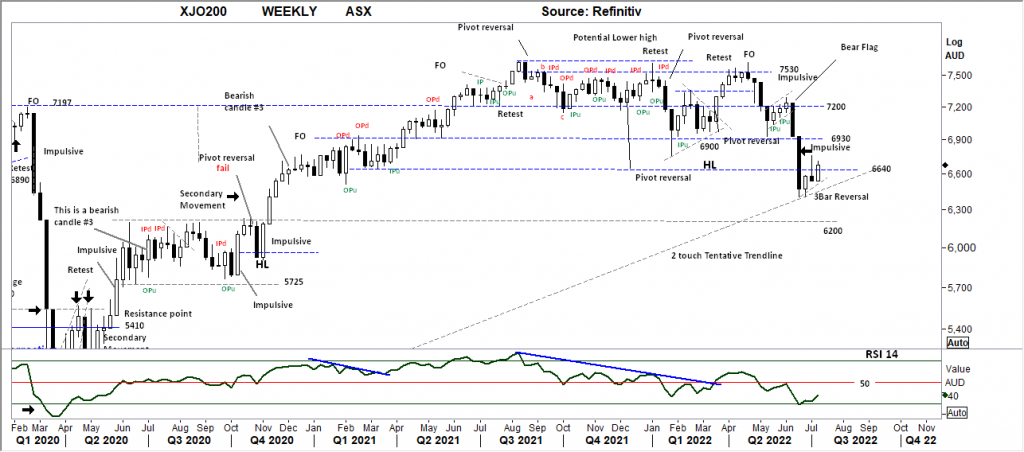
Comments from Last week: Last week the XJO attempted to push back above the 6640 level. Only a close above this level would be bullish in the short term. The congestion of price action during Q1 2020 is a good place to find some support, with last week completing a 3 bar reversal setup. This week will again be monitored for a close above the 6640 level as an important development towards a retest of the breakdown level of 6930..
XJO DAILY Price structure:
The Daily chart better shows the potential for further upside as the new “higher low” is now in place.
In the Daily time frame the 6765 level is the first resistance level, a close over this level would be a bullish signal for further gains and change the “DAILY” trend to an Uptrend.
Traders should consider the larger Weekly time frame for confirmation of new trends, but this shorter Daily time frame is an important bullish development.
Indicator: Relative strength 14:
The Relative strength Indicator (14) reflecting the underlying price momentum has moved higher from above the 50-level indicating the current changing momentum to positive. A continuing move above the 50 level would be a very positive indication for further gains in the underlying Index.
Indicator: VOLUME:
Last Fridays low volume bar is not an encouraging signal to indicate new buyers are entering the market.
Rising trading volumes are required to confirm the upward bias of the Index. These are not present in the past 5 trading days.
Only strong volumes over 1Bil on a Daily basis would indicate strong new money buying.
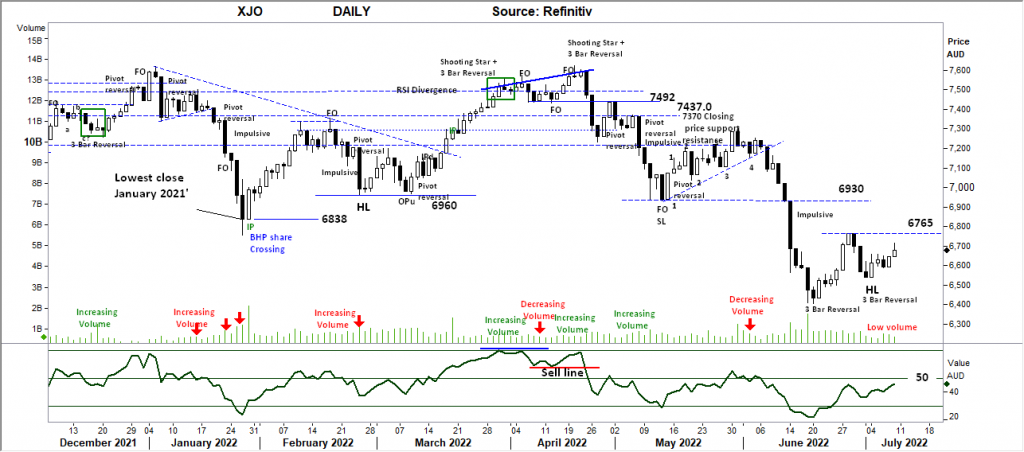
Comments from Last week: Following a strong start to last week the rejection into the close on Friday has been completed on very low volume. This is a strong indication the sellers are exhausted for now. The first Daily resistance level to clear this week is 6765, a close above this level would confirm a “higher low” in place and setup a retest of the 2nd Daily resistance level of 6930 points..
S&P 500 WEEKLY Price structure:
The S&P has set an Inside period up close (IPu) this can be a very bullish signal for further gains.
Weekly support remains at 3715 with resistance shown at 4050, a break higher over this 4050 level would set a very bullish tone for the month of July.
Although the Primary trend remains down, these Bear Market rallies can offer some great trading opportunities in the short term.
The higher expectation is for a close over the 4050 level as seller seem exhausted at these levels.
Indicator: Relative strength Indicator 14.
Relative strength has shown a Bullish divergence signal with 2 weeks ago, setting the 2nd Pivot point low.
The “Buy Line” shown is the indicator of improving positive price momentum should the reading close over this level.
Overall this type of divergence signal is a good indicator for further price gains.
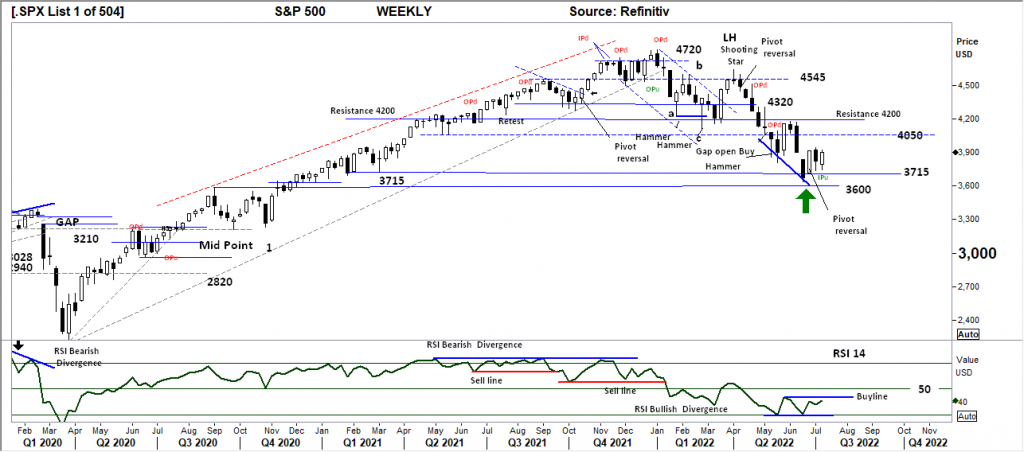
Comments from Last week: The Pivot reversal of 2 weeks ago has held the Index and may continue to provide support following last weeks attempted sell down to “retest” the 3715 level. The underlying Primary trend remains down, however last weeks “lower shadow” is a strong indication of early buying at a “low” price.
S&P 500 DAILY Price structure: Developing bullish structure.
The Daily chart shows price action remaining below the short down trend line and well below the 200-day moving average.
The current price pattern ( Cup and Handle) is a good setup for further gains, should the Index move over the 3940 level.
A breakout above the 3940 level would set a new Daily UP trend in place, but should be regarded as short term until the Weekly trend changes.
Indicator: Relative strength 14:
The Daily Relative strength bullish divergence signal followed by a sharp up turn shows improving price momentum to the upside.
Although still remaining below the key 50 level (just), a further cross over of the 50 level would be a strong momentum buying signal.

Comments from Last week: The daily chart of the S&P500 indicates a new “higher low” is now in place with last weeks Pivot 3 Bar reversal. This is a solid indication of buyers entering the market before a new low was made.
Further price gains to close over 3940 would set a new Daily UP trend..
NASDAQ DAILY Price structure: Primary DOWN Trend remains
History shows the Nasdaq has never had a negative close in the month of July (except 2007).
The Nasdaq has set a similar bullish pattern with the recent HL and OPu back stopping the move higher to test the 12175 level.
A close over this important level would give a very strong short term bullish signal for a further retest of 13542 resistance level in the coming weeks.
Indicator: Relative strength 14:
The minor divergence signal discussed last week has played out with the indicator moving over the important 50 level.
With a continuing move over the 50 level, price movement will remain positive and have the potential to develop into a new UP trend.

Comments from Last week: A strong reversal signal in the 3 Bar pattern is good confirmation of early trend reversal following the Divergence Buy signal. Price moving over the 12175 level will signal a new Daily UP trend and confirm the sellers are exhausted..
USD Spot GOLD – DAILY: Is it a Bull market? Answer = No
The move lower in Gold surprised many but remains within the confines of the current DOWN TREND.
Last weeks comments proven wrong with a further breakdown.
The daily time frame shown offers NO bullish development, with the potential for the price to test lower too $1719.0 support.
Indicator: Relative Strength 14:
Price momentum is working lower and below the 30 level, the Relative strength indicator turning lower is a reflection of the overall decline in price. The small UP turn shows the momentum decline losing strength.
Price consolidation would naturally see the RSI drift back too around the 50 level. A strong movement either way will show the next directional move.
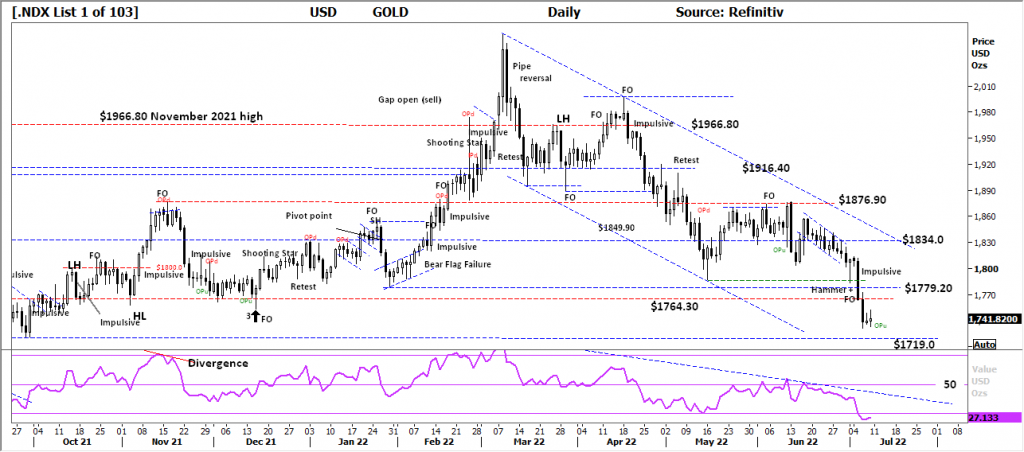
Comments from Last week: Last Friday set a “Hammer” bar, a very bullish reversal signal appearing on the long term trendline. Price made new lows as a fake out move against the $1786.60 low set Mid May. During this retest the session bar was fully black with late buying coming in to lift the price to session highs, a very strong indication of short covering as buyers take control. The first resistance level is $1834.0, a close over this level would give buyers strength to hold for higher prices..
SILVER DAILY Price structure: Bull market? – Early signals are important. None
$18.40 is shown as the next support level in the current Primary decline in the price of Silver.
Last week saw the “back test” of the July 2020 break point ($19.60), the current price structure remains Bearish with further declines expected to test the $18.40 level.
A close over the resistance level of $19.60 would be an early bullish signal.
Indicator: Relative strength 14:
Current Relative strength is moving lower and remains below the 50-level, RSI turning lower reflects the underlying momentum.
A continuing move below the 30 level and lower would be very bearish in the short term, and the potential for a further move higher remains only should price close above the $20.44 level.

Comments from last week:
The midweek break of $20.44 saw the high momentum price movement to retest the July 2020 original breakout point, an overall decline of 25%. This is again an indication of a low beginning to develop within a Primary downtrend.
This week may develop a bullish move with a close over $20.44, a turtle soup type bullish setup..
AUD GOLD DAILY Price structure: Consolidation.
Comments last week highlighted the consolidation phase underway, the breakdown this week to again test the 2537 level was done with a strong breakdown move, the current short range movement last Thursday and Friday suggest support is being found at this level.
A move higher in the $AUD would be a bearish outcome with the potential for price to move lower to the next support level of 2477.0.
Overall this price structure has remained within $2712 resistance and 2477 support for over 12 months, placing pricing pressure on local GOLD producers.
Indicator Relative strength 14:
Relative strength has turned sideways below the 50 level and moving towards the key 30 level indicating a decrease in upward momentum. Relative strength may continue to track lower as price has the potential to retest the $2277.0 support level.

Comments from Last week:
Consolidation continues between 2676 and support 2610. Last Friday’s strong range “low to high” may be the catalyst to further gains to set a breakout signal. For the current chart $AUD Gold remains within consolidation.
COPPER DAILY Price structure: Primary DOWNTREND
As discussed last week the current move in Copper below the $3.80 level is a significant development in the overall pricing structure and the retest of the lower $3.50 level took place.
Last weeks close above the $3.47 – $3.50 level is a good signal of initial support, a close above the $3.80 level would give technical traders a base from which to be long Copper at these levels.
Indicator: Relative strength 14:
Current reading has swung from below the 50-level to move lower to the 30 level, below this important divider between negative momentum and positive momentum reflecting the current reversal move underway.
The key now is for the RSI to swing back above the 30 level as a reflection of ongoing and any positive underlying positive price momentum at this important support level.
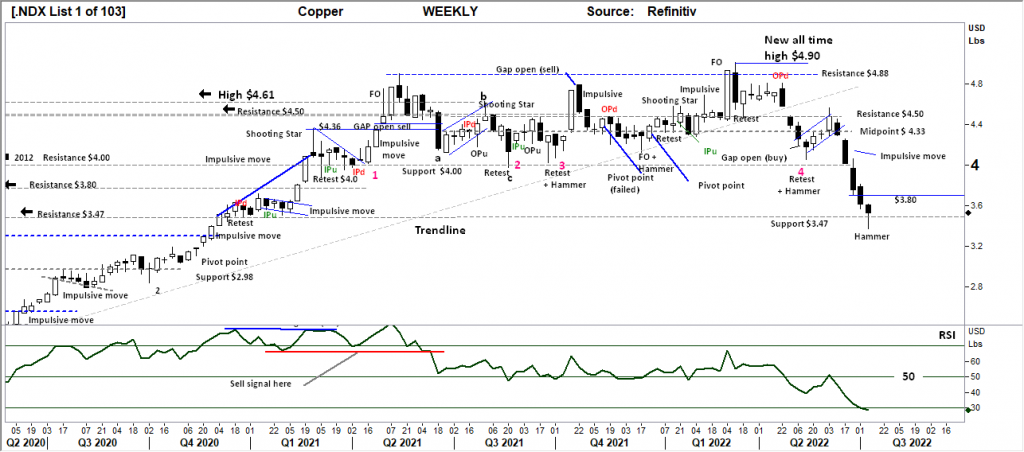
Comments from Last week: A reflection of the Global concern of an economic slowdown, Copper trades below the support level of $3.80lb. The next support level is $3.47 – $3.50. This is the level to monitor for a reversal signal, a close above the $3.80 level would be encouraging for the bullish.
AUSTRALIAN VOLATILITY INDEX:
The decrease in volatility has reflected in the late rally in equities. For continued support of equities, the XVI should move below the “13” level.
Last week the 3 months forward PUT option insurance has decreased, suggesting a more risk on approach.
While the reading remains above the key “13” level as a bearish indicator further declines in equities could be expected.
The cost of 3month forward PUT options is decreasing from recent elevated levels.
The XVI is the difference between 3-month forward pricing of ETO Options against current month. As markets anticipate events, the forward priced option volatility changes,
hence as forward price changes, this “skew” in pricing is measured in this XVI. The XVI value works as an inverse observation to the underlying market.
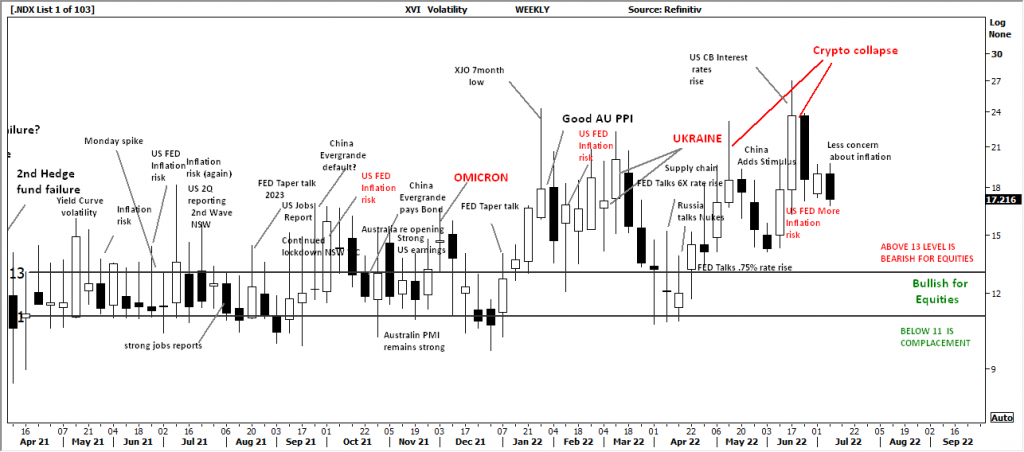
Comments from last Week: The XVI value is expected to rise this week as forward protective risk is again priced in.
USD DOLLAR INDEX Price structure:
Last week saw the Index trade strongly higher with a decisive breakout above the 105.80 level.
With he “shooting star” in place as a reversal signal look for a retest of the 105.80 level to hold for the structure to remain Bullish.
Indicator: Relative strength 14:
The Relative strength has turned higher in line with price movements and should now be monitored for further momentum strength as the current reading above the key 70 level could move higher to sideways, only a further reading above the 70 level would indicate continuing strong price momentum.
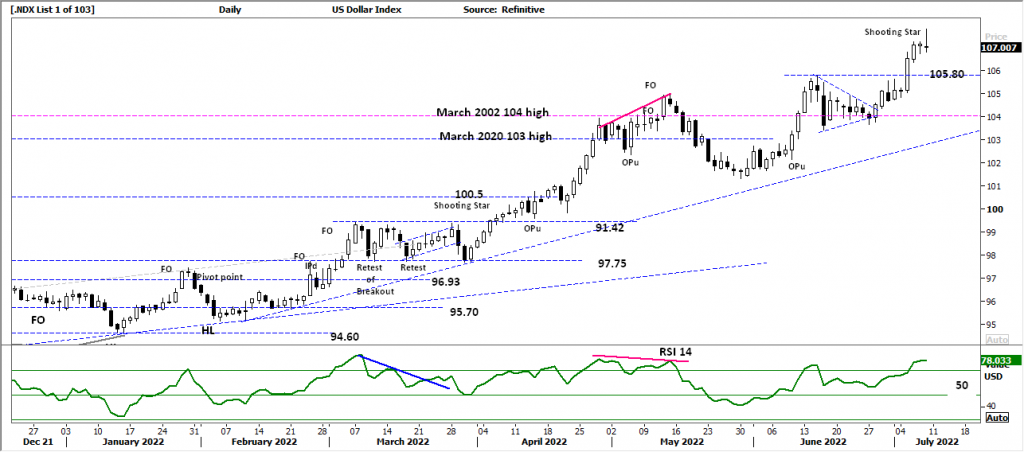
Comments from Last week: The $USD Index has failed to take out the 105.80 high as two rejection bars show from last Thursday/Friday. As expectations of a Global slowdown continue, the $USD Index may consolidate further at these levels..
WTI – CRUDE OIL, Price structure: Full Bull Market remains.
This commodity is highly news driven around supply -demand.
Last week the WTI tested towards the $94.0 level and found immediate buying to lift the final closing price above the important $100 level.
The current price structure is consolidation above the $94.0 support level.
The underlying Primary trend remains UP with the expectation of higher prices.
Earlier commentary suggested a blow off high to $130.0bl, this remains the base case within this Primary UP trend.
Indicator: Relative strength 14:
Relative strength is developing a divergence signal as price makes a new high without the Relative strength making a new momentum high. The sell signal has developed now that the RSI line has crossed down below the internal low (red) line currently in-play.
During price consolidation periods the RSI naturally drifts towards the 50 level as price finds balance.


 Access +10,000 financial
instruments
Access +10,000 financial
instruments