
Commodities and commodity stocks continue to rally against perceived shortages, both soft and hard products continue to trend higher.
Markets begin to price in higher inflation and more expensive money. The technical reversal signal mentioned 2 weeks ago is beginning to play out as major Indices find continuing resistance to higher prices.
The seasonal price weakness of the May period is fast approaching.
Sentiment remains divided about the immediate direction of markets, the Technicals seem to be pricing in a higher inflation higher interest rate environment.
Gold and Silver remain well within consolidation zones, and do not display any real bull market price activity. Both are highly tradable within the current price ranges.
The West Texas Oil contract is developing price support above the $94.0bl level.
XJO WEEKLY
Price structure:
The XJO has again found resistance at the 7530 level with price rejection to close at 7478 points. The past week shows consolidation below this important level, with a heavily weighted commodities component along with stability in the financials the index could be expected to hold these levels prior to a breakout higher. This 7530 level has provided resistance for the past 9 months, only a solid close higher would be a significant change and set a bullish signal for further gains.
Indicator: Relative Strength 14
The Relative continues again, closing over the key 50 level. Price momentum remains positive, this will now be monitored for a downturn should prices consolidate below 7530 points. As the Relative Strength Indicator reflects price momentum, the current weekly closing price displays slowing price momentum.
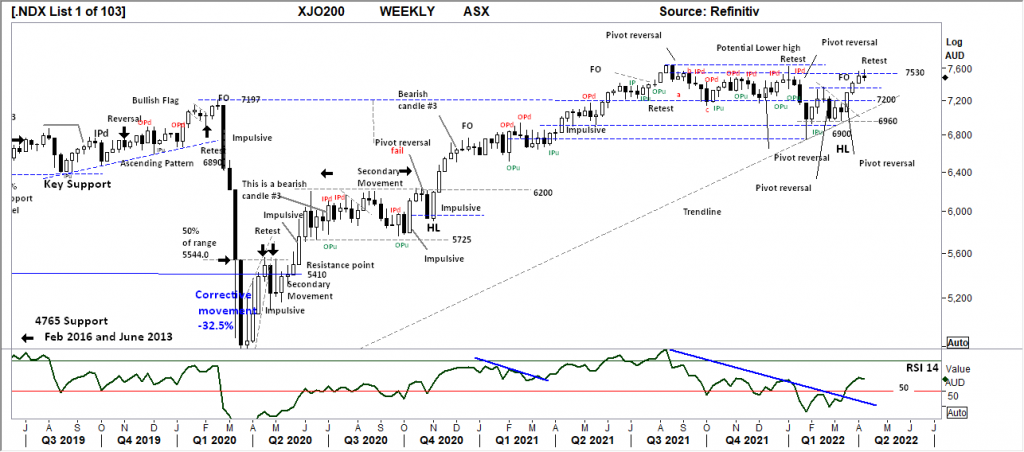
Comments from last week: The XJO has again found resistance at the 7530 level with price rejection to close at 7493 points. This level has provided resistance for the past 9 months; a close above this 7530 level would be a significant change and set a bullish signal for further gains. Considering this is the 3rd straight week of gains, some profit taking could be expected in the coming week.
XJO DAILY
Price structure:
The Daily Chart shows an intimate resistance at 7492, tested during last Friday’s trading session. This market is displaying a potential failed retest of the highs, the first indication being the Fake Out (FO) set last Tuesday with Friday’s retest not closing above the 7492 resistance level.
Indicator: Relative Strength 14
The Relative Strength Indicator (14) reflecting the underlying price momentum has moved lower from the 70-level indicating a shift to slowing momentum.
The Daily chart is now in a divergence sell-off.
Only a further cross above the 70 level will provide a signal of strong price momentum.
Indicator: VOLUME
Trading volumes have been relatively low during the past week leading to last Friday’s low volume close. The volume will be monitored for any further decrease as a signal of buyers unwilling to enter the market. Strong volumes over 1Bil on a Daily basis would indicate strong buying.
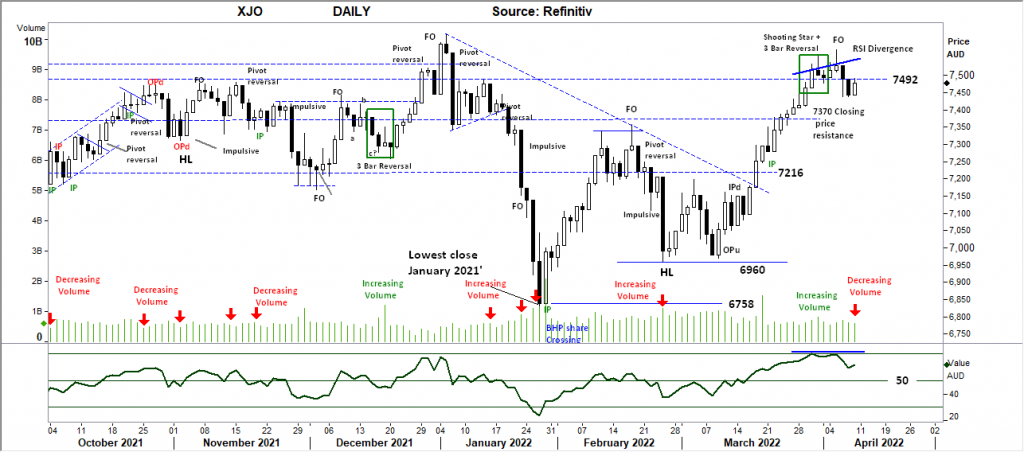
Comments from last week: Late last week the Index set a shooting star (Thursday) followed by the small Doji bar to close the week. The final 3 bars have set a 3 Bar reversal pattern and should be monitored for further declines below the minor 7492 support level. Following the strong gains from the previous 11 sessions, profit taking could be expected, the level of decline may test the first support level at 7370.
S&P 500 WEEKLY
Price structure:
The S&P shows the early development of a “lower high” being set as the week ended with a bearish pivot point close. Resistance of 4545 is again developing from the earlier support shown during Q4 2021. To remain bullish a Weekly close above 4545 is required; failure to do so will result in a lower high being set and a retest towards the 4200 level becoming a best case scenario.
Indicator: Relative Strength Indicator 14
Price movements are considered positive with a reading above the 50 level, with this continued reading turning sideways while above the key 50 level indications are that price momentum is slowing, an ongoing reading falling below 50 would confirm the Bearish rejection bar setup in the price chart. The potential for an accelerated move lower remains as the momentum slows and moves below the 50 level.
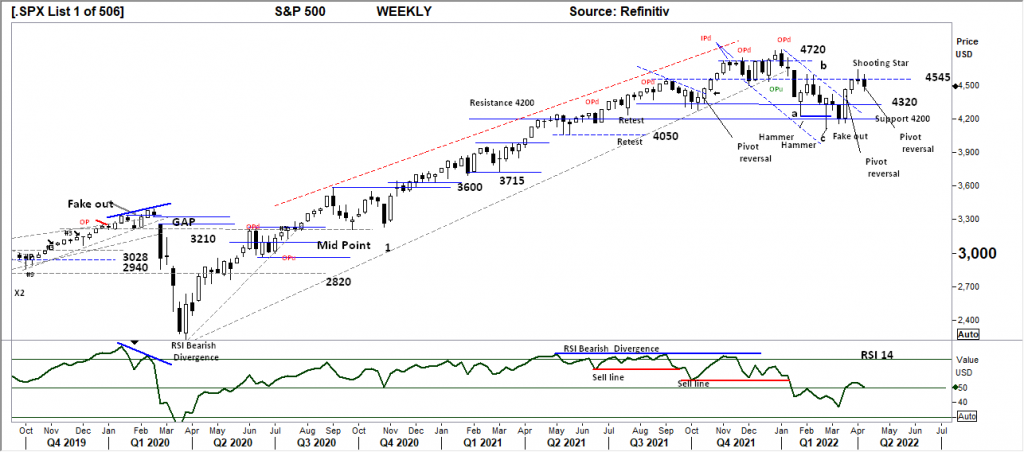
Comments from last week: The months a, b, c retracement has set a Downtrend in place, this current rally can be seen a “corrective” within an early Bear market. The significant Support – Resistance level of 4545 is again in play with the S&P 500 again showing higher price rejection above this level. The low close in the range has set a Shooting Star for last week. This identified reversal bar may see prices follow through lower to retest the 4320 level of support, a very important level to hold for the market to remain Bullish.
S&P 500 DAILY
Price structure:
All of the signals for lower prices. The “Gap open sell signal” followed by the “OPd” (outside range) followed by daily resistance setting up at 4520. With price consolidation a bear flag has developed within the last 3 trading days, a breakdown would see the first target of 4420 in play. A continued move lower would further confirm that a “lower high” is now in place.
Indicator: Relative Strength 14
Relative Strength Indicator (14) has again moved lower, remaining below the key 70 level. A continued lower close towards the 50 level would alert traders to further decreasing price momentum and potential price breakdown too and below the 4420 level.
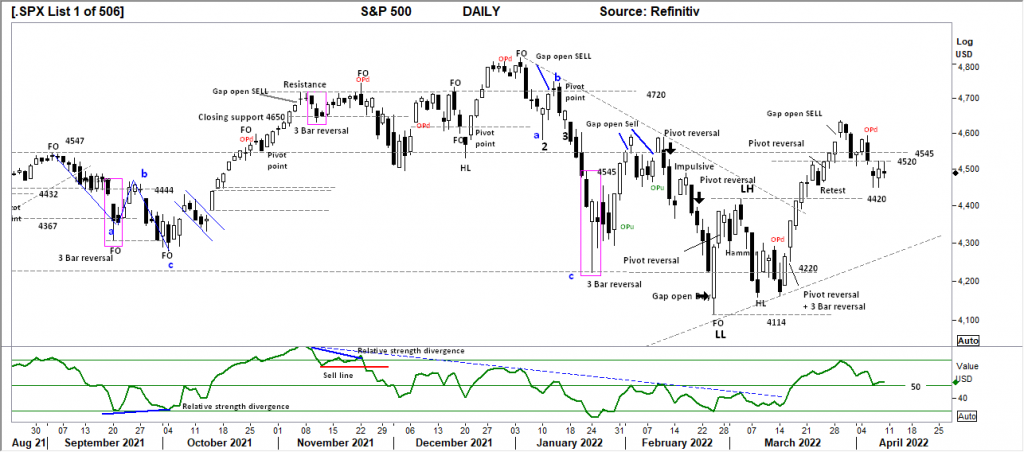
Comments from last week: The “Gap open Sell” signal from Tuesday past has played out with the S&P moving below the key 4545 level. The small bullish bar on Friday’s close may follow through higher, however a Bearish Lower high has been set with last Friday’s trading bar potentially being a “retest of the high. The key observation is last Thursday’s large range movement. With a further decline, the first Daily support level is shown at 4420. As set out in the Weekly comments, the recent move higher is regarded as “corrective” only.
NASDAQ DAILY
Price structure:
The price rally during the March period is now confined to a corrective move with a developing bear market. Price rejection of 14535 has seen the Nasdaq close on the lows of the week, confirming a “lower high” in place and a retest of the 14076 level is underway.
Indicator: Relative Strength 14
Relative Strength has turned lower, moving below the key 50 level, changing to bearish price momentum from the 14 day look back period.
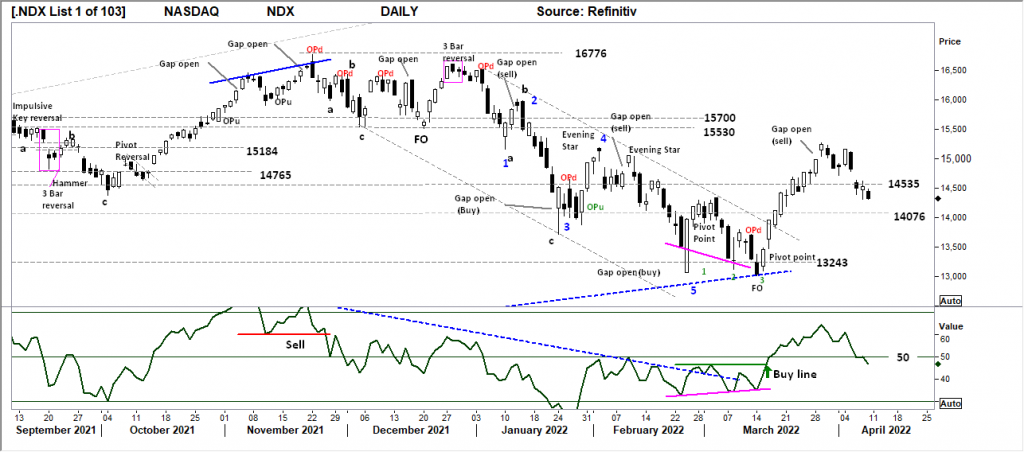
Comments from last week: As with the other Major indices the Nasdaq has also posted a “Gap open sell” signal following the recent “corrective” movement higher from the 13243 level. Basic trend analysis would suggest a further decline to retest 14535 and potentially 14076 points. As part of the process the high of 15,265 may be retested in the coming days, only a close above this level would indicate a further bullish move higher.
USD Spot GOLD – DAILY:
Is it a Bull market? No.
Strong support is developing along the $1916.40 level. Gold remains within the consolidation range of $1916.40 to resistance of $1966.80; last Friday’s strong price action is setting up a retest of the $1966.80 level. Only a strong close above this level would give the first bullish signal required for a potential retest of the $2000.0 plus level.
Indicator: Relative Strength 14
Price momentum has rolled higher, the indicator continuing to move above the 50 level will be the critical observation this week as a signal of increasing price momentum that may continue to move higher above the 50 level.
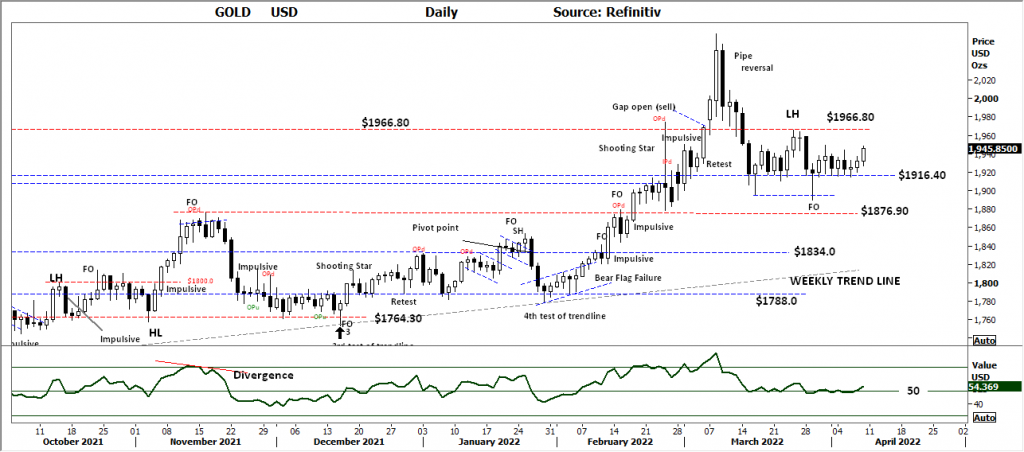
Comments from last week: This is not Bull market price activity. Current price action is regarded as a Secondary movement (consolidation) in this case Bearish consolidation. The $1916.40 level is now the key support to hold in the short term; a break of this level would see a retest of the $1876.90 level and potentially lower. Ultimately Gold may set a new Primary UP trend for fundamental reasons, however current price action suggests further consolidation above $1876.90.
SILVER DAILY
Price structure: No Bull market – yet.
Silver showing a swing low in place as price now closes above the key level of $24.73 ($24.75). This overall Bearish decline from the $27 highs has room to move lower to retest the breakout levels at $23.50. In the immediate price action, Silver remains within the confines of a Daily down trend. For a bullish case to persist, a close towards the $25.4 level is required.
Indicator: Relative Strength 14
Current Relative Strength is moving below the 50 level and now turning higher shows price momentum is increasing in this retest of the $24.73 area. A continuing move above the 50 level and higher would be very bullish in the short term, and the potential for a further rally remains as price consolidates above the $24.73 level.
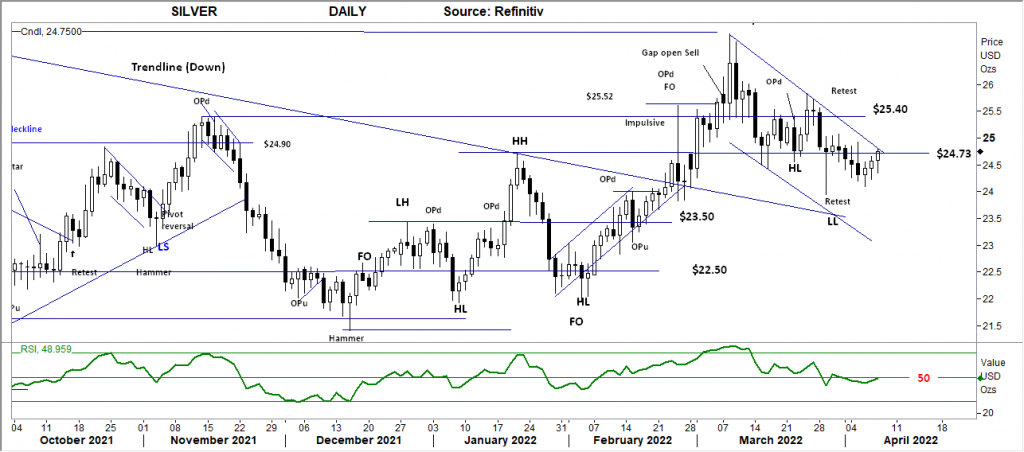
Comments from last week: The price chart of Silver continues to develop a complicated Bullish Flag as price probes lower below the $24.73 level. Last Tuesday saw the “retest” of the downtrend line with a solid close at the $24.73 level, the key observation here is there was no follow-through higher with last Friday closing below this key level. Silver continues to remain within a large multiyear consolidation above $21.50 and below the $27.0 level.
AUD GOLD DAILY
Price structure:
The initial break of support at $2541.0 has quickly reversed as the 3 Bar reversal pattern has followed through higher above the $2600.0 level. This now sets a bullish signal for further gains, and support for the local Gold producers. A further rally in the $USD Gold price could facilitate further gains for the $AUD Gold price to retest the $2712.0 level.
Indicator Relative Strength 14
Relative Strength has turned higher from below the 50 level and moved towards the key 50 level. With the loss of positive momentum, Relative Strength may continue to track sideways during any potential consolidation period. The RSI divergence ( although a move below the 30 level did not occur) is in place.
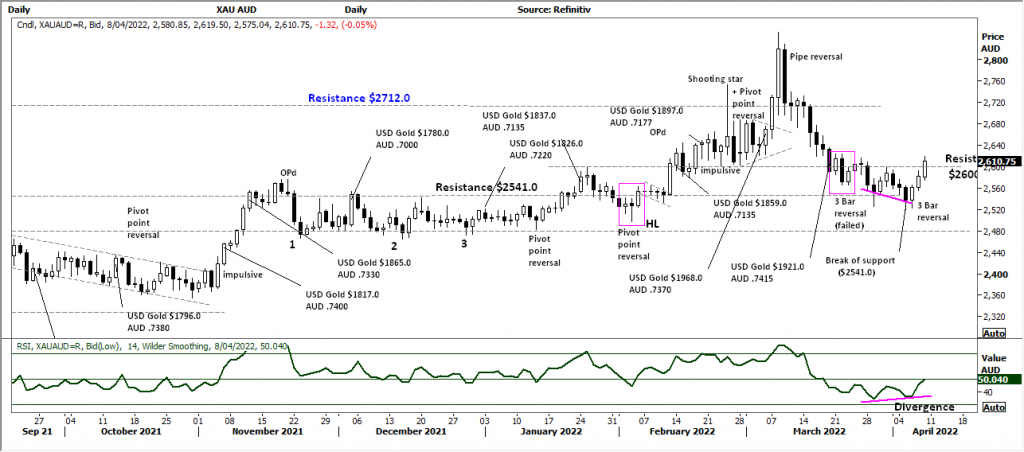
Comments from last week: The current price action within this Australian Dollar Gold reference will not fare well for the local producers in the short term. The 3 Bar bullish reversal referred to last week has failed to follow through higher. With price now consolidating above the key $2541 level and below $2600, this tight range becomes a low volatility area that will ultimately breakout in a volatile move.
COPPER DAILY
Price structure:
Another week of consolidation in the Copper chart, however last week saw a higher high and higher low compared to the previous week. This may build into a Bullish flag with the potential to retest the $4.90 high price area. The whole price structure from Q1 2021 remains bullish as resistance levels become support levels, the most recent is the $4.50 level acting as price support 4 weeks ago.
Indicator: Relative Strength 14
Current reading has swung sideways above the 50-level reflecting the current consolidation move underway. The key for now is the RSI remains above the 50 level as a reflection of ongoing and any positive underlying positive price momentum.
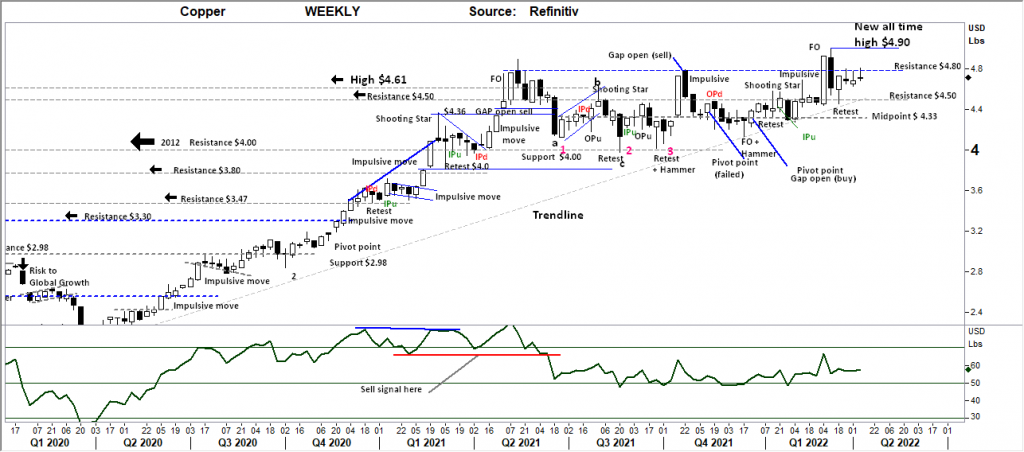
Comments from last week: Another week of consolidation in the Copper chart, however last week saw a lower high and lower low compared to the previous week. This may build into a Bullish flag with the potential to retest the $4.90 high price area. The whole price structure from Q1 2021 remains bullish as resistance levels become support levels; the most recent is the $4.50 level acting as price support 3 weeks ago.
AUSTRALIAN VOLATILITY INDEX:
Last week saw underlying volatility again decline sharply as markets price in some clarity around interest rates and the Ukraine war. The late week rise in the XVI value again underscores the reversal signals in the Major Indices, forward protection is now being priced in by the Options market. Only a further increase in the XVI this week would provide a Bearish undertone for markets as future risk coverage is taken.
The XVI is the difference between 3-month forward pricing of ETO Options against the current month.
As markets anticipate events, the forward priced option volatility changes, hence as forward price changes, this “skew” in pricing is measured in this XVI.
The XVI value works as an inverse observation of the underlying market.
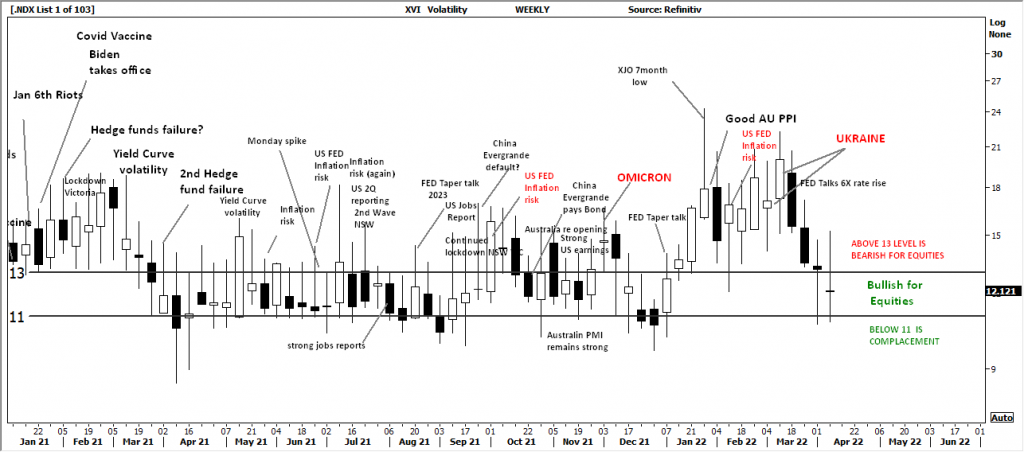
Comments from last week: Forward pricing of PUT options remains on a high skew to current pricing. The market is paying the highest prices since Q4 2020 prices for forward protection. The outcome remains Bearish pressure on local equities.
USD DOLLAR INDEX
Price structure:
The USD Index traded to the 100 level last week only to set a rejection “shooting star”. A retest of the 99.5 level remains the first level of support. Overall the Primary Trend remains UP.
Indicator: Relative Strength 14
Relative strength has turned higher in line with price movements and should now be monitored for further strength as the current reading over the key 50 level should move higher, a further reading above the 70 level would indicate very strong positive price momentum.
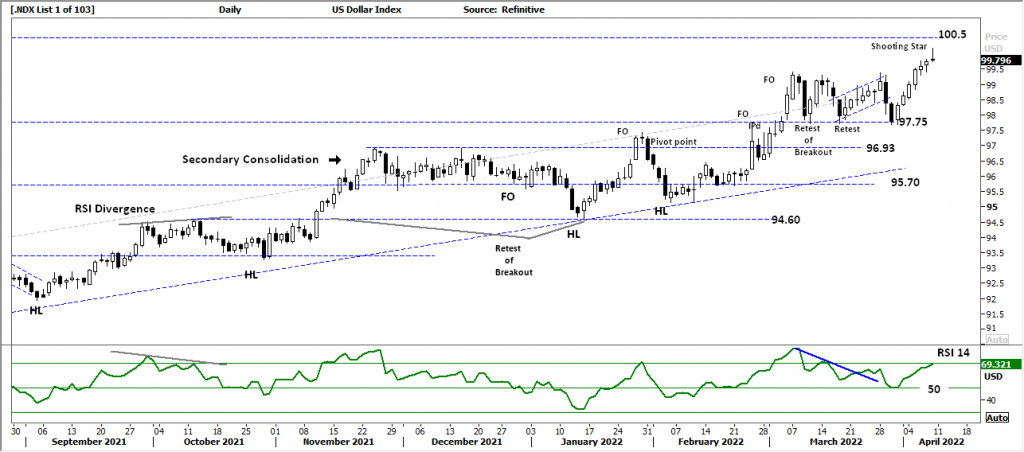
Comments from last week: A bullish move underway as the 97.75 level finds buyers. Last Wednesday / Thursday saw the third retest of this level. This current price action is very bullish for further gains, with the potential to retest the 100.5 level in the coming weeks.
WTI – CRUDE OIL
Price structure: This commodity is highly news driven by supply -demand.
The WTI contract is building a new support level at $94.0 as price trades back toward the key psychological level of $100bl. This $94.0 level will be the key level to hold in the coming week; a break of this level would see a potential retest of 84.25. The WTI contract remains within a Primary UP trend.
Indicator: Relative Strength 14
The current price reversal has produced a new low in the RSI, this will again be monitored for a developing divergence signal, although it may take many weeks to develop. The Relative Strength crossing and remaining below the 50 level is regarded as a Bearish indicator.
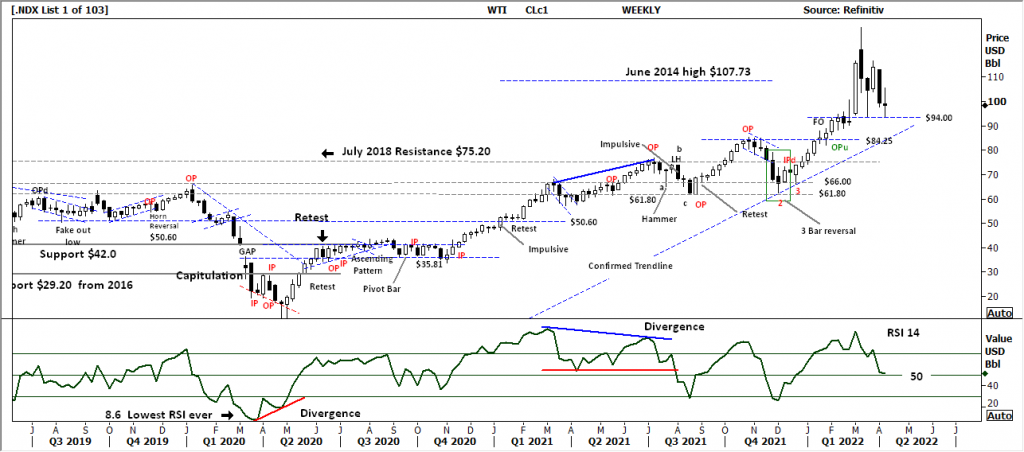
Comments from last week: A retest of the high has failed to show as a new Bearish pivot bar is now in place. The first level of support to monitor is $93.53 looking for price consolidation at this important level. With the underlying Primary trend remaining UP, the current retracement may test the longer term trendline around the $84.25 level. The $84.25 level is also the breakout level of 11 weeks ago.


 Access +10,000 financial
instruments
Access +10,000 financial
instruments